
by Ahmad Tekriti | May 5, 2020 | Visualization
My morning dark coffee was mixed lately with the sorrowful news regarding the collapse of the Lebanese economy. People are losing their jobs, their purchasing power, and even their hope to rise again. I felt for a couple of times that we are powerless and it’s the time to accept that hope is only a way to package the melancholic truth.
In my attempt to find any light inside the deep dark hole that we are inside, I remembered the metaphor of Lebanese phoenix that I heard about during the 2006 July war. Phoenix is the bird who can arise from the aches according to Greek mythology. Beirut, the capital of the old country, like the phoenix, was rebuilt more than seven times according to legend. So, to strengthen the glimpse of hope with actual reality, I searched for a recent stage where Lebanon was rising. I surprised when I found that between 1950 and 1974, Lebanon was in a golden stage with a GPD per capita is greater than many developed counties nowadays! So, my current concern becomes while drinking my morning coffee is how we can make the Lebanese phoenix rise again?
Note: I created this graph using tableau software based on the data from Maddison Project Database 2018.

by Sirine Jaber | May 5, 2020 | Dashboard
Suicide
Each year, One million persons die r because of suicide, and this reflects a mortality rate of one death every forty seconds.
Additionally, the rates of suicide deaths have increased by 60% in the last 45 years worldwide. For this, suicide became one of the three main causes of mortality among the males and females that are 15 to 44 years old. This is a problem that is a concern for every country therefore performing data exploration and analysis is of high importance, few recommendations will be suggested and will be directed to governments to take action at the first place and then to parents and schools to be aware of the reasons behind the increasing numbers in order to raise awareness among the future generations.
It is clear that East European countries have higher suicide rates compared to west European countries. Post Soviet Union European countries have very high suicide rates because of high economic and political instability that followed the collapse of the Union. These high rates are associated high levels of substance abuse.
For this, awareness should be spread about the dangers of substance use in educational schools and systems. Also, substance rehabilitation centers are a way to reduce the numbers of drug abusers and in turn reduce the suicide risk.
by Sirine Jaber | May 5, 2020 | Visualization
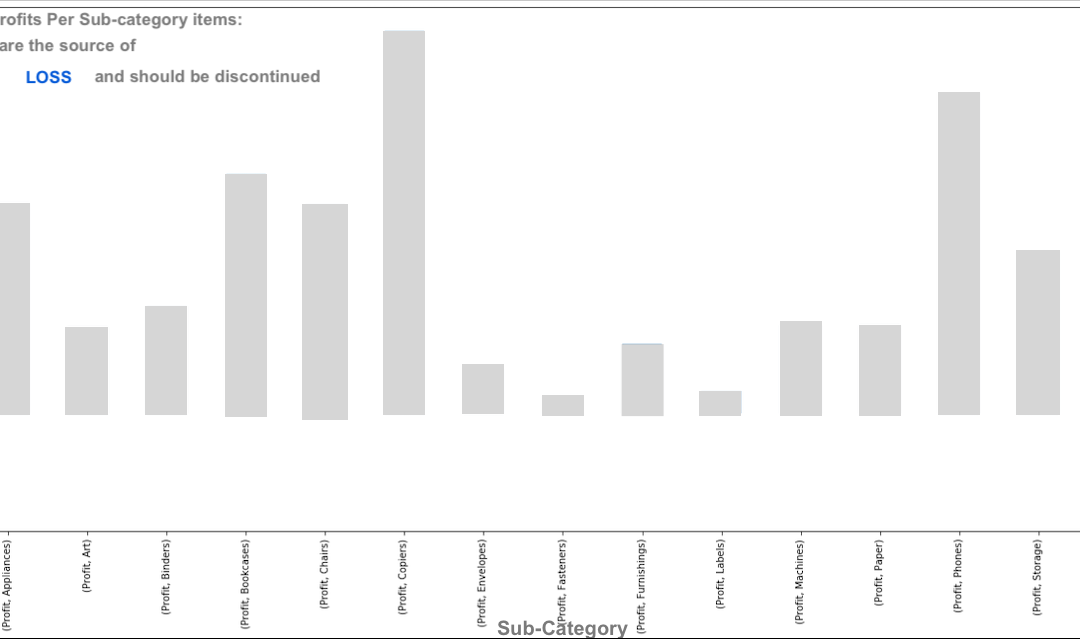
Looking at a super store data, managers are highly interested to have a clear view about their product lines and their relation to profits and losses.
For this reason a visualization of profits per product subcategories highlights the areas where high losses occur. This graph reflects the profits that each sub-category of items generates. It is clear that for this store, tables are losing and they are generating losses instead of profits. For this reason it is recommended to discontinue selling tables and Focus on other items generating high profits such as Copies and phones.
by Tarek El khayat | May 4, 2020 | Visualization
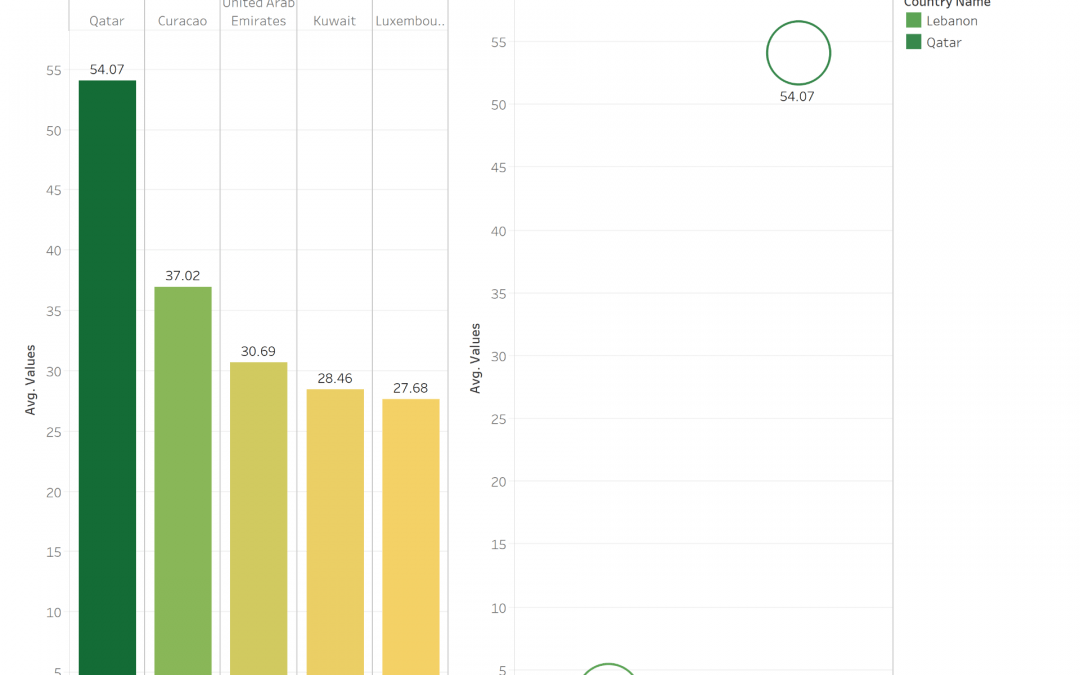
CO2 emission is one of the important factor that is destroying our planet and causing diseases, global warming …
The Graph shows the Top 5 countries with higher CO2 Emission and shows that QATAR take the lead in the world and the Arab region