by hhd19 | Nov 19, 2023 | Dashboard
Introduction:
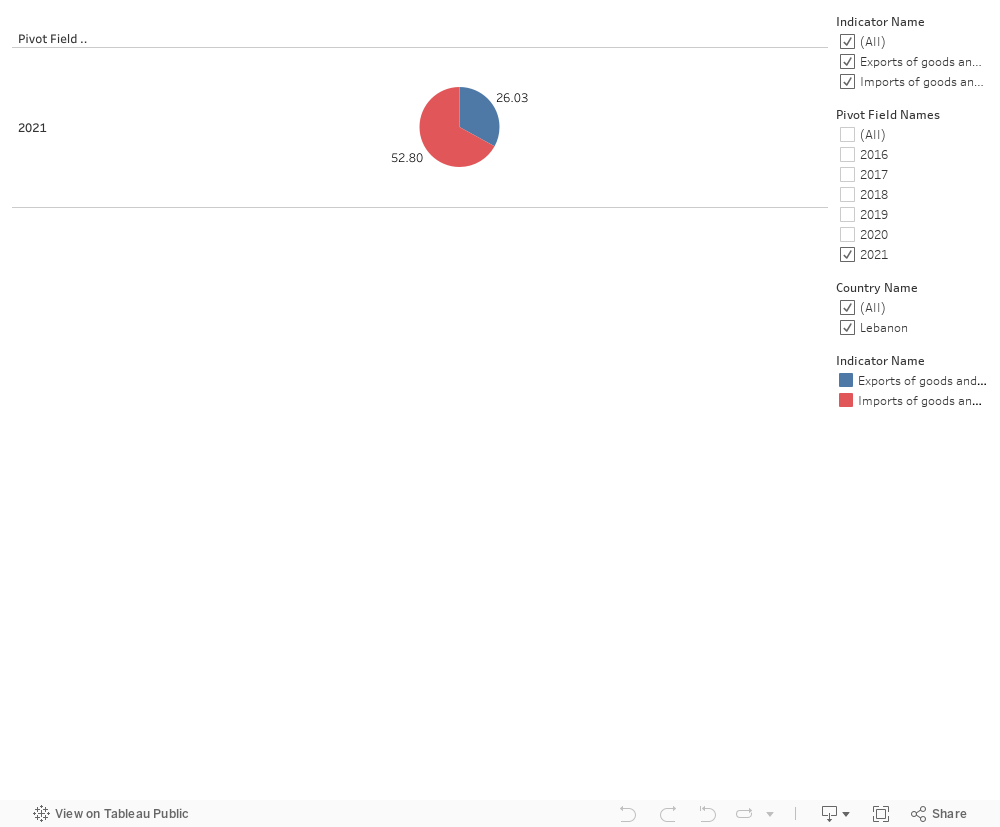
In the dynamic world of economics, trade balances play a pivotal role in determining a country’s financial health. This visualization offers a clear and concise representation of Lebanon’s trade situation over the recent years, focusing on the comparison between the exports and imports of goods and services as a percentage of GDP.
Context:
Lebanon, a country with a rich trading history, has faced various economic challenges exacerbated by political instability and global market fluctuations. Understanding the trade trends is crucial for policy-makers, businesses, and academicians to assess the country’s economic resilience and to strategize for future growth.
These pie charts are a visual summary of the economic challenges faced by Lebanon in terms of trade. They underscore the need for strategic planning and diversified economic reform to build a more balanced and self-sufficient economic structure.
In 2019, the pie chart illustrates that imports considerably outweighed exports, indicating a trade deficit. This imbalance suggests that the country was consuming more than it was producing for external markets.
2020 shows a slight shift with the reduction in imports and a marginal increase in exports. This change could be indicative of various factors, such as a change in economic policy, a response to external economic pressures, or the impact of the global events of that year, like the COVID-19 pandemic.
By 2021, the gap between imports and exports continues to persist, although there’s a noticeable improvement in the trade balance, with exports comprising a larger section of the pie.
Problem:
Lebanon is grappling with a trade deficit.
Solutions:
1- Diversification of Exports: Investing in diverse sectors to increase the range of goods and services for export.
2- Improving Domestic Production: Enhancing the quality and quantity of domestic production to reduce reliance on imports.
3- Trade Agreements: Entering into new trade agreements that favor Lebanese exports or revising existing ones to improve trade terms.
After working on these strategies developing these ideas, and through careful analysis and responsive policymaking, Lebanon can work towards a future where its exports and imports are in a healthier balance.

by yen03 | Nov 17, 2023 | Dashboard, Visualization
In the period from 2019 to 2022, Lebanon faced an unprecedented confluence of crises that tested the resilience of its people and the stability of its economy. This tumultuous period unfolded against the backdrop of the global pandemic, the devastating explosion at the Beirut port, and an already fragile political and economic landscape.
In 2019, Lebanon was already grappling with economic challenges, a weakening currency, and public discontent. Little did the nation know that a series of events would unfold, further exacerbating its struggles.
The Economic Downturn: The year 2019 witnessed a decline in Lebanon’s GDP growth, driven by a combination of economic mismanagement, political instability, and a growing public debt. The situation worsened in 2020 as the global COVID-19 pandemic took hold. The pandemic not only strained healthcare systems but also disrupted global supply chains, affecting trade and exacerbating Lebanon’s economic woes.
The Impact of COVID-19: As COVID-19 spread globally, Lebanon, like many nations, implemented strict lockdowns to curb the virus’s spread. However, these measures had a significant economic toll, particularly on sectors such as tourism, hospitality, and services. Unemployment rates surged as businesses struggled to stay afloat in the face of lockdowns and reduced consumer spending.
The Beirut Port Explosion: August 4, 2020, marked a tragic turning point for Lebanon. The explosion at the Beirut port sent shockwaves through the country, causing widespread devastation and loss of life. Beyond the immediate human toll, the explosion dealt a severe blow to the economy. The port, a vital economic hub, was decimated, disrupting trade and further straining an already fragile economy.
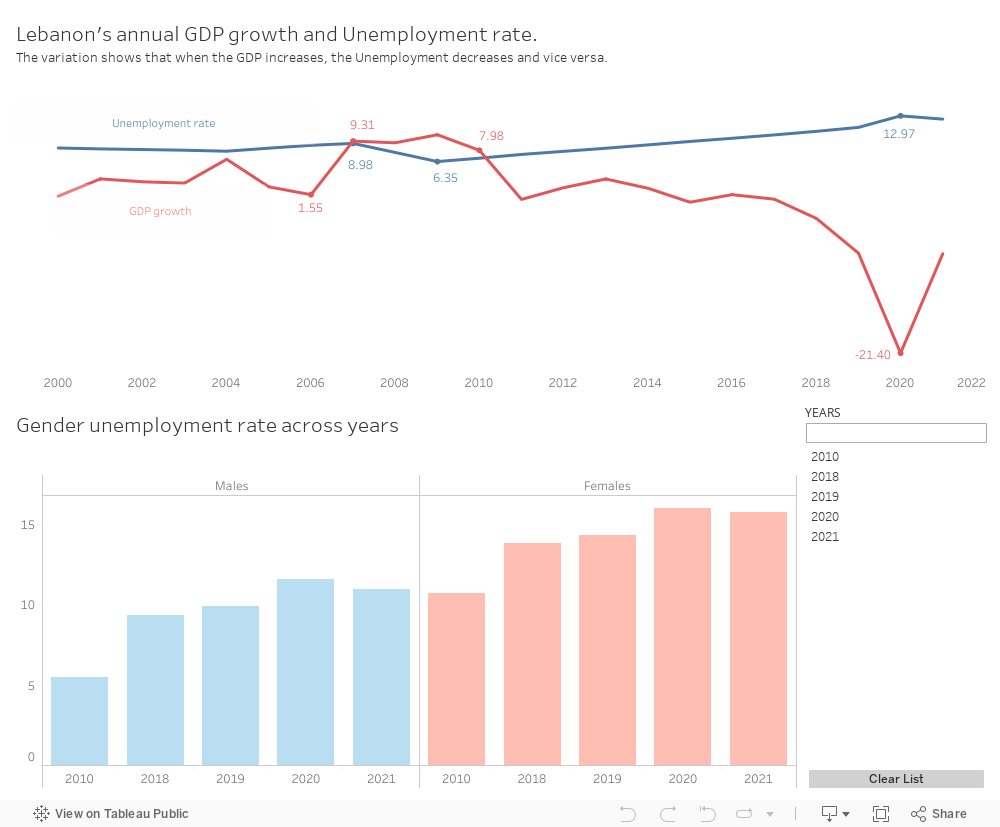
The Unemployment Crisis: As the GDP contracted, the unemployment rates, meticulously depicted in our Tableau visualizations, soared. The economic downturn, compounded by the pandemic and the port explosion, left countless Lebanese citizens without jobs. The barchart vividly illustrates the gender-specific impact, showcasing the challenges faced by both males and females in this turbulent period.
Solutions
Yet, in adversity lies the opportunity for resilience and recovery. As we examine the line chart depicting GDP growth, a glimmer of hope emerges. The chart illustrates a gradual increase in GDP in 2021, signaling a potential comeback.
To foster this recovery and bolster Lebanon’s economy, a multi-faceted approach is essential. Some potential solutions include:
- Economic Reforms: Implement comprehensive economic reforms to address fiscal challenges, improve governance, and attract foreign investment.
- Infrastructure Investment: Focus on rebuilding and modernizing infrastructure, including the reconstruction of the Beirut port, to stimulate economic activity and enhance trade capabilities.
- Support for Small Businesses: Provide targeted support for small and medium-sized enterprises (SMEs) to encourage entrepreneurship, create jobs, and revitalize local economies.
- International Aid and Collaboration: Seek international aid and collaborate with the global community to access financial assistance, technical expertise, and humanitarian support.
- Healthcare Investment: Invest in the healthcare sector to strengthen the country’s resilience to health crises, fostering a healthier workforce and more robust economic conditions.
As Lebanon charts its course towards recovery, these solutions offer a roadmap for rebuilding and fostering sustainable development. The line chart becomes a symbol of resilience, capturing not only the challenges faced but also the potential for renewal and progress.
Resilience and Hope: Despite these challenges, the people of Lebanon exhibited remarkable resilience. Communities came together to support one another, and NGOs and international aid played a crucial role in providing relief. The visual representation of GDP decline and rising unemployment underscores the urgency of addressing the socioeconomic impacts of crises.
Lebanon’s journey through these challenging years serves as a testament to the strength of its people. While the road to recovery is long and arduous, the collective spirit and determination of the Lebanese offer a glimmer of hope for a brighter future.

by aha152 | Nov 8, 2023 | Dashboard, Visualization
Ever heard of the Boiling Frog Syndrome? The ‘Boiling Frog’ syndrome is based on an urban legend describing a frog being slowly boiled alive. The premise is simple: if a frog is suddenly put into a pot of boiling water, it will jump out and save itself from impending death… But if you place a frog in a pot of cold water and slowly heat the water, the frog will not perceive the gradual temperature increase. The frog becomes accustomed to the warming water and does not react until it’s too late, eventually resulting in its demise as the water reaches a boiling point. The frog’s inability to sense the incremental change in temperature leads to its unfortunate fate.
Similar to the boiling frog, Lebanon’s population may have adapted to challenges it had been bearing, with some becoming desensitized to the increasing hardships. It is only when the situation reached a critical point, with a sudden and dramatic spike in inflation in 2019, that the gravity of the problem became evident. By this time, many were already deeply affected by poverty, economic instability, and a lack of basic necessities, setting the country on an uncertain path.
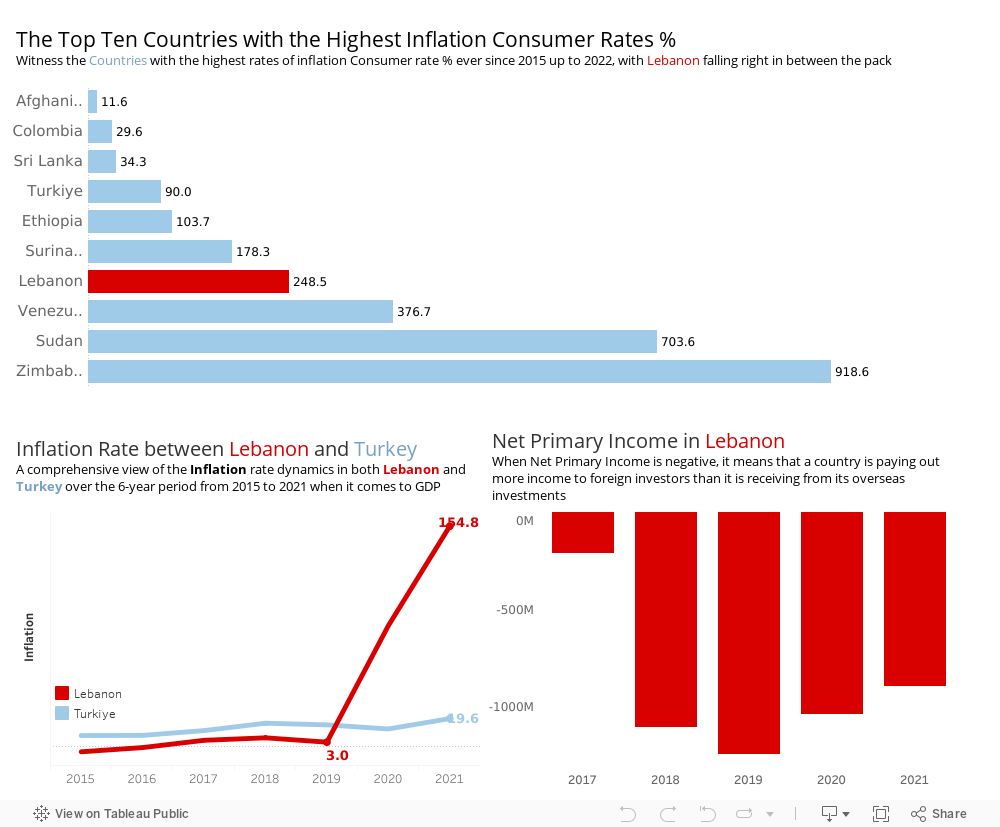
With the country already having been in debt before 2019, Lebanon was just falling into its worst state, for inflation rates were at an all time high, reaching record numbers, causing a widespread in poverty, where everyone got affected. Lebanon found itself among the top 10 countries with the highest inflation rates, a stark reminder of the severity of the issue. As if that weren’t enough, the nation’s Net Primary Income plummeted to record lows, exceeding $1.2 billion in negative Net Primary Income in 2019, causing hardships for its people and economy. In reference to Turkey, Turkey has also passed through inflation throughout its years, on a growing bases, however by 2021, Lebanon hit a 154% inflation rate with Turkey (even though it recorded its worst high ever) scored a 19.6% inflation rate.
Faced with this grim reality, Lebanon’s leaders and policymakers embarked on a journey to tackle inflation and work towards SDG 1, ‘No Poverty’, they implemented a multi-faceted approach. This included the introduction of transparent and effective monetary policies to stabilize the currency and control inflation. Additionally, they emphasized fiscal discipline, taking steps to reduce budget deficits, promote responsible spending, and enhance financial stability. Seeking international cooperation and drawing inspiration from successful global cases, Lebanon aimed to create an environment conducive to economic growth, job creation, and poverty reduction, ultimately striving to ensure that basic necessities became more affordable for its citizens.
by hhk25 | Nov 8, 2023 | Uncategorized
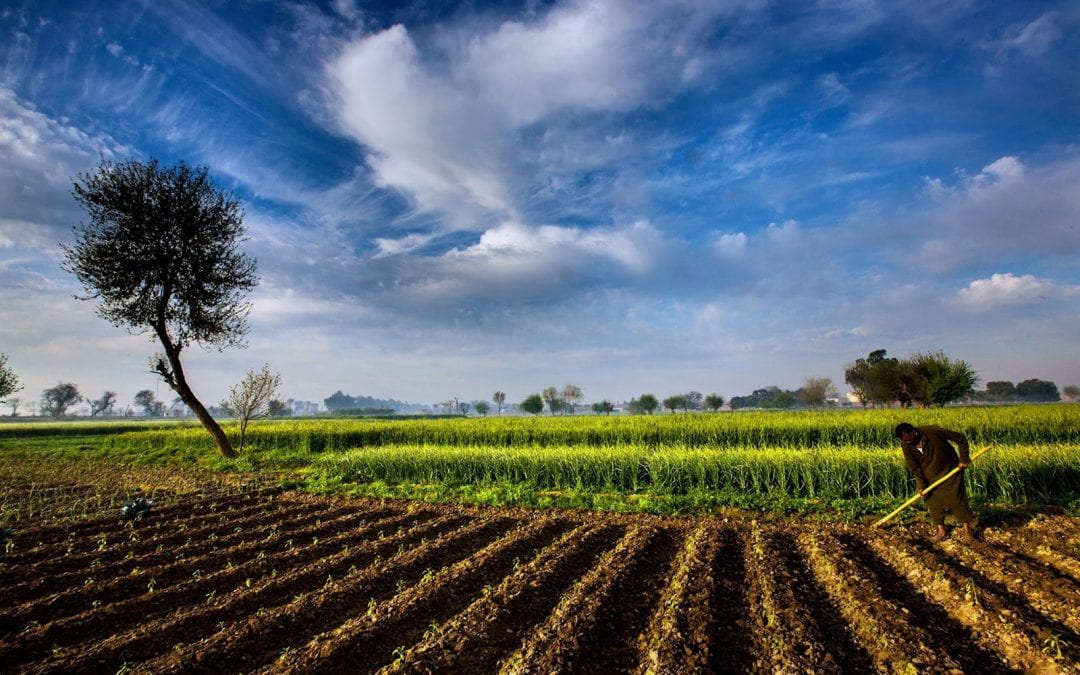
A world where economic diversification is often seen as the path to financial stability, Lebanon stands out as a nation that has primarily relied on non-agricultural sectors for its economic sustenance. Despite its rich agricultural potential, the country has chosen to prioritize other industries. As Lebanon grapples with a severe economic crisis, it’s crucial to examine the consequences of this strategy and consider whether a renewed focus on agriculture could offer a more resilient path forward.
The main problem Lebanon is currently facing!
- Lebanon is currently not placing sufficient emphasis on the agriculture and aquaculture sectors as potential revenue sources.
- This neglect comes at a time of economic hardship, marked by a consistent decline in GDP over the years.
Problem Evidence:
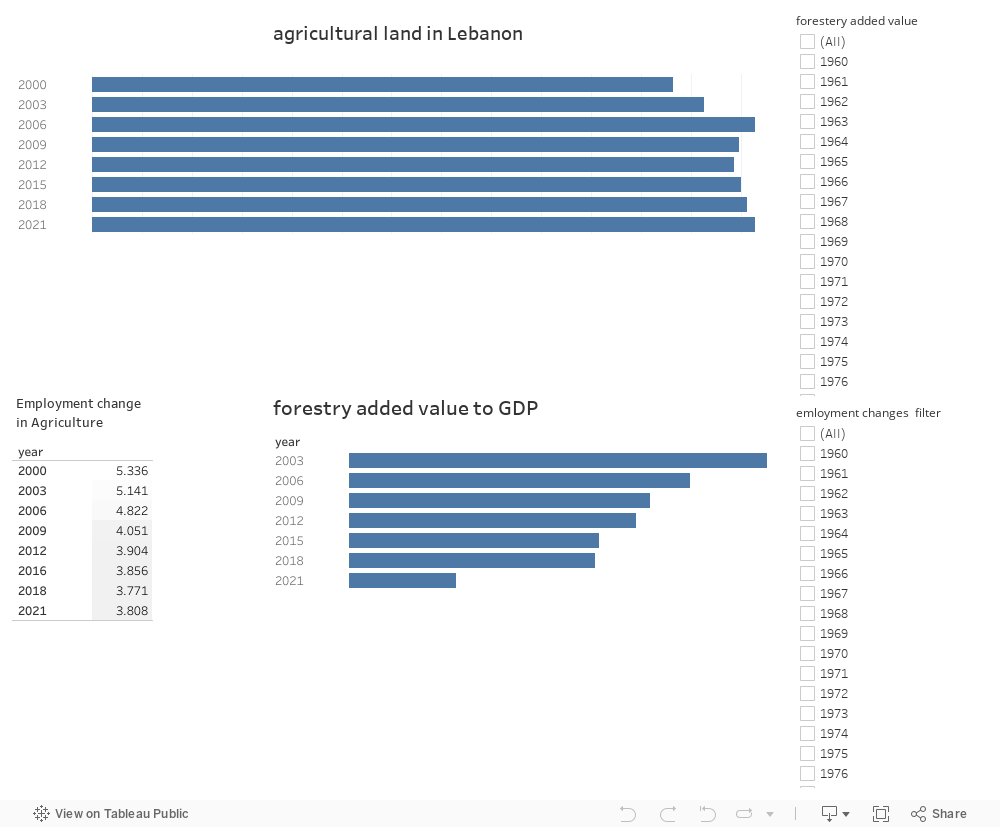
- Despite the presence of fertile land for agriculture and planting, there is a notable absence of qualified and active employees in this sector, as evidenced by the consistent decline in the percentage of the workforce engaged in agriculture over the years. (the percentage decreases from 5.3%in 2000 to 3.8% in 2021 low percentage of the total employment)
- the contributions of forestry and aquaculture to the GDP have been on a continuous decline. (The percentage decreased from 6.3% in 2000 to 1.4% in 2021, indicating a relatively low contribution)
- Lebanon’s GDP growth has been consistently decreasing over the years, reaching a troubling -7% in 2021.
Potential solutions
- Placing greater emphasis on the agriculture and aquaculture sectors by providing support to local farmers and expanding cultivation areas to meet domestic demands while also generating surplus for export.
- Additionally, increasing the number of professionals in this field can be achieved by encouraging universities to prioritize agriculture-related majors and motivating students to pursue studies in this area.
This will result in:
- Increased revenue generation and improvements in Lebanon’s GDP after expanding cultivation areas and supporting the agriculture and aquaculture sectors.
Real life success story:
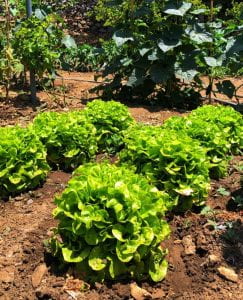
In the summer of 2023, two Lebanese citizens seized the opportunity to cultivate a green, organic farm in the fertile lands of southern Lebanon. Taking advantage of the region’s fertile soil, expansive agricultural land, and favorable weather conditions, they cultivated a variety of fruits and vegetables.
With an initial investment of $1,500, they managed to yield a net profit of $5,000 in just four months. This success story highlights the untapped potential of agriculture and organic farming in Lebanon.
The successful cultivation they were able to get!!!


This solution is validated by the real case example presented at the beginning:
Based on the real-life example, if Lebanon gave more importance to the agriculture sector, this would lead to an increase in domestic production. This, in turn, could serve as a partial solution to the economic and financial crisis the country is facing. Moreover, it would also create more employment opportunities for Lebanese citizens, thereby contributing to a more sustainable and diversified economy. Emphasizing the agriculture sector can play a vital role in bolstering the nation’s economic stability and reducing its reliance on other sectors.
finally, emphasizing agriculture in Lebanon as a means of economic revitalization directly supports SDG 8’s objectives by creating decent work, fostering sustainable economic growth, promoting economic diversification, and facilitating skills development in the agricultural sector.

by Sara Dabbous | May 7, 2020 | Dashboard, Visualization
Since I started working in the healthcare sector I’ve always been interested in knowing more about this industry. As such, while exploring the WDI Data I studied several healthcare indicators and it turns out – Lebanon is doing better than we thought! I was intrigued to know what’s beyond those indicators, and luckily I found a detailed dataset about Primary Health Care Centers in Lebanon on The Humanitarian Data Exchange, I was surprised to know we had this many centers.
Could this visualization be a sign of a sound healthcare system ?
Did this awareness in healthcare aid us in containing the Covid-19?
Do you think there is a better future for the healthcare system for Lebanon, or will it be worst?
Personally, I am optimistic..
So here are some things I didn’t know:
- There are 174 Operational Primary Healthcare Centers in Lebanon
- There are 25 PHC funded by UNHCR
- There are 100 PHC that provide subsidized services.
- Nabatieh has 0 operational PHCs.
- The North governorate has the highest number of operational PHC: 36

In this dashboard, I prepared – using Tableau – a map that shows the different Operational PHC locations in Lebanon filtered by UNHCR Funding. Alongside it, is a bar chart showing the percentage of operational PHC in each Governorate. Finally, at the bottom, you can find a stacked bar chart representing the number of operational PHC per governorate, highlighting those who offer subsidized services.