Charting Progress: Vietnam’s GDP, Trade, and Industrial Growth (2010-2022)
The years 2010 to 2022 have seen stability and expansion in Vietnam’s economy. The visual shows the economic dynamics of the nation over a ten-year period, highlighting the GDP growth rate annually, which highlights the country’s resilience in the face of regional and international difficulties. Additionally, it draws attention to the consistent contribution of trade to GDP, which reflects Vietnam’s growing influence on the international scene. The graph also shows the manufacturing and industrial sectors’ expanding and considerable influence on the economy, indicating a move toward modernization and industrialization. Vietnam’s strategic economic policies and strong reactivity to shifting economic conditions are demonstrated by this data narrative.
Established policies like the Doi Moi economic reform, which laid the foundation for Vietnam’s market-oriented strategy, supported the country’s economic resilience in the face of global problems in 2020. Furthermore, during a turbulent time, Vietnam’s commerce was supported by the government’s strategic application of free trade agreements, such as the EU-Vietnam Free commerce Agreement (EVFTA) and the Comprehensive and Progressive Agreement for Trans-Pacific Partnership (CPTPP). During the epidemic, this strategy and programs like the National Foreign Direct Investment Strategy for 2021–2030 supported growth and cushioned the economy. Following the COVID-19 epidemic, Vietnam’s National Assembly passed Resolution 43 in 2022, which was a comprehensive package meant to revive the country’s economy. To lessen the burden on businesses, specific measures included a 2% reduction in VAT and CIT deductions. A significant budget, almost US$15 billion, was set aside for modernization, infrastructure development, and healthcare advancements. In addition, the government offered favorable loans to support company recovery together with social security subsidies for job creation and training. These focused monetary and fiscal policies were essential in launching Vietnam’s economy’s post-pandemic recovery. The Vietnam Briefing addresses the effects and extent of these policies in detail.
Seizing the Momentum: Vietnam’s Path Forward
In times of global unpredictability, Vietnam’s resilience and economic expansion bear witness not just to its excellent policymaking but also to the unwavering dedication of its people and leadership. One issue still stands as we consider this dynamic economy’s amazing journey: how can the international community use Vietnam’s achievements as a model to strengthen its own economy? The search of creativity and teamwork together holds the key to the solution. Using Vietnam’s experience as a model, let’s consider how we may use these ideas to face our own issues with the same determination and bravery.
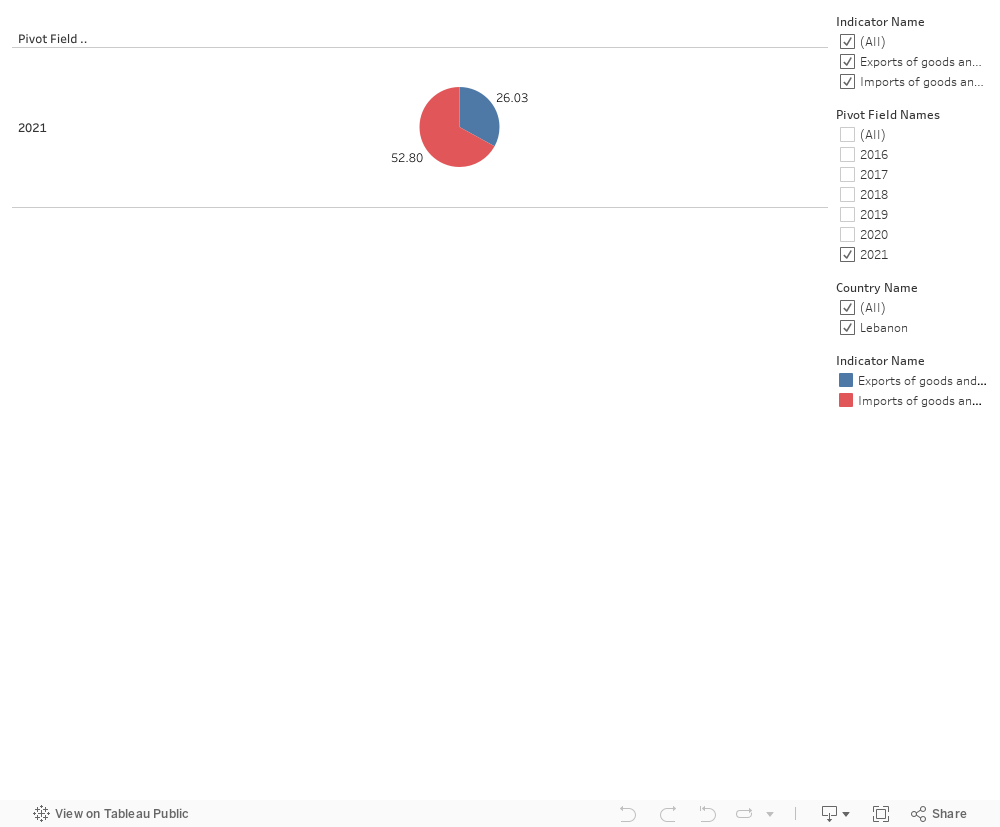
In the dynamic world of economics, trade balances play a pivotal role in determining a country’s financial health. This visualization offers a clear and concise representation of Lebanon’s trade situation over the recent years, focusing on the comparison between the exports and imports of goods and services as a percentage of GDP.
Context:
Lebanon, a country with a rich trading history, has faced various economic challenges exacerbated by political instability and global market fluctuations. Understanding the trade trends is crucial for policy-makers, businesses, and academicians to assess the country’s economic resilience and to strategize for future growth.
These pie charts are a visual summary of the economic challenges faced by Lebanon in terms of trade. They underscore the need for strategic planning and diversified economic reform to build a more balanced and self-sufficient economic structure.
In 2019, the pie chart illustrates that imports considerably outweighed exports, indicating a trade deficit. This imbalance suggests that the country was consuming more than it was producing for external markets.
2020 shows a slight shift with the reduction in imports and a marginal increase in exports. This change could be indicative of various factors, such as a change in economic policy, a response to external economic pressures, or the impact of the global events of that year, like the COVID-19 pandemic.
By 2021, the gap between imports and exports continues to persist, although there’s a noticeable improvement in the trade balance, with exports comprising a larger section of the pie.
Problem:
Lebanon is grappling with a trade deficit.
Solutions:
1- Diversification of Exports: Investing in diverse sectors to increase the range of goods and services for export.
2- Improving Domestic Production: Enhancing the quality and quantity of domestic production to reduce reliance on imports.
3- Trade Agreements: Entering into new trade agreements that favor Lebanese exports or revising existing ones to improve trade terms.
After working on these strategies developing these ideas, and through careful analysis and responsive policymaking, Lebanon can work towards a future where its exports and imports are in a healthier balance.
In the period from 2019 to 2022, Lebanon faced an unprecedented confluence of crises that tested the resilience of its people and the stability of its economy. This tumultuous period unfolded against the backdrop of the global pandemic, the devastating explosion at the Beirut port, and an already fragile political and economic landscape.
In 2019, Lebanon was already grappling with economic challenges, a weakening currency, and public discontent. Little did the nation know that a series of events would unfold, further exacerbating its struggles.
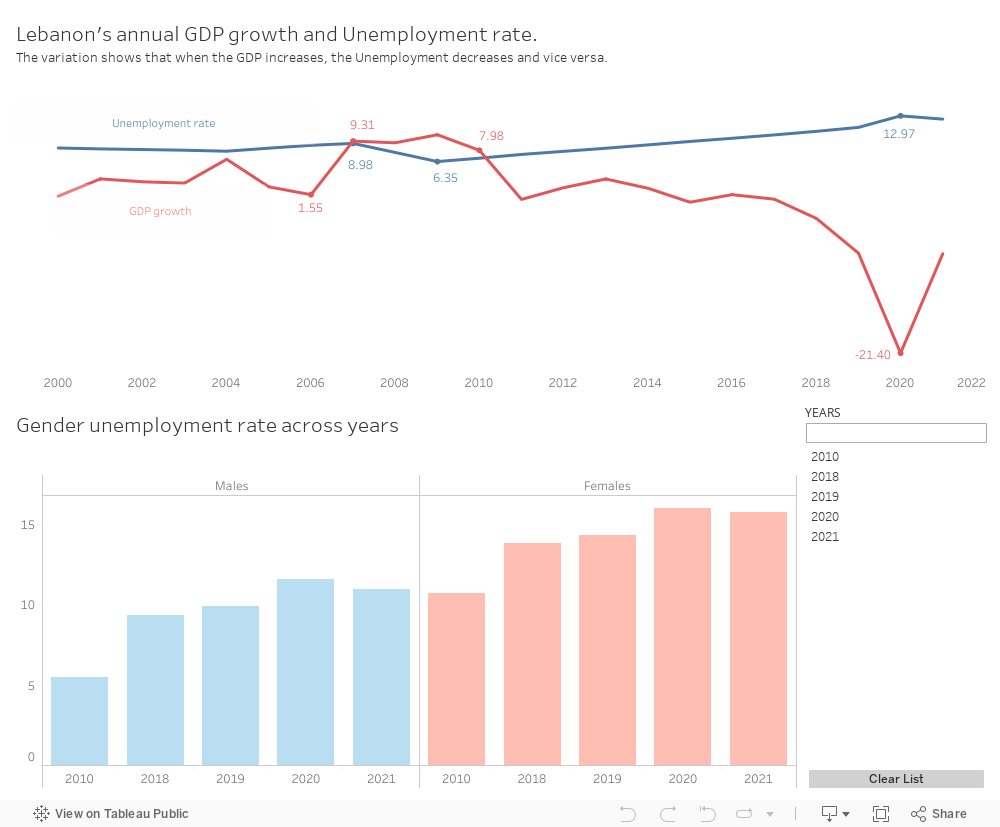
The Economic Downturn:The year 2019 witnessed a decline in Lebanon’s GDP growth, driven by a combination of economic mismanagement, political instability, and a growing public debt. The situation worsened in 2020 as the global COVID-19 pandemic took hold. The pandemic not only strained healthcare systems but also disrupted global supply chains, affecting trade and exacerbating Lebanon’s economic woes.
The Impact of COVID-19:As COVID-19 spread globally, Lebanon, like many nations, implemented strict lockdowns to curb the virus’s spread. However, these measures had a significant economic toll, particularly on sectors such as tourism, hospitality, and services. Unemployment rates surged as businesses struggled to stay afloat in the face of lockdowns and reduced consumer spending.
The Beirut Port Explosion:August 4, 2020, marked a tragic turning point for Lebanon. The explosion at the Beirut port sent shockwaves through the country, causing widespread devastation and loss of life. Beyond the immediate human toll, the explosion dealt a severe blow to the economy. The port, a vital economic hub, was decimated, disrupting trade and further straining an already fragile economy.
The Unemployment Crisis:As the GDP contracted, the unemployment rates, meticulously depicted in our Tableau visualizations, soared. The economic downturn, compounded by the pandemic and the port explosion, left countless Lebanese citizens without jobs. The barchart vividly illustrates the gender-specific impact, showcasing the challenges faced by both males and females in this turbulent period.
Solutions
Yet, in adversity lies the opportunity for resilience and recovery. As we examine the line chart depicting GDP growth, a glimmer of hope emerges. The chart illustrates a gradual increase in GDP in 2021, signaling a potential comeback.
To foster this recovery and bolster Lebanon’s economy, a multi-faceted approach is essential. Some potential solutions include:
Economic Reforms: Implement comprehensive economic reforms to address fiscal challenges, improve governance, and attract foreign investment.
Infrastructure Investment: Focus on rebuilding and modernizing infrastructure, including the reconstruction of the Beirut port, to stimulate economic activity and enhance trade capabilities.
Support for Small Businesses: Provide targeted support for small and medium-sized enterprises (SMEs) to encourage entrepreneurship, create jobs, and revitalize local economies.
International Aid and Collaboration: Seek international aid and collaborate with the global community to access financial assistance, technical expertise, and humanitarian support.
Healthcare Investment: Invest in the healthcare sector to strengthen the country’s resilience to health crises, fostering a healthier workforce and more robust economic conditions.
As Lebanon charts its course towards recovery, these solutions offer a roadmap for rebuilding and fostering sustainable development. The line chart becomes a symbol of resilience, capturing not only the challenges faced but also the potential for renewal and progress.
Resilience and Hope:Despite these challenges, the people of Lebanon exhibited remarkable resilience. Communities came together to support one another, and NGOs and international aid played a crucial role in providing relief. The visual representation of GDP decline and rising unemployment underscores the urgency of addressing the socioeconomic impacts of crises.
Lebanon’s journey through these challenging years serves as a testament to the strength of its people. While the road to recovery is long and arduous, the collective spirit and determination of the Lebanese offer a glimmer of hope for a brighter future.
Public health is linked to the economic strength of a country as health expenditure is positively associated with the productivity and GDP of a nation. The advances and improvement of many of the main forces driving economic growth over time span such as technological progress, education, and physical capital accumulation contribute to the improvement of health services in countries. However, with the world divided between first, second and third world countries, public health situation differs between economically strong and weak countries.
COVID-19, as a recent event, shed light on the differences in health systems within the Arab world, especially that the region includes some of the richest oil producing countries as well as poor and war-torn countries.
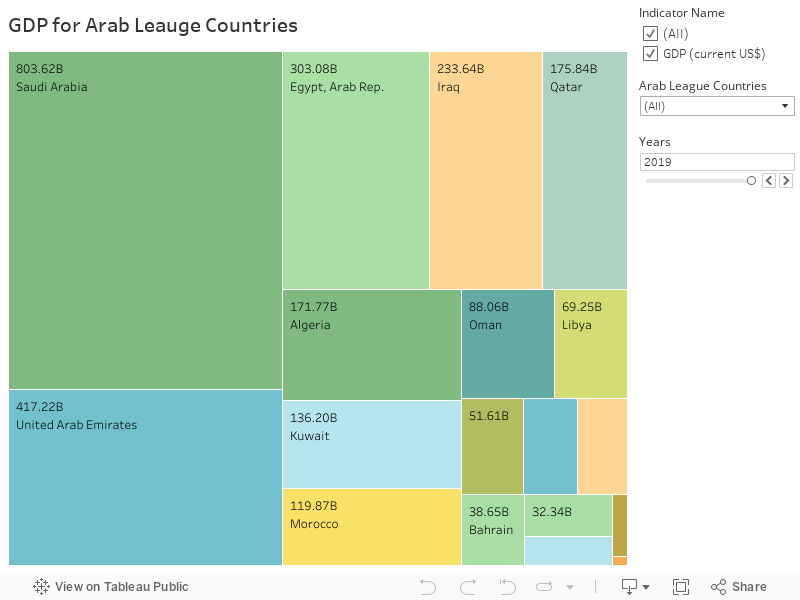
The below graph visually views the differences between the GDP of the Arab League Countries in the Year 2019. For example, at the top of the GDP scale , we have Qatar, a relatively geographically small GCC country and biggest producer of natural gas, has a GDP of $175 billion which is more than GDP of Libya, Lebanon, Sudan and Yemen combined.
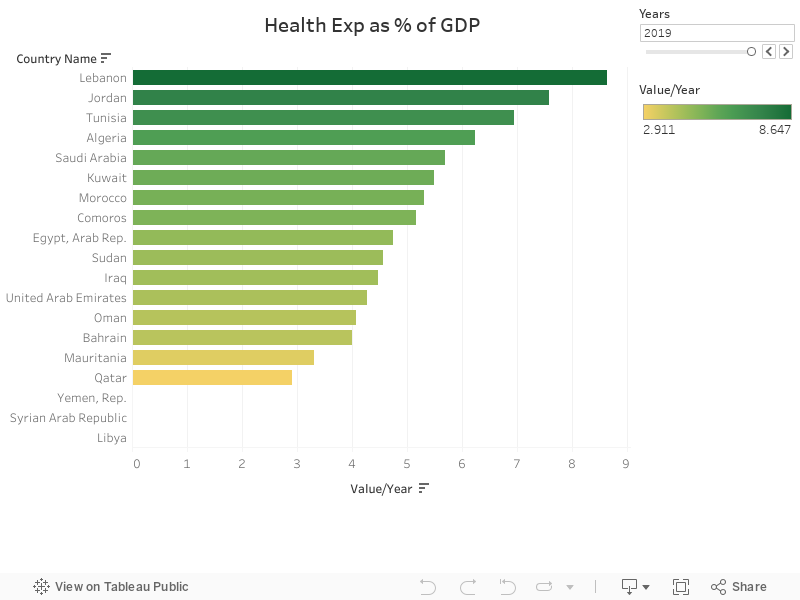
The size of a country’s GDP determines the monetary value of its health expenditure as a percentage of GDP. Comparing the GDP tree map with Health Expenditure graph below , we can see that countries with high GDP (e.g, Qatar, UAE) shows small percentage of health expenditure while Countries with low GDP (e.g, Lebanon, Jordan) shows larger percentage of health expenditure.
In monetary terms, Lebanon has a highest total health expenditure % in the Arab World which amounts to 8.64%($51.6 B)= $4.45 billion. On the other hand, Qatar has a low health expenditure % of 2.9 but when multiplied by the country’s GDP, it amounts to 2.9%($175 B)= $5 billion.
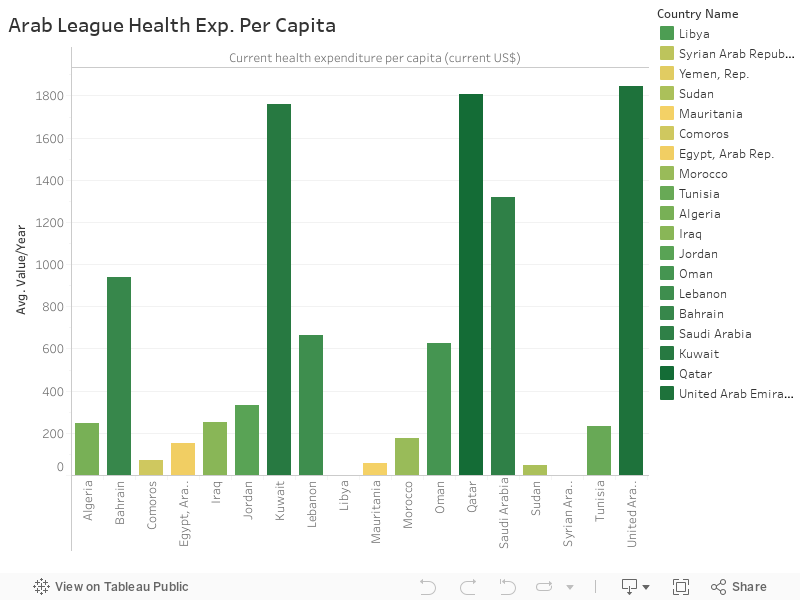
Health Expenditure per capita shows the direct impact of GDP of a country on its health spending. As shown in the below graph, countries with high GDP have high health expenditure compared countries with low GDPs.
The above discussion pointed out the relationship between the strength of a country’s economy and its health spending. The question that remains is “How does this reflect on the health of people?”
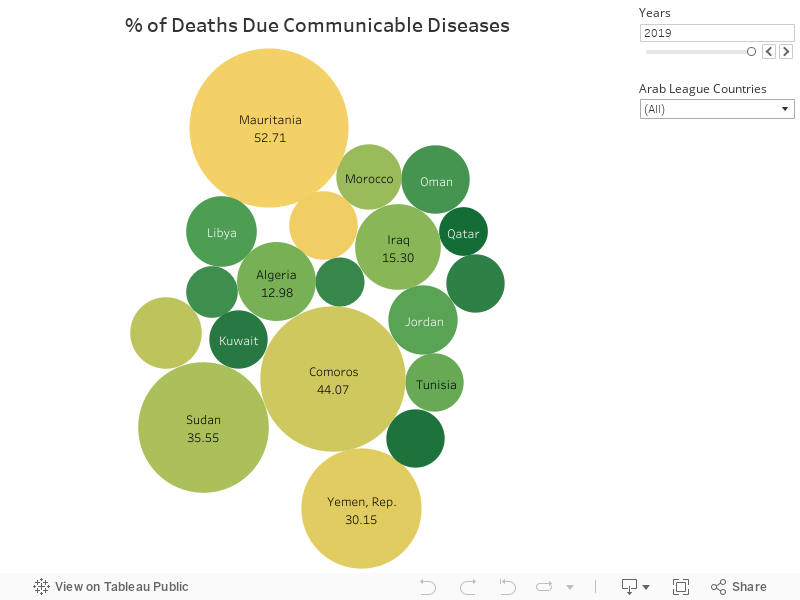
Diseases
Countries that allocate large budgets for the development of the health sector and public health perform well in the face of diseases, especially communicable diseases and pandemics such as COVID-19. The below bubble chart shows that countries with low GDP have the highest percentage of deaths by communicable diseases.
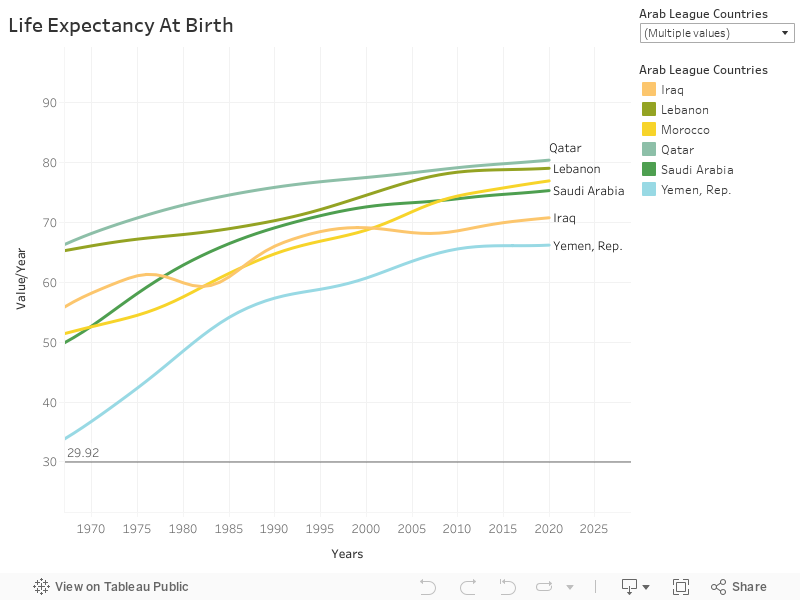
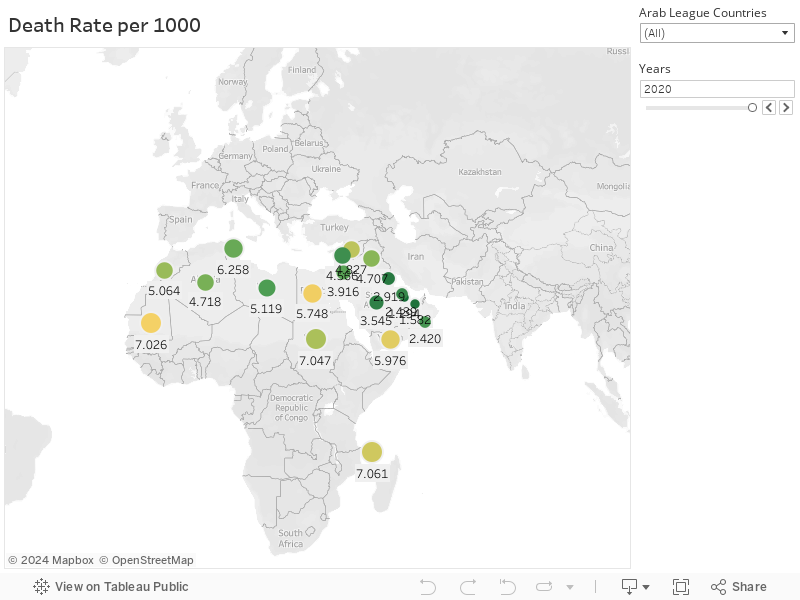
Life Expectancy and Death Rate
To further show the evidence of the impact of GDP and public health spending, we consider both indicators: Life Expectancy at Birth and Death Rate in the Arab League Countries.
Life Expectancy at Birth: we can that people from countries with high GDPs and high health expenditure per capita. Qatar leads the way with 80 years expected age in 2020 while Yemen has an expected age of 66 years in the same year.
Death Rate: the same pattern seen with Life Expectancy is also seen in death rates per 1000 persons. Qatar has a death rate of 1.2 compared to Yemen which has a death rate of 5.9, both in 2020.
What should be done?
The United Nations Sustainable Development Goal #3 “Ensure healthy lives and promote well-being for all at all ages” points out the need for improving the public health of the world population. Health spending by governments is a very important factor in the health of their people. However, for those countries who are economically disadvantaged, improving health can be also achieved through:
Investing in education, especially in medicine studies to make sure the health sector has the competent doctors and specialists.
Directing international aid more towards developing health sectors in poor countries rather than urgent assistance.
Investing in awareness: one of the most important ways to improve health in developing countries is by educating citizens to take preventive healthcare measures and avoid riskier health behaviors.
Trading is one of the most important industries in the UAE, as this is one of the richest countries. The UAE also imports many products, among which foodstuff, machinery, and equipment occupy the first positions among the most imported products in the Emirates. The availability of food is not an issue for residents of the UAE; supermarkets carry all the food they could possibly need or want. But how can a nation with the parched territory and hot weather all year round have access to a wide variety of food? Simple: The UAE is greatly reliant on imports.
-Did you know?
UAE faces a trade deficit when it comes to its food market due to limited arable land, increasing climate issues, and acute water shortage.
-What are the challenges?
With the recent COVID-19 outbreak revealing the precarious nature of imports, the UAE is now putting a strategy in place by investing in technologies to find a solution to food security.
-How can this situation improve?
They need to reduce the imports through a new food strategy which is investing in ag-tech!!
This situation can be improved through “Magic – Breathable Sand” which is one of the solutions that was developed by the Dake Group in partnership with the Rechsand Technology Group from Beijing. This type of sand is covered with a specific technology that allows air to travel through its particles and captures the water that it contains. They believe that it could be applied to desert sand to retain water and fertilizer usage by 70% and 50% respectively.
It was then tested and it worked: they were able to grow around 28 fruit trees including mango and lemon groves.
Various institutions in the United Arab Emirates provide a range of funding options to modernize agriculture.
Dubai’s Food Tech Valley: It’s a new initiative that seeks to increase food production in the UAE and establish it as a major international destination for the sector. Based out of Dubai, ICBA works by assisting farmers and agricultural organizations in developing policies and methods that will maximize the management of local natural resources. They provide advice on the optimum crop varieties to harvest as well as soil and water quality.
Water Scarcity: To make seawater drinkable and useful for agriculture, the United Arab Emirates mainly relies on an expensive procedure called desalination.
“Water is scarce. And as we already know, 90% of the water available in the UAE is desalinated water which is very costly and consumes energy,” explains Idland.
If half of the water was saved and used for agriculture, 30 tons of tomatoes could be produced every day. Additionally, there would be less need for the expensive and energy-intensive process of desalinating seawater.
Vertical Farming and New Technologies: The past few years have seen a lot of attention paid to Vertical Farming. The government and the corporate sector have invested millions in the technique despite the significant expense associated with it. In order to develop vertical farming facilities in the Emirate, the Abu Dhabi Investment Office (ADIO) announced in April that it would invest $100 million in four businesses, one of which being AeroFarms.
-Visualization and Analysis.
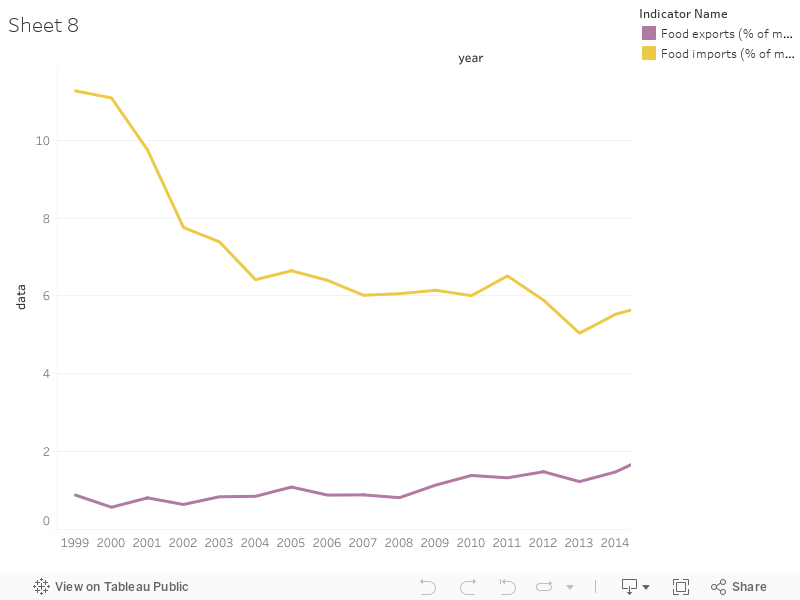
By looking at the data from World Development Indicators, we get the results in Tableau as below: “Imports Vs. Exports”
The data line chart in the World Development Indicators shows the percentages of food exports and imports in the United Arab Emirates from 1999 to 2021 that led to a “Trade Deficit”.
-Things to note.
Why is it magical for Desert Farming and Food Security?
Breathable roots are produced by breathing sand, and they can change the forest or other green cover.
Given that desert soil is free of any chemical or fertilizer contamination, it encourages quicker adoption of organic farming techniques.
A small layer of sand can save billions of gallons of water annually by reducing water use for agriculture, farming, forestry, or gardens by 80%.
Additionally, the breathable sand can transform desert farming to increase production quantity and quality.
-Quote.
“Increasing self-production within the local region and reducing the reliance on imports is what we are focusing on,” says Chandra Dake.
“We [in the UAE]are only looking at a few hundred thousand hectares to be food secure, and it is not too far,” he says.