The global water crisis is a pressing issue characterized by increasing water scarcity and deteriorating water quality, impacting billions worldwide. Factors such as population growth, climate change, pollution, and inefficient water management contribute to this crisis. Many regions face challenges in accessing clean and safe water, leading to health hazards, agricultural setbacks, and socio-economic repercussions. Urgent action is required to address this crisis through sustainable water use, conservation, and improved infrastructure to ensure equitable access to this vital resource for present and future generations.
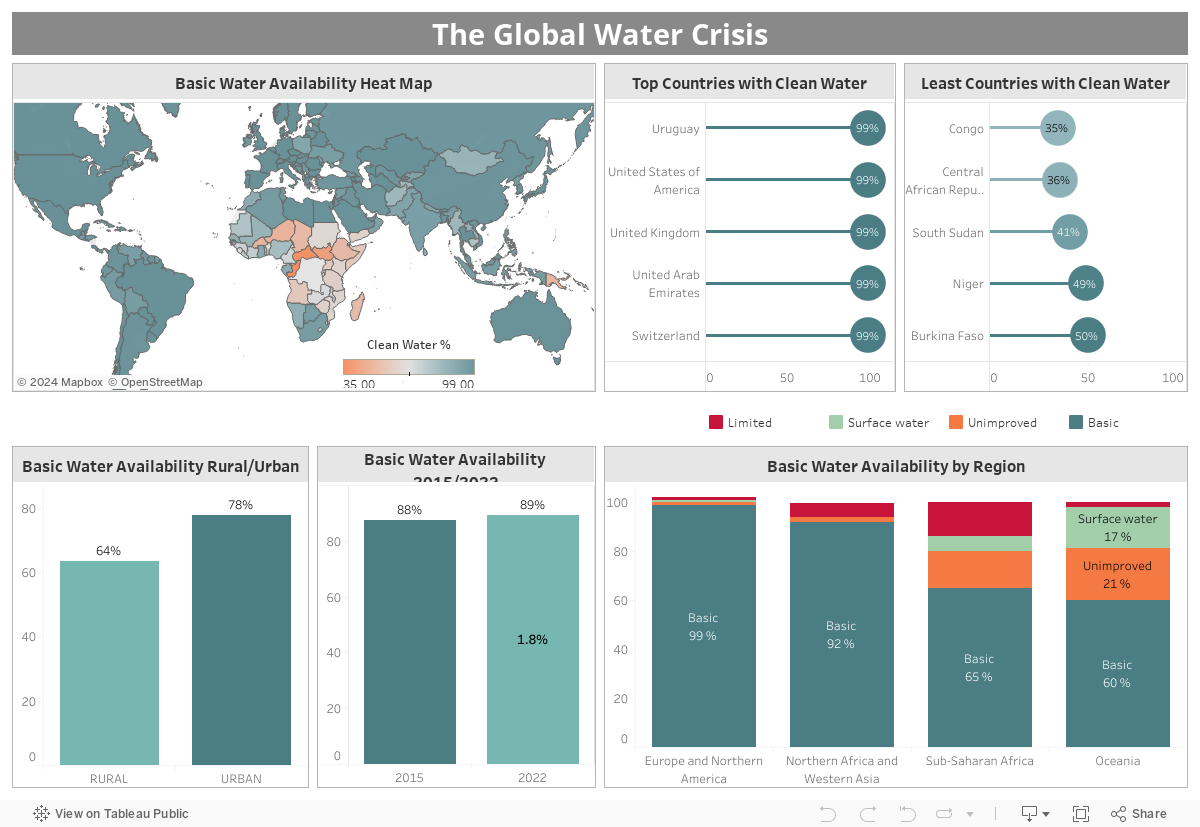
Top 5 Countries with Clean Water:
Uruguay
United States of America
United Kingdom
United Arab Emirates
Switzerland
These countries are known for their efficient water management, strict environmental regulations, and abundant natural water sources.
Least 5 Countries with Clean Water:
Congo
Central African Republic
South Sudan
Niger
Burkina Faso
These countries often struggle with water scarcity, poor infrastructure, and limited access to clean drinking water, leading to severe health and socio-economic issues.
Clean Water Availability Rural/Urban:
Clean water availability can vary significantly between rural and urban areas. Generally, urban areas tend to have better access to clean water due to better infrastructure and public services. In contrast, rural areas face challenges in obtaining clean water due to limited resources and a lack of proper water treatment facilities.
Clean Water Availability 2015/2022:
Clean water availability has likely improved in some regions between 2015 and 2022, mainly due to increased efforts from governments, NGOs, and international organizations. However, the overall result shows a Decline of 1.8% in clean water availability.
Water Availability by Region:
Water availability can be classified into four main categories:
Clean Water: Regions where clean and safe water is readily available for consumption and daily use.
Limited Water: Regions facing water scarcity, where access to clean water is limited, and communities may struggle to meet their water needs.
Unimproved Water: Regions where water sources may be available, but the water quality is poor and contaminated, posing health risks to the population.
Surface Water: Refers to water sources like rivers, lakes, and reservoirs that are openly exposed to the environment.
The distribution of these categories varies widely across different regions and countries, with some areas experiencing critical water shortages and poor water quality specially in African Region.
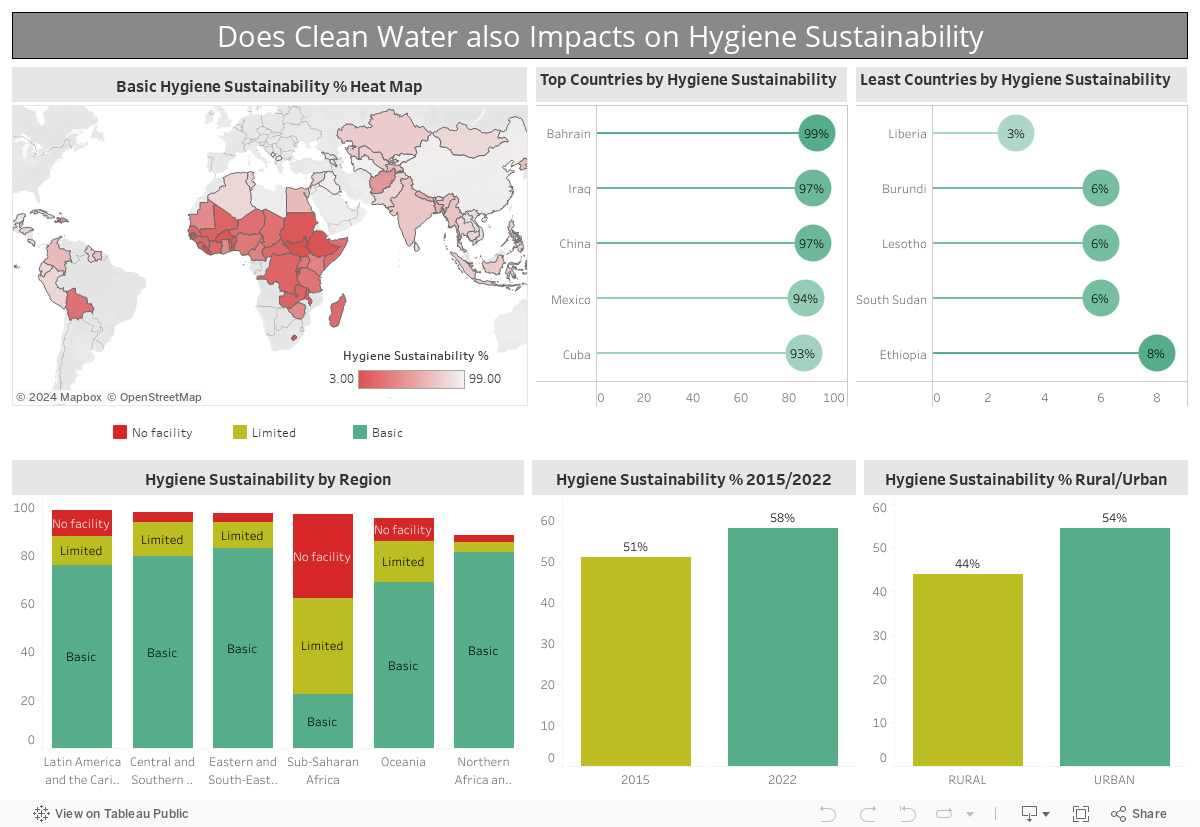
Clean water plays a significant role in hygiene sustainability as access to safe and clean water is essential for maintaining good hygiene practices. Without clean water, it becomes challenging to ensure proper sanitation, handwashing, and overall hygiene, which can lead to the spread of waterborne diseases and other health issues
Impact of Clean Water on Hygiene Sustainability:
Handwashing: Clean water is essential for practicing proper handwashing, which is one of the most effective ways to prevent the spread of infections and diseases.
Sanitation: Access to clean water is critical for maintaining sanitation facilities like toilets and latrines. Adequate sanitation is essential to prevent the contamination of water sources and the spread of diseases.
Food Preparation: Clean water is required for washing and preparing food to ensure it is safe for consumption.
Personal Hygiene: Clean water is necessary for bathing and maintaining personal hygiene, promoting overall health and well-being.
Top Countries by Hygiene Sustainability: Countries with well-developed infrastructure and access to clean water and sanitation facilities generally tend to have better hygiene sustainability. The top countries by hygiene sustainability may vary depending on the specific criteria and data sources used for evaluation.
Least Countries by Hygiene Sustainability: Countries facing challenges in providing access to clean water and sanitation facilities often have lower hygiene sustainability. These countries may struggle with poor sanitation practices, leading to higher rates of waterborne diseases and health issues.
Hygiene Sustainability % Rural/Urban: The availability of clean water and sanitation facilities can differ significantly between rural and urban areas. Urban areas generally have better access to improved sanitation facilities and clean water sources compared to rural regions. Consequently, hygiene sustainability is often higher in urban areas.
Hygiene Sustainability by Region: The level of hygiene sustainability can vary widely across different regions, depending on factors such as infrastructure development, access to resources, and government initiatives. Regions facing challenges like water scarcity, lack of proper sanitation facilities, and limited access to clean water may experience lower hygiene sustainability.
Basic, Limited & No Facility: Hygiene sustainability can be classified into categories based on the availability and quality of sanitation facilities:
Basic Facility: Access to improved sanitation facilities, such as flush toilets or ventilated pit latrines, that are hygienically separated from human contact.
Limited Facility: Access to unimproved sanitation facilities, which do not meet basic hygienic standards, such as pit latrines without proper ventilation or sanitation facilities shared by multiple households.
No Facility: Lack of access to any sanitation facility, resulting in open defecation or the absence of proper waste disposal systems.
Promoting hygiene sustainability and ensuring access to clean water and sanitation facilities are crucial steps in improving public health, reducing waterborne diseases, and achieving sustainable development goals worldwide. Efforts from governments, international organizations, and local communities are essential to address these challenges effectively.
References:
UN-Water. (2022). The United Nations World Water Development Report 2021 – Valuing Water. Retrieved from: https://www.unwater.org/publications/un-world-water-development-report
World Health Organization (WHO) and United Nations Children’s Fund (UNICEF). (2021). Progress on household drinking water, sanitation and hygiene 2000-2020: five years into the SDGs. WHO/UNICEF Joint Monitoring Programme for Water Supply, Sanitation and Hygiene. Retrieved from: https://www.unwater.org/publications/un-world-water-development-report
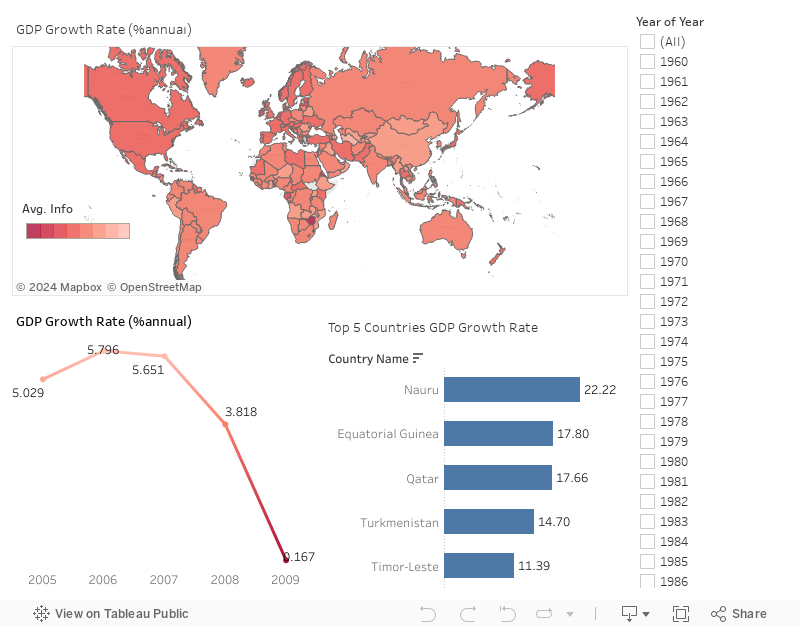
The 2008 financial crisis, also known as the “Global Financial Crisis” or the “Great Recession,” was one of the most severe economic downturns since the 1930s Great Depression. Originating in the United States, it rapidly became a global phenomenon that impacted economies worldwide. A confluence of factors, including the bursting of the housing bubble, a surge of subprime mortgage defaults, and a crisis in the global financial system, precipitated the crisis.
Nauru has the highest average GDP per capita among the countries enumerated (22.22), followed by Equatorial Guinea (17.80), Qatar (17.66), Turkmenistan (14.7), and Timor-Leste (11.39). These nations are distinguished by their diverse economic structures and vast natural resource wealth.
The data illustrates the effects of the 2008 financial crisis on inflation and per capita GDP over time. In addition, it emphasizes the varied economic circumstances of the countries mentioned, with differing levels of average GDP per capita.
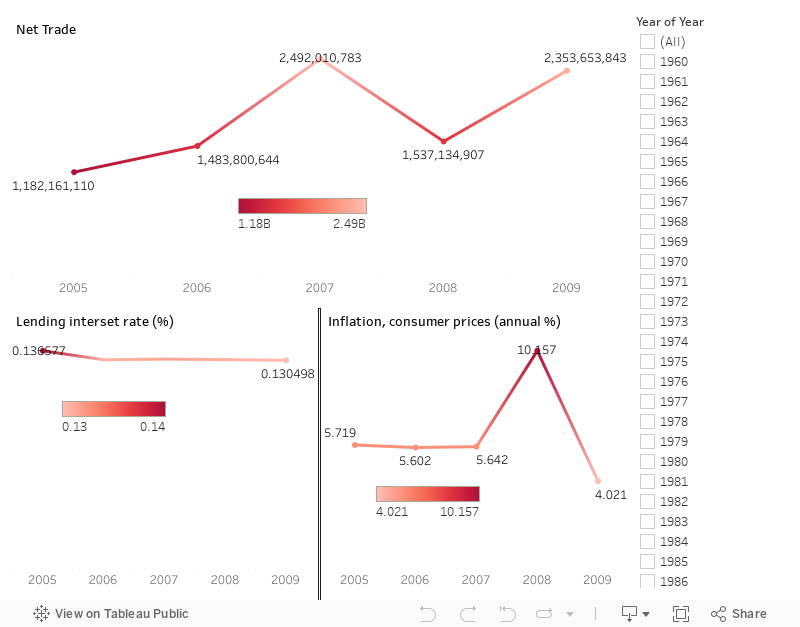
Indicators Visualization
In 2009, the value of net commerce increased to $2,35 Billion, indicating an increase in exports relative to imports. This may have been the result of a shift in external demand or the depreciation of domestic currencies, which has made exports more competitive.
Throughout the crisis years, lending interest rates remained relatively stable, lingering around 0.13 percent. In the midst of the financial turmoil, central banks likely maintained accommodating monetary policies in an effort to maintain liquidity and stimulate borrowing and investment. This stability in lending rates could have been instrumental in bolstering economic activity and consumer access to credit.
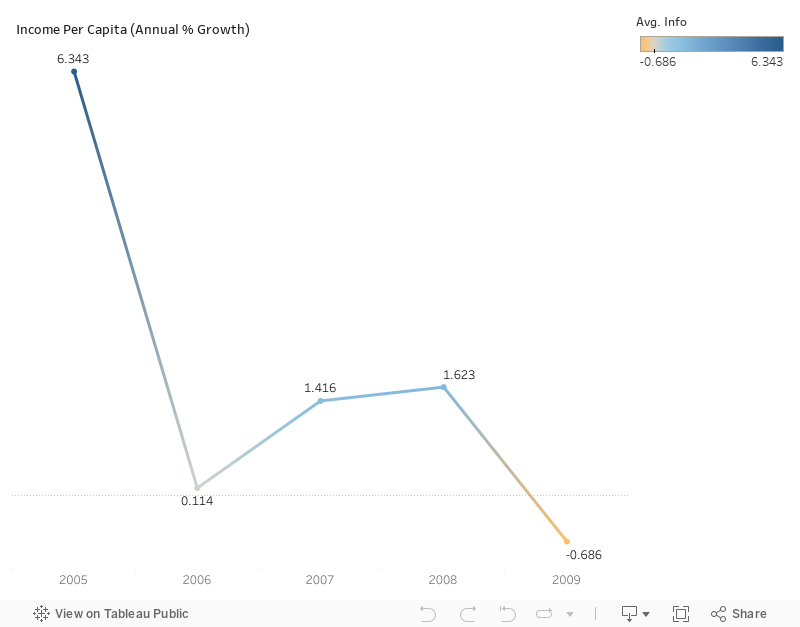
During the crisis, however, inflation rates experienced significant shifts. Inflation soared to 10.16 percent in 2008, reflecting inflationary pressures caused by supply chain disruptions and increased uncertainty arising from the economic crisis. However, inflation rates began to moderate in the years that followed, suggesting that central banks and policymakers may have taken steps to control price pressures and stabilize consumer prices. Moreover, the indicator of income per capita experienced significant fluctuations, reflecting the economic challenges countries confronted during this time. In 2009, the per capita income declined by a significant -0.69%. This decline could be attributed to the crisis’s negative effects, such as employment losses, decreased economic activity, and financial market turmoil.
These indicators illustrate the volatility and complexity of the 2008 financial crisis. The impact of the crisis on net trade, lending interest rates, and inflation highlights the dynamic interplay of economic factors and the difficulties governments and central banks face in managing macroeconomic stability during this difficult period.
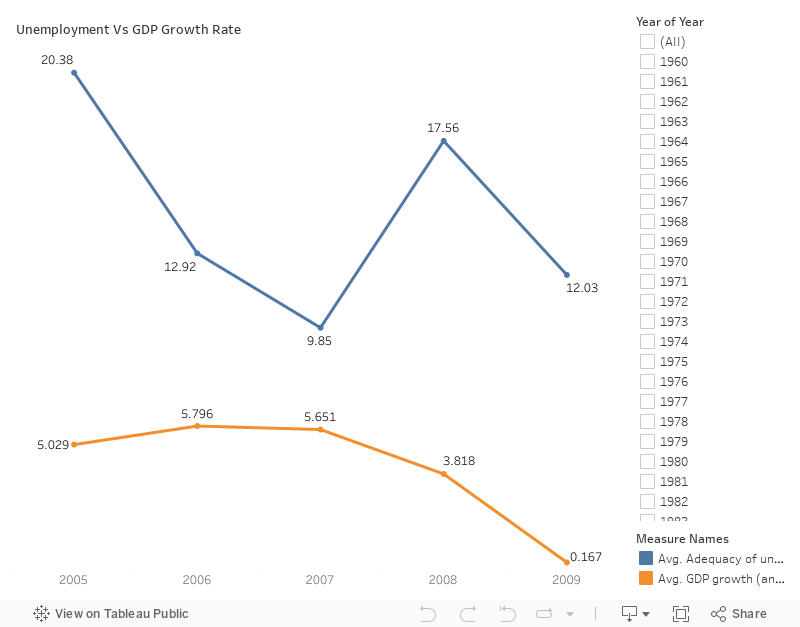
Compared to the average GDP growth rate (3.82%), the adequacy of unemployment benefits and ALMPs (% of total welfare of beneficiary households) was relatively low at 17.56%. This indicates that the assistance provided to unemployed individuals through unemployment benefits and active labor market programs may not have had a significant impact on the overall economic growth during that year.
The Recovery Process
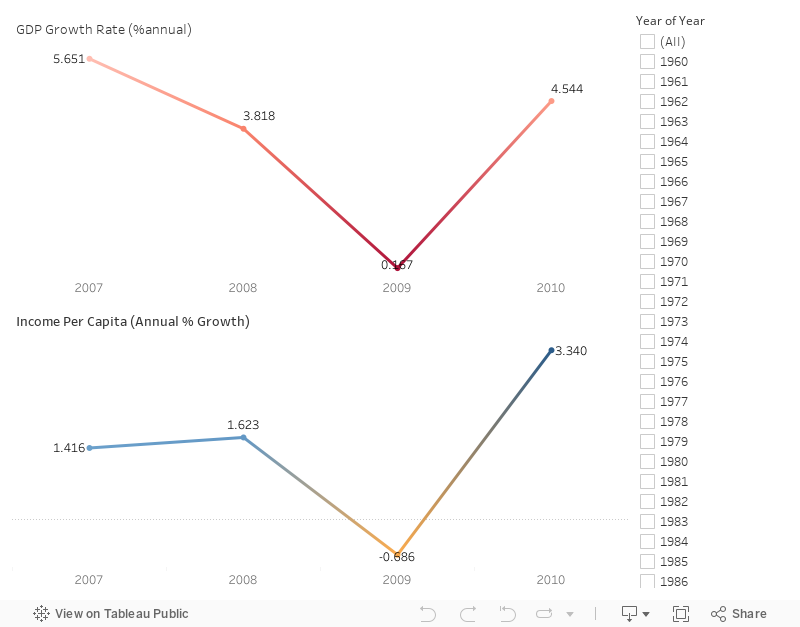
After the 2008 financial crisis, both the GDP growth rate and per capita income showed evidence of economic recovery and improvement in 2010. The GDP growth rate rebounded significantly, reaching 4.54 percent, indicating a robust recovery in economic activity compared to the modest growth rate of 0.17 percent encountered at the height of the recession in 2009. This rebound in GDP growth indicates that the crisis-era policy measures, stimulus packages, and economic reforms had a positive effect on restoring economic stability and stimulating growth.
In 2010, the per capita income also increased at a significant rate, 3.34 percent. This growth indicates an increase in individual incomes and suggests that efforts to promote employment, strengthen social safety nets, and stimulate economic recovery had a positive impact on household incomes. Positive trends in both the GDP growth rate and per capita income in 2010 reflect the resilience of economies and the progress made in overcoming the obstacles posed by the 2008 financial crisis. Despite the fact that the recovery process has been gradual, these indicators point to a positive trajectory of economic development and a path to restoring prosperity in the post-crisis era.
Problem:
Climate change is a pressing global problem with alarming evidence. Rising temperatures, melting ice caps, and extreme weather events are just a few examples of its impacts.” The primary environmental problem associated with CO2 emissions is their contribution to climate change and global warming.
Carbon dioxide is a greenhouse gas that plays a crucial role in maintaining habitable temperatures on Earth through the greenhouse effect. However, excessive levels of CO2 and other greenhouse gases in the atmosphere have disrupted this balance, resulting in a range of environmental issues. These include global warming, climate change, ocean acidification, ecosystem disruptions, and impacts on human health.
Problem Evidence:
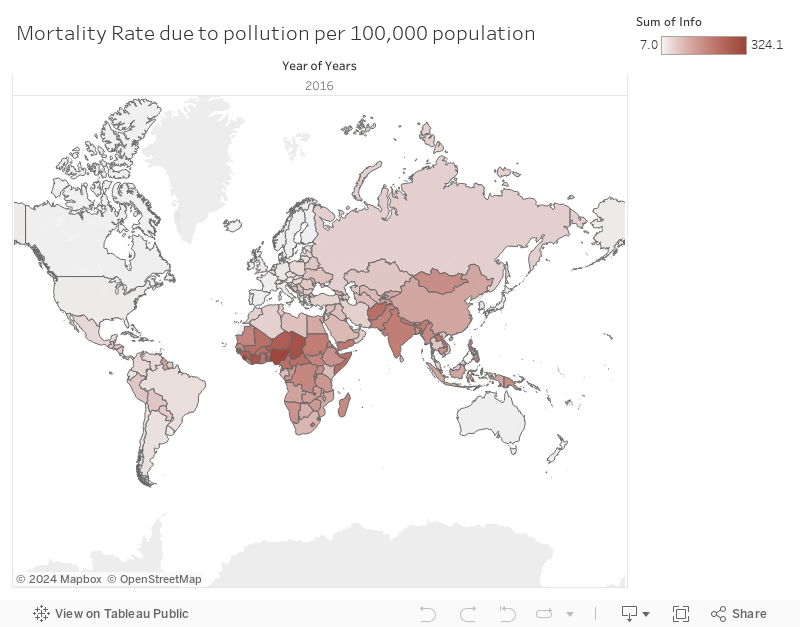
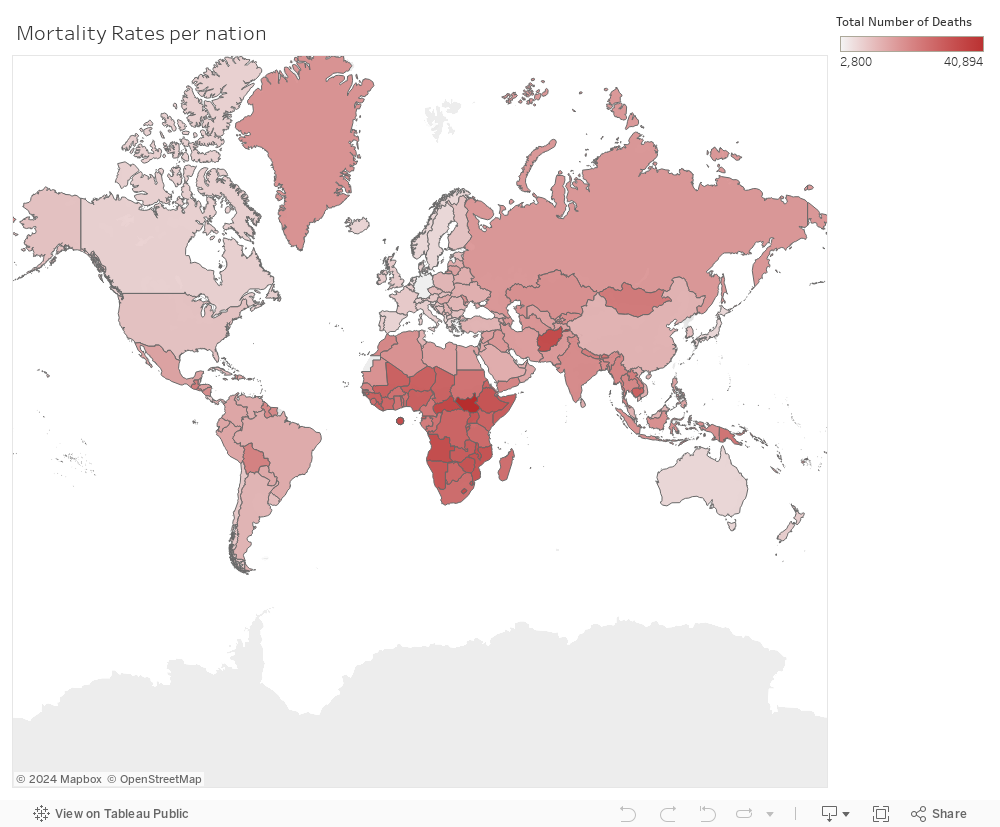
As we can see in this map, climate change has been linked to an increase in mortality rates across the globe. Rising temperatures and heatwaves pose a significant threat, particularly to vulnerable populations such as the elderly, children, and those with pre-existing health conditions.
Urban populations are profoundly affected by the impacts of climate change. As cities continue to grow, they face unique challenges related to rising temperatures, increased air pollution, and vulnerability to extreme weather events. Heat islands, where urban areas experience significantly higher temperatures than surrounding rural areas, can amplify the health risks for urban residents
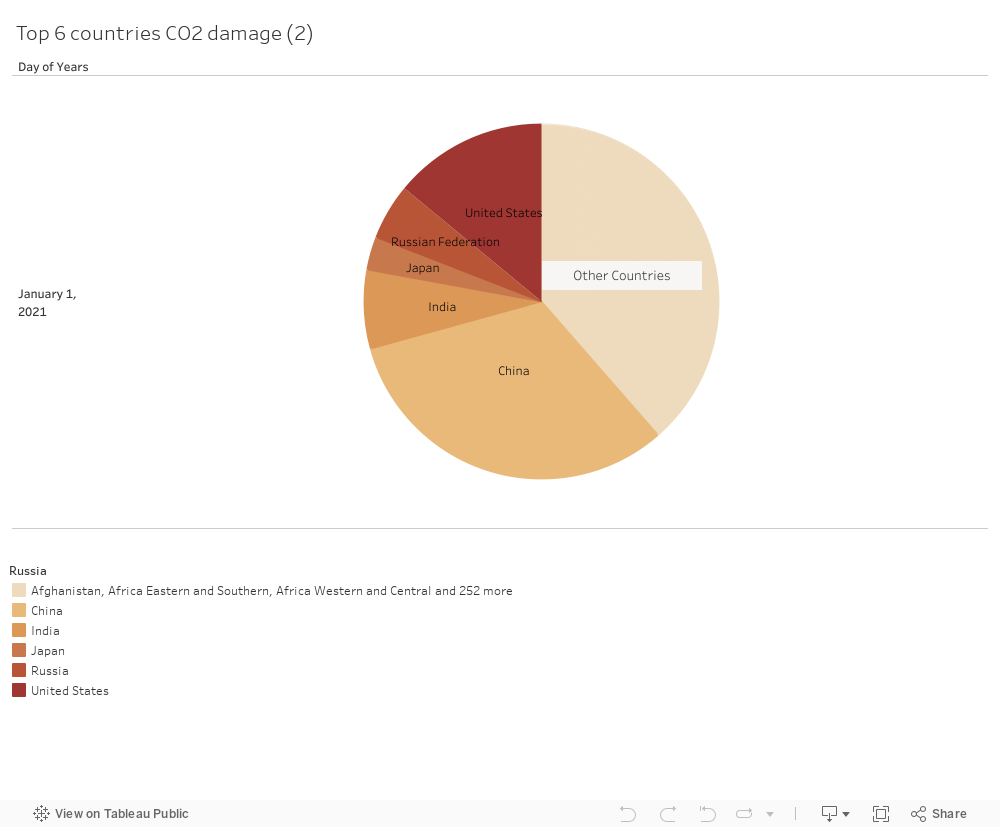
Human activities, such as burning fossil fuels, deforestation, and industrial processes, are releasing massive amounts of greenhouse gases, primarily carbon dioxide (CO2), into the atmosphere. As seen through this pie, China and the United States are among the biggest countries with CO2 emissions for the year 2021.
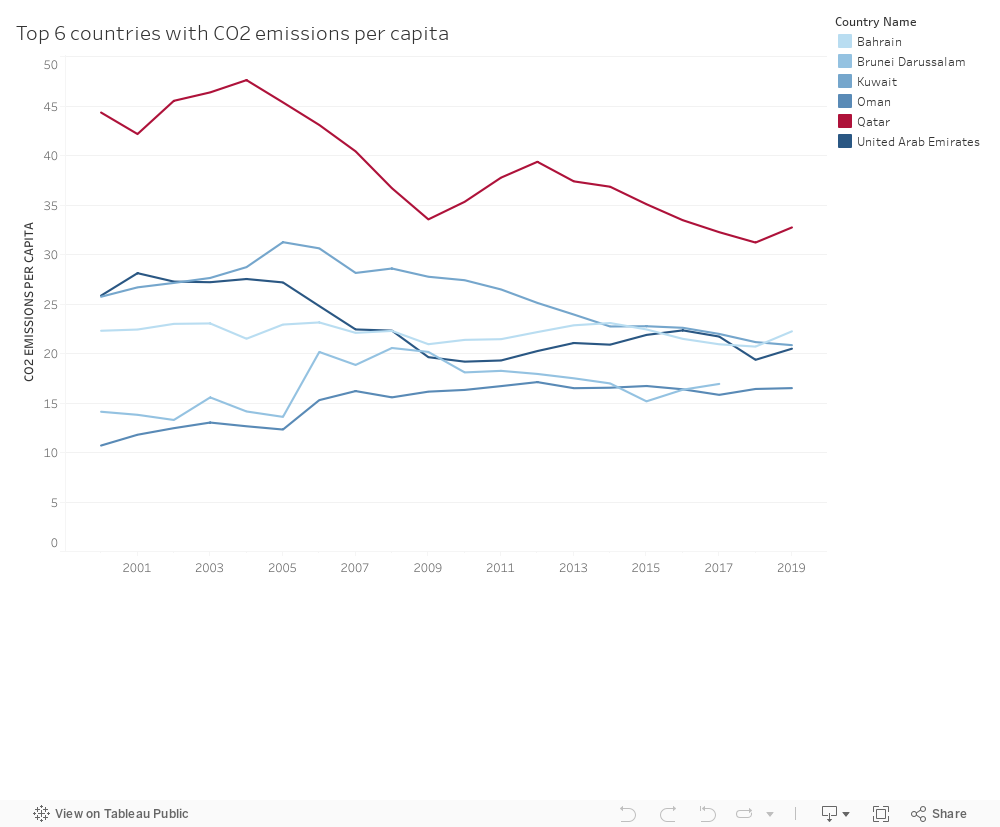
In regard to the highest countries that emits CO2 per capita, we can see through this visualization that Qatar is at the peak due its unique combinations of factors. The extraction, production, and export of natural gas involve energy-intensive processes that result in significant CO2 emissions. Additionally, Qatar’s hot climate with its small population necessitates high energy consumption for cooling and desalination purposes with higher per capita emission figure.
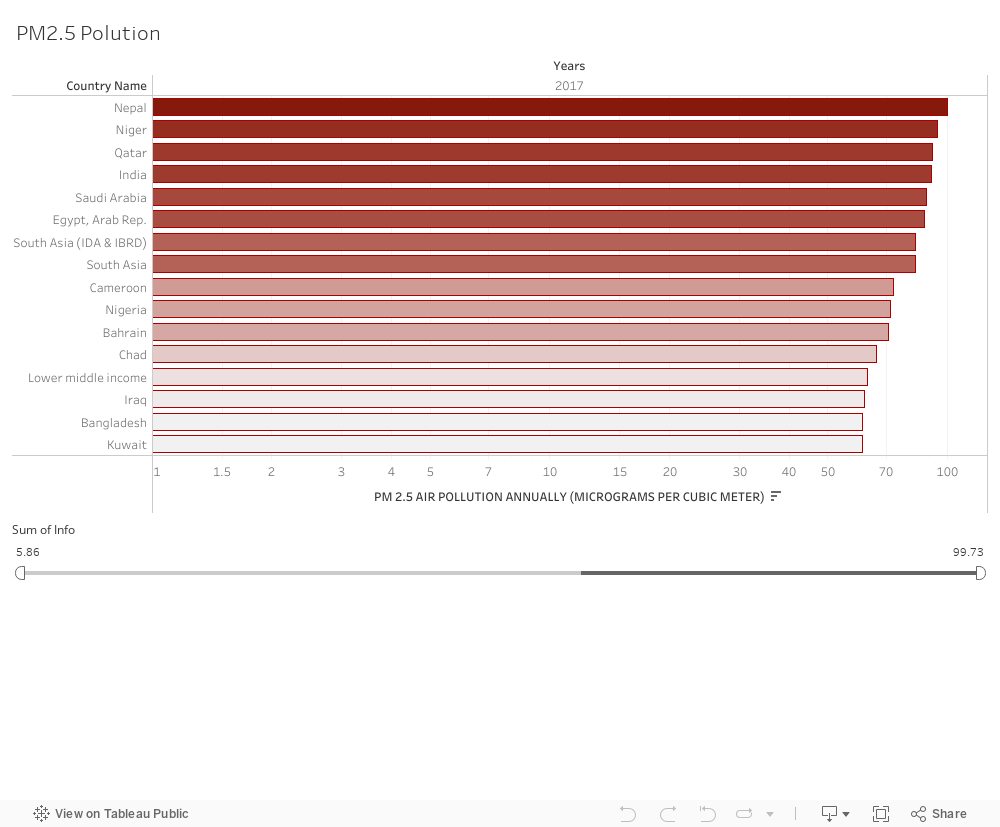
One of the most dangerous threats for the climate change is the PM2.5. Given that it is more harmful to human health in the short-term, it is measured in units of micrograms per cubic meter of air. PM2.5 is harmful in the short-term, leading to adverse consequences in vulnerable groups such as children and older adults. The above bars display mean annual exposure levels to PM2.5 across the world in 2017. Exposure is more severe in South Asia and some parts of Africa, especially the Middle East.
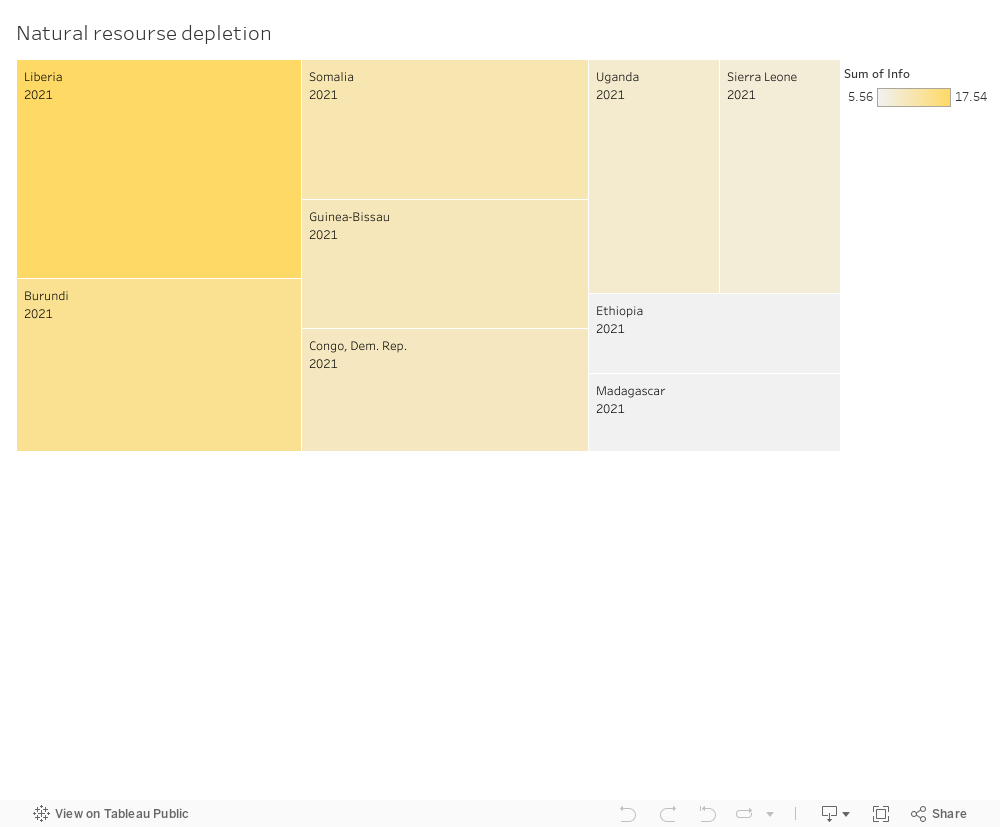
Depletion of natural resources refers to their excessive extraction, usage, and destruction. The depletion of natural resources becomes a major issue when human activities intensify and resource demand rises. At alarming rates, forests are being removed, which causes habitat loss, a decline in biodiversity, and soil erosion. Adopting sustainable behaviors, fostering resource efficiency, putting conservation measures in place, and switching to renewable energy sources are all necessary to address the depletion of natural resources. In order to protect the environment for future generations, it is essential to ensure the equitable and responsible management of resources.
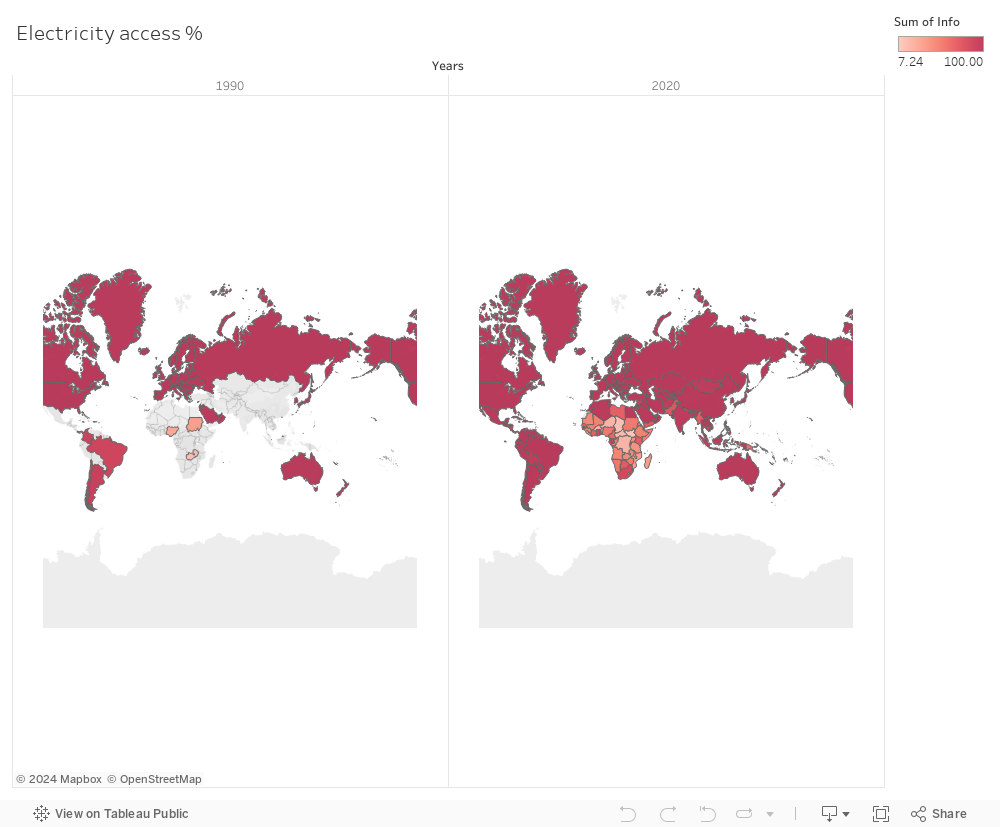
The use of electricity is another problem we have with our mother earth. This image allows us to examine the expansion that took place over a 20-year period. Carbon dioxide (CO2) and methane (CH4) are released throughout the energy generation process, especially when it uses fossil fuels like coal and natural gas. These emissions have an impact on climate change and global warming. Furthermore, the effects of such a crucial component of our everyday lives include waste production, habitat loss, air pollution, water consumption, and habitat loss.
Potential Solution:
On the plus side, increasing the production of power from renewable sources like solar, wind, and hydro can lessen the environmental harm and greenhouse gas emissions caused by fossil fuel-based generating.
Solution Details:
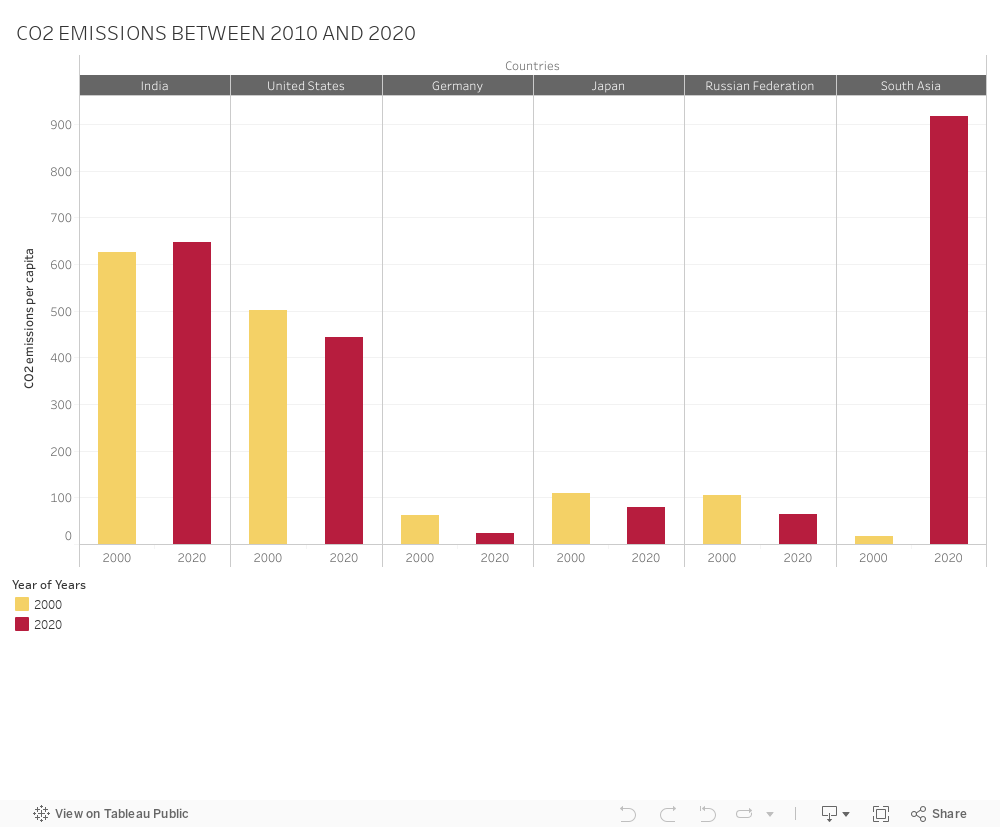
We must cut back on CO2 emissions in order to address the serious climate problem. While many nations have made attempts to minimize them, it is crucial to address the problem thoroughly and keep working toward long-term solutions in order to lessen the effects of climate change and safeguard our ecosystem. Using electric vehicles and switching to clean, renewable energy sources like solar and wind power can greatly cut CO2 emissions. As seen through this chart, some countries started to cut off CO2 emissions whereas others need more time.
Recommendations :
To address climate change effectively, we need international cooperation, continued research and development of renewable energy technologies, and sustainable transportation systems. Every individual can contribute by making environmentally conscious choices in their daily lives. “Together, we can mitigate the impacts of climate change and create a sustainable future for generations to come. Let’s act now and make a difference.”
Health Expenditure in the U.S per person has been continuously rising in recent years, posing serious problems for both patients and the healthcare system as a whole.
US healthcare spending is the highest globally, yet health outcomes are poor. As shown in Figures 2 and 3, about $10k per capita are spent on healthcare annually, double the average of other developed nations. Still, life expectancy falls behind, and medical expenses are a frequent cause of personal bankruptcy.
The following are the main causes of rising healthcare costs:
Increasing healthcare costs
Aging population
Prevalence of chronic diseases
Complexity of the healthcare system
Higher utilization of healthcare services
The Consequences of Increasing Healthcare Costs:
Expenses borne by people
Having little access to good healthcare
Efficiency issues and inconsistent care
Healthcare service disparities
Solution:
HealthVantage, Health Management Platform:
Presenting HealthVantage, a revolutionary health management platform that allows individuals to control their health, decrease expenses, and enhance wellness.
HealthVantage has three core principles:
Provide personalized health assessments that consider medical history, lifestyle choices, and genetics to offer tailored recommendations for illness prevention and healthy living.
Track health by integrating with wearables and apps to monitor vital signs, activity, and sleep. It analyzes data to create personalized insights and plans.
Provide telemedicine services, which allows virtual consultations with healthcare professionals, cutting down on costly in-person visits and providing convenient accessibility while lowering healthcare expenses.
Benefits of HealthVantage:
Individual Benefits:
Better control over individual health information
Lower healthcare expenses
Enhanced overall quality of life and wellness
System-wide Benefits:
Better healthcare efficiency
Reduction in unnecessary healthcare utilization
We understand that you, as investors, seek validation and tangible results. That’s why we are committed to conducting extensive research and case studies in collaboration with healthcare providers, insurance companies, and academic institutions. These studies will showcase the cost savings, improved health outcomes, and heightened patient satisfaction that HealthVantage brings to the table.
For HealthVantage to succeed and have widespread adoption, we have important suggestions:
First, collaboration with stakeholders is vital. We will actively engage with healthcare providers, insurance companies, employers, and policymakers to integrate our platform into existing healthcare systems and maximize its impact.
HealthVantage saves a lot of money. We’ll inform users about the financial benefits and offer affordable subscription plans to attract users and drive adoption.
User education and engagement will be a top priority. We will achieve this through awareness campaigns, user-friendly tutorials, and community-building efforts to ensure the long-term success of HealthVantage users.
In conclusion, HealthVantage has the potential to revolutionize healthcare in the United States. By reducing health expenditure per capita and improving individual well-being, we can create a healthier and more affordable healthcare system. Investing in HealthVantage is investing in a healthier, more prosperous future for both individuals and society. I invite you to join us on this transformative journey, as we strive to make a lasting impact on the lives of millions while generating significant returns on investment.
In the intricate tapestry of a nation’s prosperity, nothing weaves a more profound impact than the state of its healthcare system. The vitality of its citizens, the resilience of its communities, and the promise of a prosperous future all hinge on the health and wellness of the population. A healthy population is a productive one, as it reduces absenteeism, increases workforce efficiency, and stimulates economic growth.
Yet, as we embark on this journey through the labyrinth of healthcare, one question looms above all: How can we chart the course to assess and improve a country’s medical system, ensuring a brighter, healthier tomorrow for all? Evaluating the medical system of a nation is a complex endeavor that requires a comprehensive approach to several factors we will delve deeper into later.
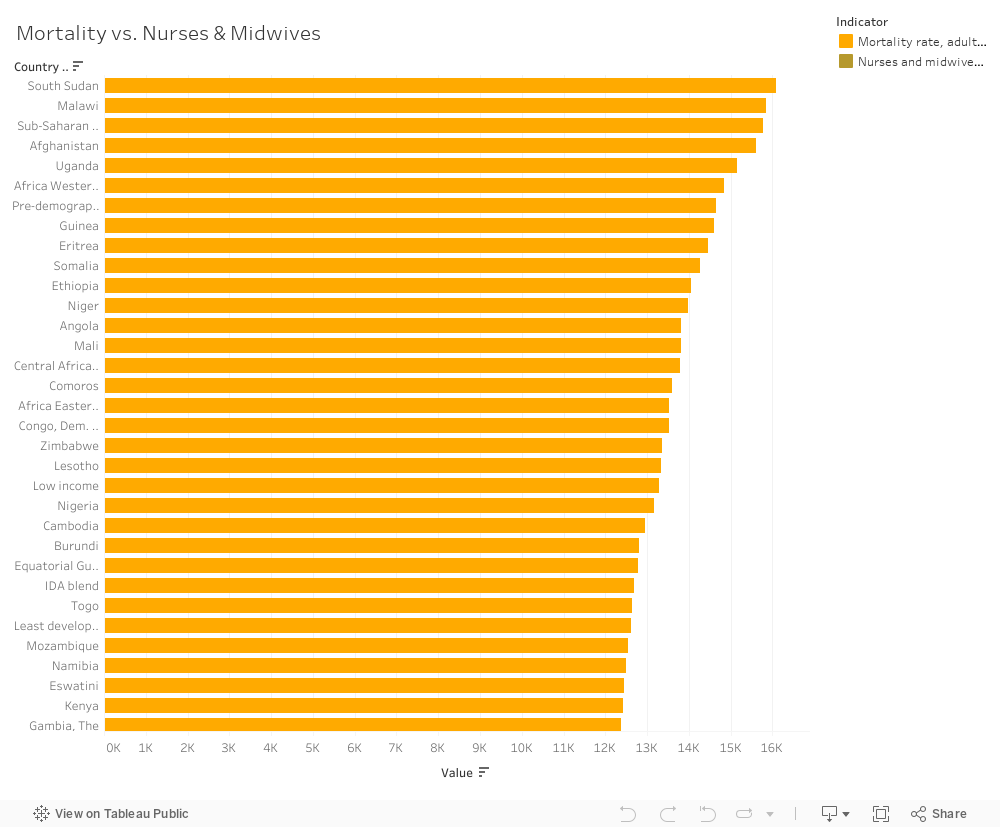
One indicator that may be used to assess the effectiveness of the medical industry is the mortality rate. From the data provided by World Development Index, countries with high death rates, such as the Central African Republic, Niger, South Sudan, and many others, have poor healthcare systems, as seen in the visual below:
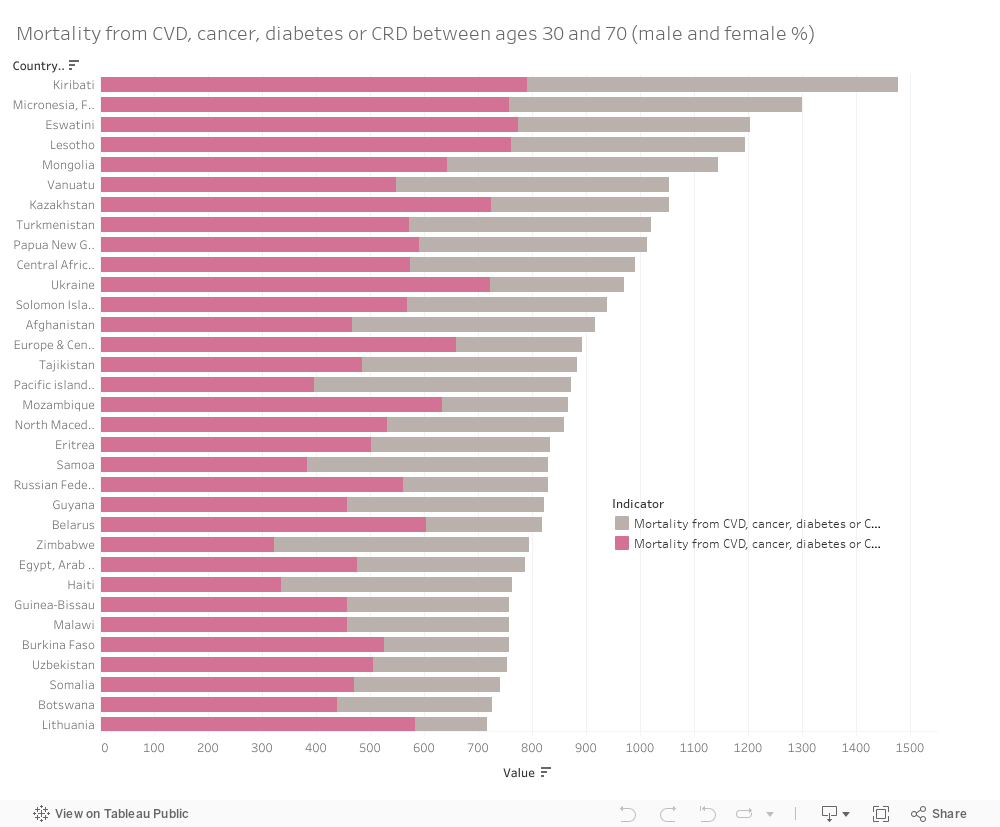
Furthermore, there exists a strong correlation between CVDs, cancer, diabetes and other illnesses that significantly impacted the mortality rate indication for both males and females. This implies that countries experience high mortality rates due to the increasing rates of the above-mentioned illnesses and diseases. Also, an implication of the absence of some healthcare services such as a lack of efficient medical professionals may be valid as well in such a case.
As a matter of fact, the presence of medical professionals that can assist society and offer health care is one of the most important measures of how well the medical sector is doing. Therefore, one potential solution is enhancing the availability of medical professionals that are prone to doing their job effectively.
There exists a weak correlation between the availability of nurses and midwives and the increasing rates of mortality. This is because an effective team of well-experienced nurses and midwives can strongly lead to a decrease in the number of deaths per hospital. The top 5 nations with the highest mortality rates also have the lowest number of nurses and midwives.
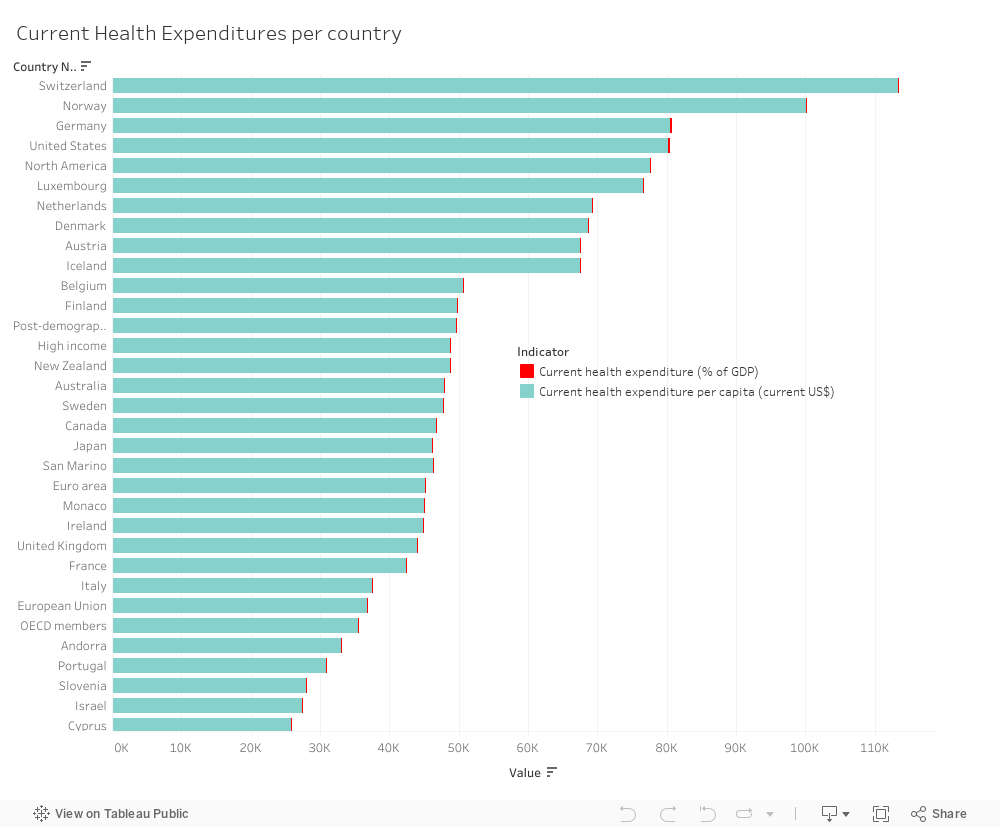
Another potential solution involves increasing expenditures in the healthcare field to gain access to more promising and efficient results. In order to improve the health of their medical industry, the nations with greater rates of mortality have to gain insight from the experience of those with developed healthcare systems, where a significant percentage of the more developed countries’ expenses goes to health expenditures (ex: United States, Denmark, Luxembourg, Norway etc.) Higher expenditure on healthcare implies higher expenditure on more enhanced medical professionals whose primary role is to save the day by decreasing mortality rates. Moreover, we can see that while less developed nations such as South Sudan and many others have far greater mortality rates (as discussed earlier), they almost all have a lower number of health expenditures too.
Countries with high mortality rates should prioritize expanding their nurse and midwife workforce. This can be achieved through targeted recruitment, better training opportunities, and incentives to retain experienced healthcare professionals. In nations with a scarcity of healthcare workers, it is crucial to consider redistributing them from regions with surplus staff to areas with greater need. This can help ensure more equitable access to healthcare services and reduce mortality disparities.
Also, the observation that less developed nations with higher mortality rates also have lower health expenditures highlights the need for increased investment in healthcare infrastructure, training, and resources. Adequate funding can have a significant impact on healthcare accessibility and quality.
In conclusion, the state of a nation’s healthcare system is a complex web created by several kinds of variables. According to the results of our investigation, nurses and midwives are vital in determining healthcare outcomes, and there seems to be a link between their availability and death rates. Key suggestions to improve patient care and results included strengthening the healthcare workforce through recruiting, skill development, and equitable distribution.
Furthermore, the evidence indicated a clear link between less health expenditures and higher mortality rates in several less developed nations. This emphasizes the urgent need for increased funding and resources to bridge healthcare disparities and improve the well-being of vulnerable populations.
As we journey towards a brighter future, let us remember that the path to a thriving medical system lies in unity, innovation, and data-informed decision-making.