Patrick Lynn Warren Sr., Vincent “Vinny” M. Belmonte, Angelo Quinto, Andre Maurice Hill… What do these names mean to you? Probably nothing.
Michael Jackson, Oprah Winfrey, Lebron James… you probably got excited just hearing their names.
Well, the first group of people are a set of victims of police violence, their lives were so cheap that they were killed and shot dead unfairly. Police brutality and violence is an issue that we see everywhere, that accompanied with racism, is causing the world the lives of so many innocent people.
In our research we aim at highlighting this issue through facts and data visualized in graphs that emphasize the severity of the situation. We don’t stop there. We also tackle the black lives matter movement and its effect on the numbers of police-caused deaths and racism. Finally, we suggest a new potential solution and evaluate it
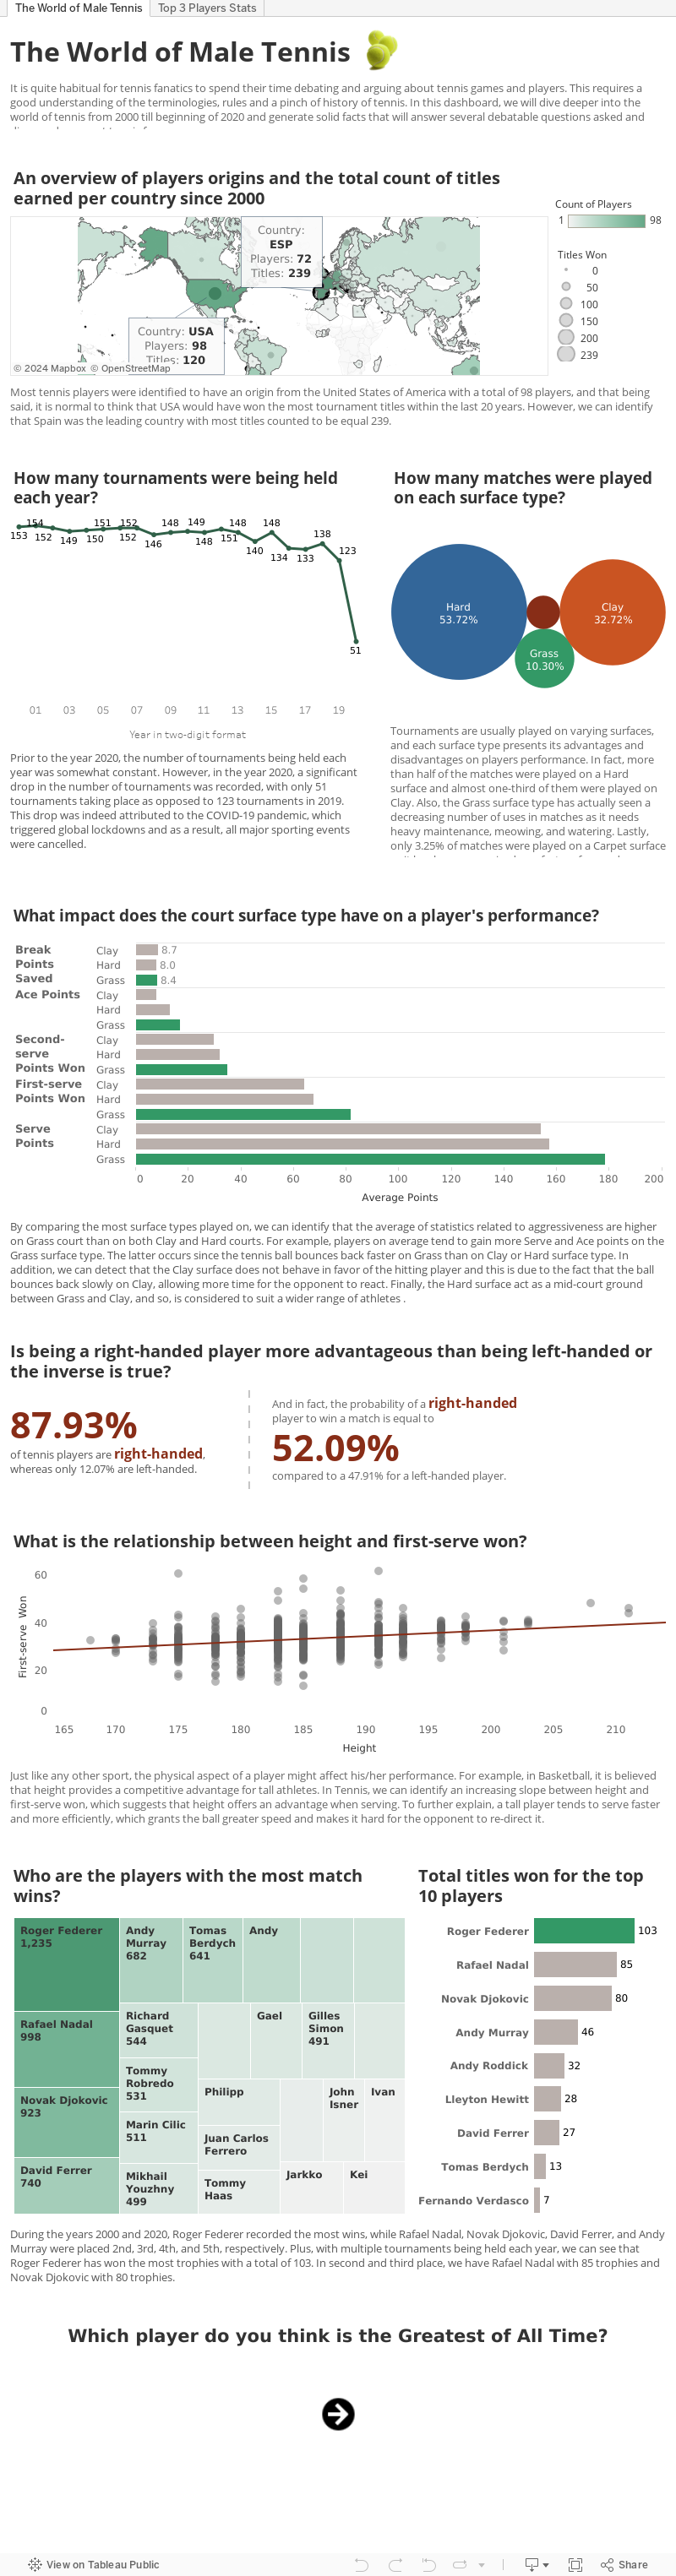
Tennis is an Olympic sport and is played at all levels of society, across all ages and practiced by many around the world. Tennis is played by millions of recreational players and is also a popular worldwide spectator sport. With the help of data covering all game metrics ranging from 2000 till the beginning of 2020, this project aims at generating some general insights about tennis, all while delving into the specifics of some of the most debated questions in the world of Tennis:
Is a right handed player more advantageous than a left handed player?
Does a player’s height impact their performance?
Amongst the different types of fields (grass, clay, and hard), which player has the best performance and title wins?
Who is the greatest Tennis player of all time?
This analysis is left open for debate among Tennis fans in the comments.
Going into its third year of a severe and continued economic depression, Lebanon is currently facing its hardest downfall which is arguably worse than that faced during the past civil wars. With all what is going around including the absence of a responsible and adequate government, the corruption that exists in all form in the public and private sectors, the COVID-19 pandemic, the Beirut port explosion, and the anti-government protests, Lebanon reached a record-high inflation rate which resulted in a drastic devaluation of the Lebanese Lira.
Consequently, this led to an increase of up to 500% in market food prices. In fact, UNESCWA estimates reveal that more than 55% of the country’s population is now trapped in poverty and struggling for bare necessities. What makes it worse is that even the prices of essential products for basic nutritional needs have nearly tripled, and the government is not intervening to control the prices of these products. In an attempt to raise awareness about the tragic situation that most Lebanese families are facing, our team tried to explore the change in the basic products’ prices over the last couple of years across Lebanon.
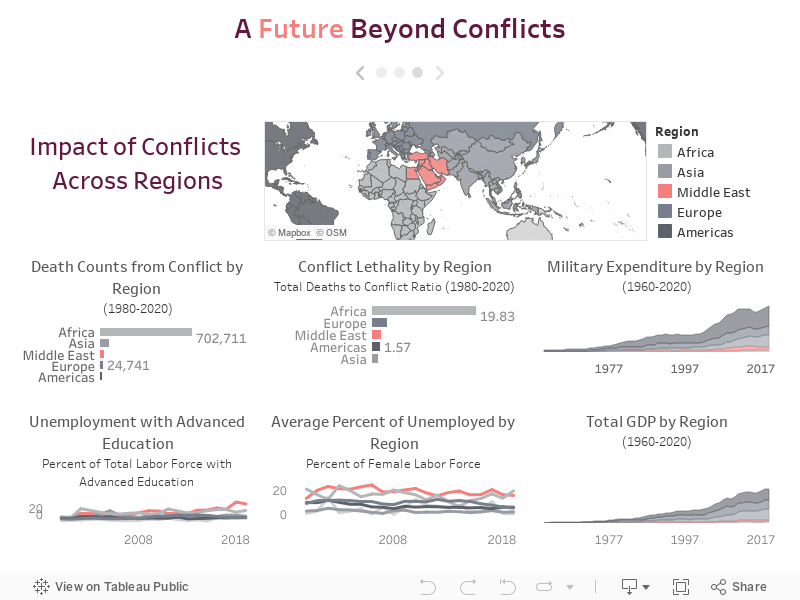
Youth living in countries in the midst of conflicts or wars seem to be devastated, demotivated and worried about their future. Their discouragement is due to the negative ramifications that conflicts have on education and the economy. As a matter of fact, with conflict comes uncertainty about employment opportunities, continuity of education, educational attainment and impoverishment. However, history provides a rather optimistic economic and educational outlook to the future of war-torn countries.
The aim of our analysis is to guarantee to youth in the Arab world that a brighter future is ahead of them, and to encourage them to have hope of a prosperous future.
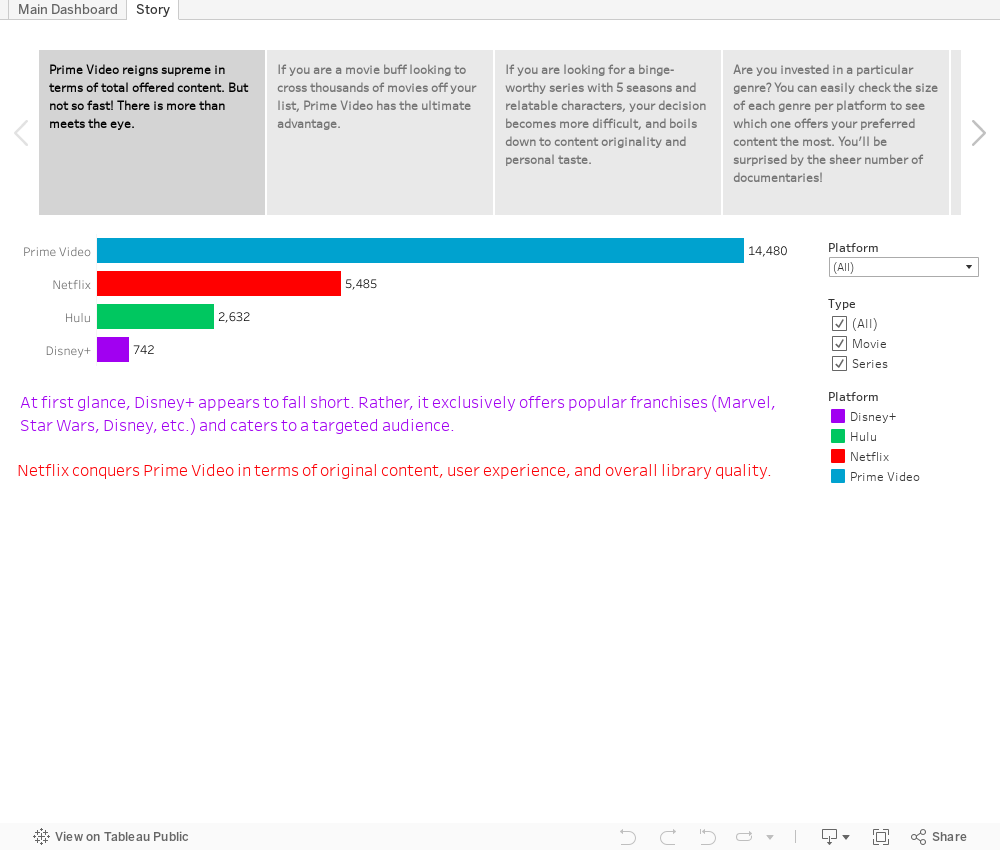
The cord-cutting phenomenon is quickly gaining traction with the advent of COVID-19. Apart from its bothersome commercials and restricted programming, cable TV demands a taxing average rate of $100 per month from its subscribers (CNET, 2019). While more than 31.2 million households have abandoned classic cable in 2020 (TechCrunch, 2020), streaming services have witnessed soaring sign-up rates thanks to their affordable pricing, diverse offerings, and flexible on-demand schemes. For example, Netflix alone received 16 million new subscribers in merely the first quarter of the same year (BBC, 2020).
Yet, as with many cases of consumerism, people might feel overwhelmed by the abundance of choices (American Psychological Association, 2004), and it might be difficult to make informed decisions. Put simply, how may consumers select the appropriate streaming service(s) when more than 100 of them are at their disposal? (CNET, 2019). To mitigate the risk of “streaming service overload” (CNET, 2019), whereby individuals misguidedly drive up their costs by subscribing to numerous services, our team is interested to explore, compare, and contrast the offerings of popular streaming services (Netflix, Hulu, Disney+, and Amazon Prime).