
by Tarek El khayat | May 5, 2020 | Visualization
The fertility mutates from region to another and it is related to the culture, education level and civilization. It also decreases from year to year because of civilization, weather, and human life style.
This Dash compares 3 different countries USA: Advance country , Lebanon : Arab region and Africa:third world and shows that all the countries will have the same fertility rate in the future.
Data source: https://www.opendatalebanon.org/
by Tarek El khayat | May 4, 2020 | Visualization
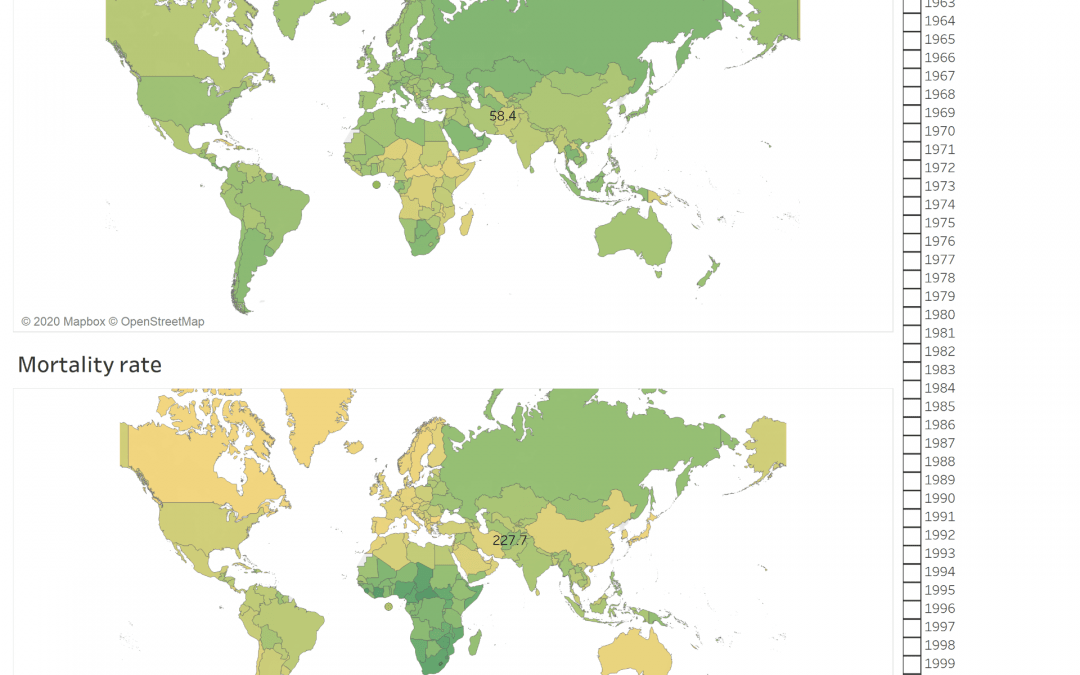
The Dashboard shows the mobile subscription rate around the world between 2013 till 2019 and compare it with the mortality rate. It is clear that the mortality rate is related to another factor and there is no contribution between the increase of mobile subscription and the mortality rate and the mobile is not the direct cause of mortality
by Tarek El khayat | May 4, 2020 | Visualization
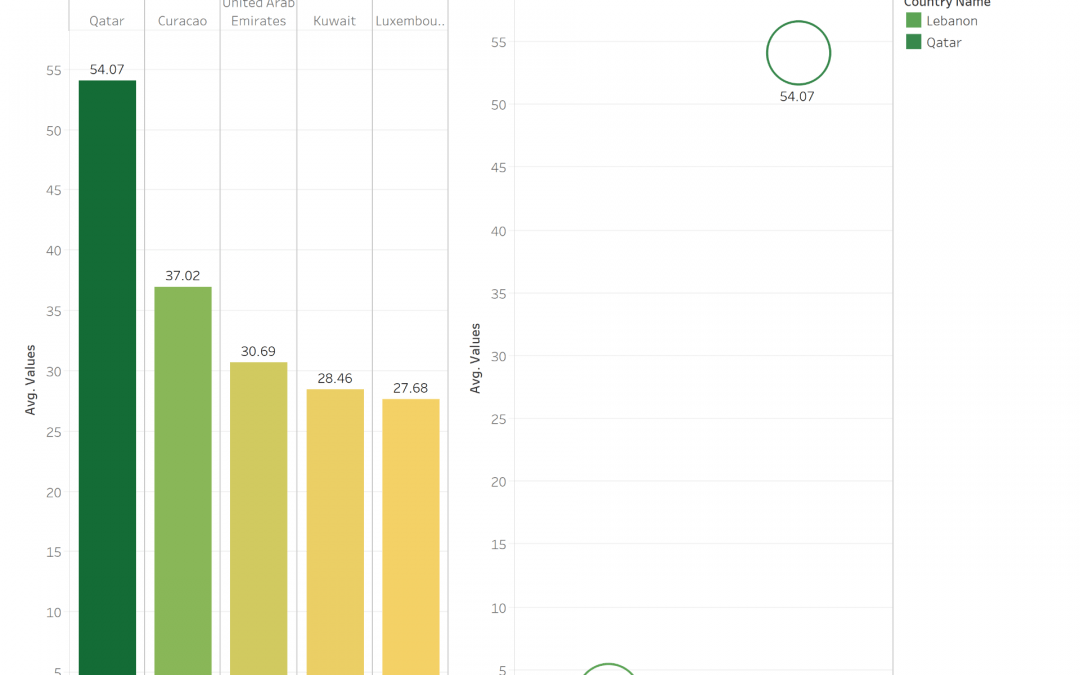
CO2 emission is one of the important factor that is destroying our planet and causing diseases, global warming …
The Graph shows the Top 5 countries with higher CO2 Emission and shows that QATAR take the lead in the world and the Arab region