The intricate relationship between infrastructure development and tourism in Lebanon is a multifaceted issue, with various components playing a crucial role in the country’s ability to attract and satisfy tourists. An in-depth analysis of this interplay reveals several key areas of focus:
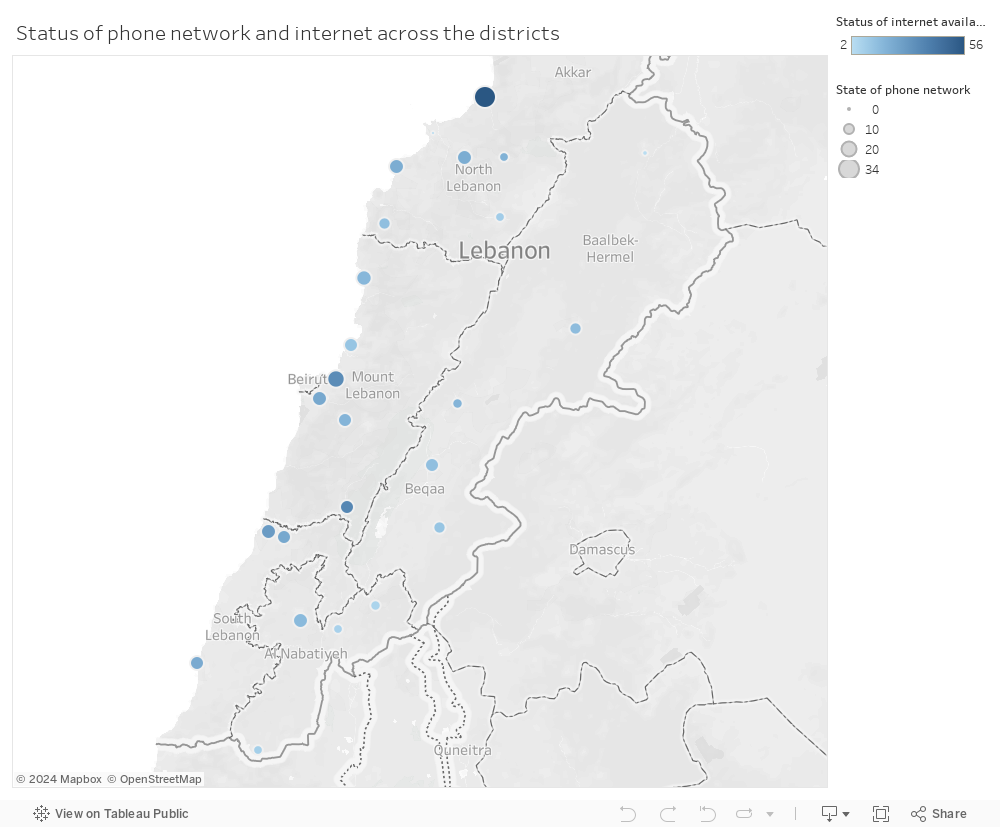
Communication Infrastructure
Urban areas in Lebanon face challenges with communication infrastructure, such as limited broadband access and unreliable networks. This hinders effective communication and limits access to essential services, impacting the tourist experience significantly.
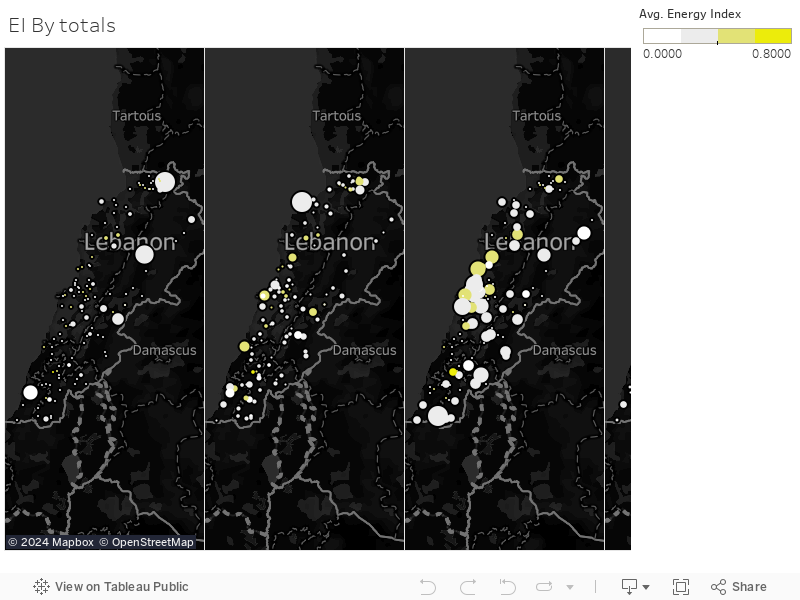
Electricity Supply
Reliable electricity is essential for sustaining urban environments and attracting tourists. Inconsistent power supply and frequent outages disrupt daily life and tourism-related services, making it hard for areas to attract and retain tourists.
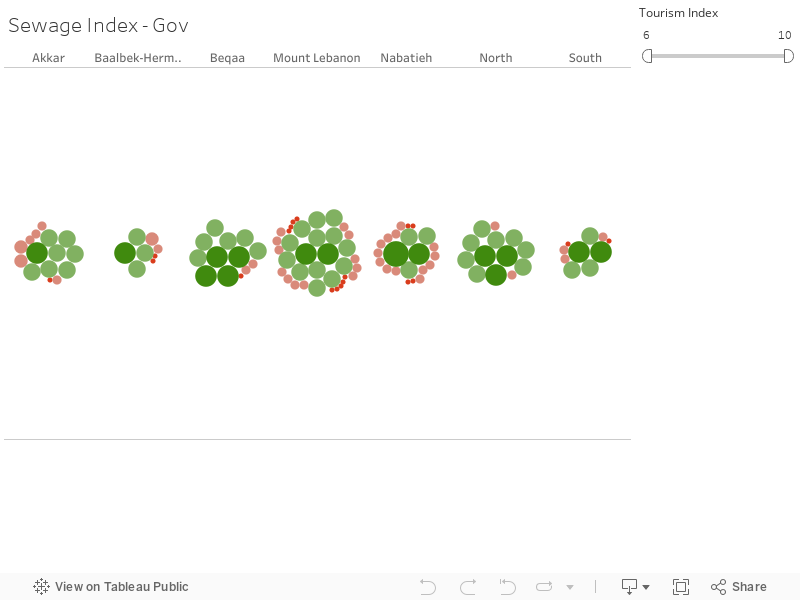
Water and Sewage Management
Water quality issues are prevalent across various regions in Lebanon. Tourist destinations, in particular, require immediate interventions to address substandard water quality and inefficient sewage systems. Such inadequacies not only affect environmental quality but also influence tourists’ destination choices.
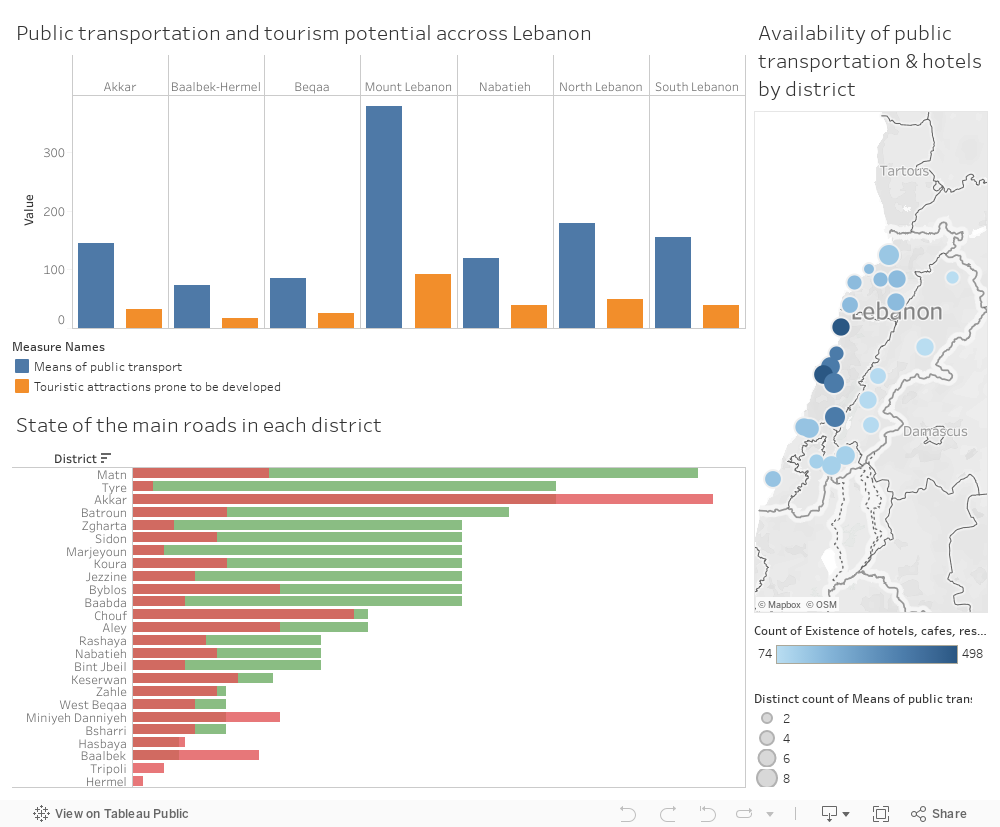
Public Transportation
The state of public transportation varies across different regions in Lebanon. While some areas like Mount Lebanon exhibit developed public transportation infrastructure, other regions lag behind. This uneven distribution affects the ease of movement for tourists and impacts their overall experience.
Tourism and Infrastructure Alignment
There is a noticeable disparity between regions with high tourism appeal and the adequacy of their infrastructure. For instance, areas like Mount Lebanon and Beqaa, despite having high tourism indexes, show mismatches in sewage management and electricity supply, indicating a need for a more balanced development approach.
Survey Insights
Surveys reveal that Batroun, Byblos, and Beirut are preferred tourist destinations, highlighting the need for focused developmental efforts in these areas. Issues such as road safety and the perception of travel safety significantly influence tourist decisions.
Strategic Recommendations
To foster sustainable tourism growth, Lebanon needs targeted infrastructure development, especially in key tourist hubs. This includes improving transportation, accommodation, and telecom connectivity.
Sustainable water management practices and the establishment of efficient water treatment plants are crucial for addressing water quality issues.
Upgrading sewage systems in tourist-heavy areas is vital to prevent environmental degradation.
Ensuring a reliable electricity supply, potentially through renewable energy sources and modernized power grids, is essential for supporting the needs of tourist establishments.
Developing an efficient and accessible public transportation network, particularly in regions with high touristic potential, can significantly enhance the tourist experience.
Data-Driven Decision Making
Continuing to use data analysis and surveys is key to informing policy and investment decisions. This approach ensures that resources are distributed where they are most needed and can have the greatest impact, ultimately enhancing Lebanon’s appeal as a premier tourist destination and fostering sustainable growth.
The United States of America (USA) is home to more international immigrants than any other country in the world. In fact, the USA has more international immigrants than Germany, Saudi Arabia, Russia and the United Kingdom combined. You, I, and hundreds of students reading this blog are in the midst of crafting our career paths, where many have the aspiration of finding their dream job or pursuing a PhD in the USA. When you reach this point, you start thinking about what company or university to apply to, and your first hope is to get accepted to the university or job you applied for. However, this acceptance would be pending your visa acceptance. This is the stage that many people find to be the most challenging: getting a visa to the US.
The American dream has been the focus of attention for many visa applicants; as they are seeking better work opportunities, liberty, democracy, and equality. However, behind this pursuit lies a complex factor that shapes the final status of the visa application, as applicants are not seen as equal in the eyes of USA visa employees. Many of an applicant’s uncontrollable demographic characteristics determine the acceptance probability of his application. For example, being from Micronesia gives a 100% rate of the visa being denied. In this blog post, controllable characteristics will be analyzed and visualized to showcase the optimal employee profile that is more likely to be granted a US visa. This blog post will focus on immigrant visas, with a specific emphasis on those related to employees. Using data driven analysis and exploration, the key influencers affecting the US visa acceptance will be explored, and recommendations will be given to solve the ongoing problems facing the US visa application acceptance.
Unlocking Opportunities: Understanding U.S. Work Visas
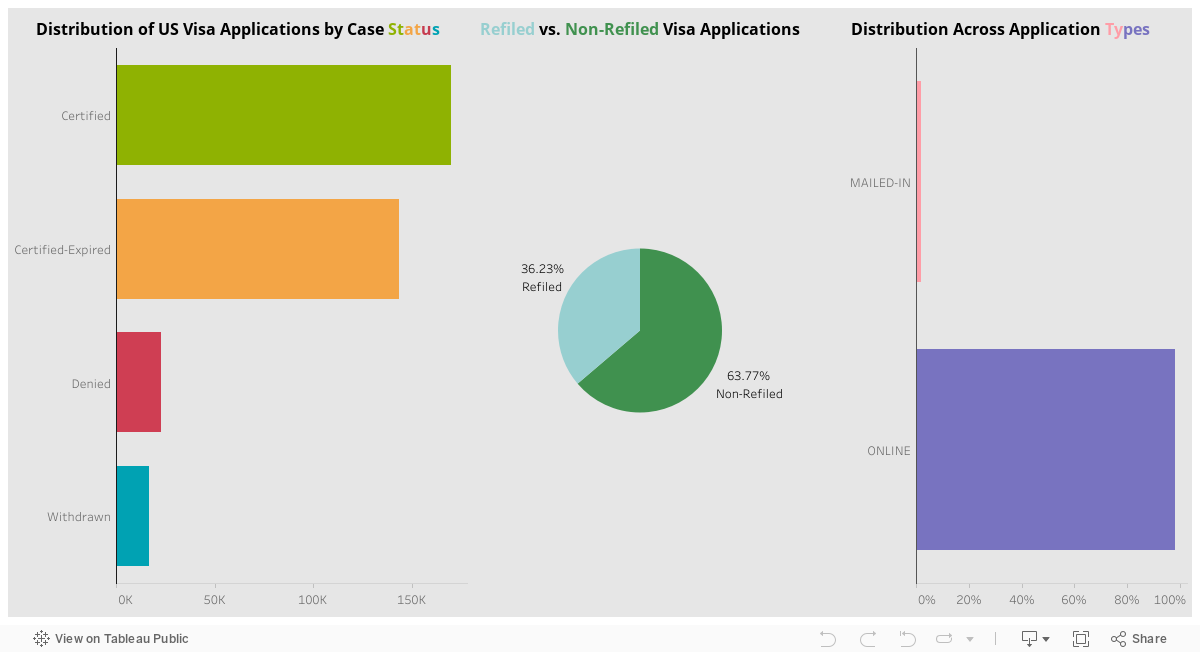
In the following dashboard, you have the option to filter through various visualizations by selecting different case statuses, “refiled” or “non-refiled,” and application types. The initial visualization offers a quick overview of certification rates within the dataset, highlighting that a substantial number of applications, specifically 170,126, have received certification. In contrast, a smaller portion, only 22,912 applications, has been denied. These figures suggest an encouraging trend in the certification process, pointing towards a favorable environment for visa approvals. The positive trend observed in the dataset may have broader policy implications. It could suggest that existing visa policies or recent changes have contributed to a more favorable climate for applicants.
The second visualization delves into the refiled applications, showcasing that 36.23% of submissions have undergone the refile process, while the majority, 63.77%, have not been refiled. This insight could prompt further investigation into the reasons behind refiling and provide valuable information for refining application procedures.
In the third visualization, when visualizing the channels through which applications are submitted, it is evident that a vast majority, 98.4%, are completed online, while a smaller fraction, 1.6%, opts for mailing in their applications. This emphasizes the dominance of digital submissions and suggests an opportunity to optimize online processes.
Three Key Requirements: The Foundation for Visa Success
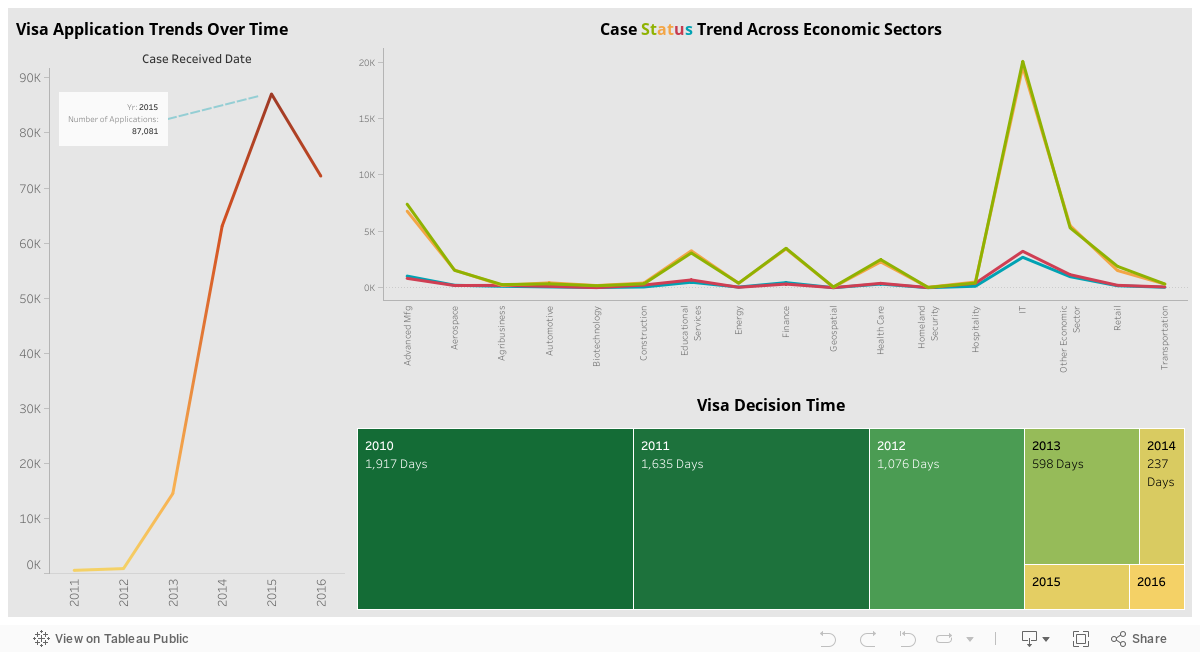
The first visual below tracks the number of received visa applications over the years. Notably, there’s a growth trend from 2011 to 2015, peaking at 87,081 applications. However, the trend reverses in 2016, with a decline to 72,171 applications. This temporal analysis invites exploration into the factors influencing application fluctuations.
Highlighting sector-specific trends, the second visual indicates that the IT sector consistently holds the peak for all case statuses. This insight can guide resource allocation, policy adjustments, or sector-specific considerations to further streamline visa processing.
The third visualization focuses on the duration of visa decisions over time. It unveils a significant decrease from 2010, where decisions took 191.7 days on average, to 2016, where the duration plummeted to 96 days. This trend suggests an improvement in processing efficiency and responsiveness.
In this dashboard, the aim is to dig deeper within the dataset to draw further insights into the optimal applicant profile.
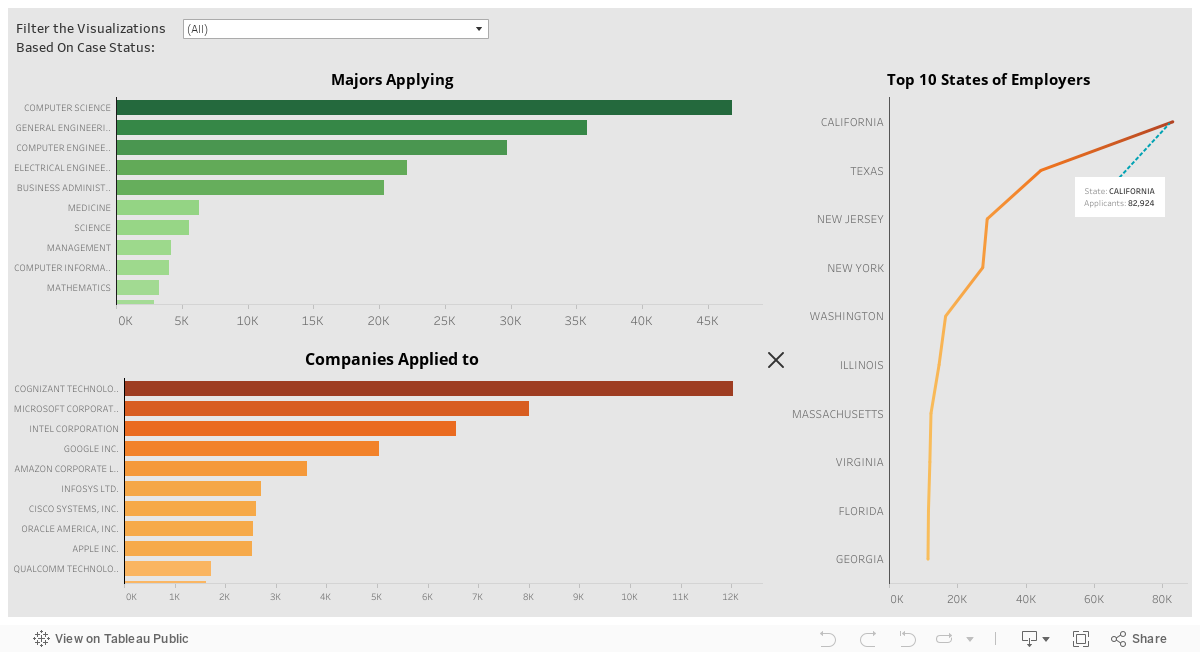
The first bar chart showcases the top majors applying for a US visa, with computer science on top, followed by general engineering and computer engineering. This suggests a notable trend in the major choices amond individuals applying for US visas. The dominance of computer science – related majors suggests a high demand for individuals with expertise in technology and programming. The data implies that individuals with computer science and engineering backgrounds may have advantageous prospects in securing employment opportunities in the US.
The second bar chart showcases the companies applied to, with Cognizant Technology being on top, followed by Microsoft, Google and Intel. This information provides insights into the preferred employers for US visa applicants. The prevalence of applications to those technology giants indicates a substantial internet or demand in the technology and IT sectors. The data suggests that individuals seeking US visas often target employment opportunities with these prominent companies, possibly due to their global reputation, job offerings, or industry influence. For applicants, this informs their choices and strategies when seeking employment opportunities in the US.
The line graph showcases the top 10 employer states, with California as the frontrunner with 33,903 applicants. Notably, California stands out as a technology hub, attracting the highest number of job seekers.
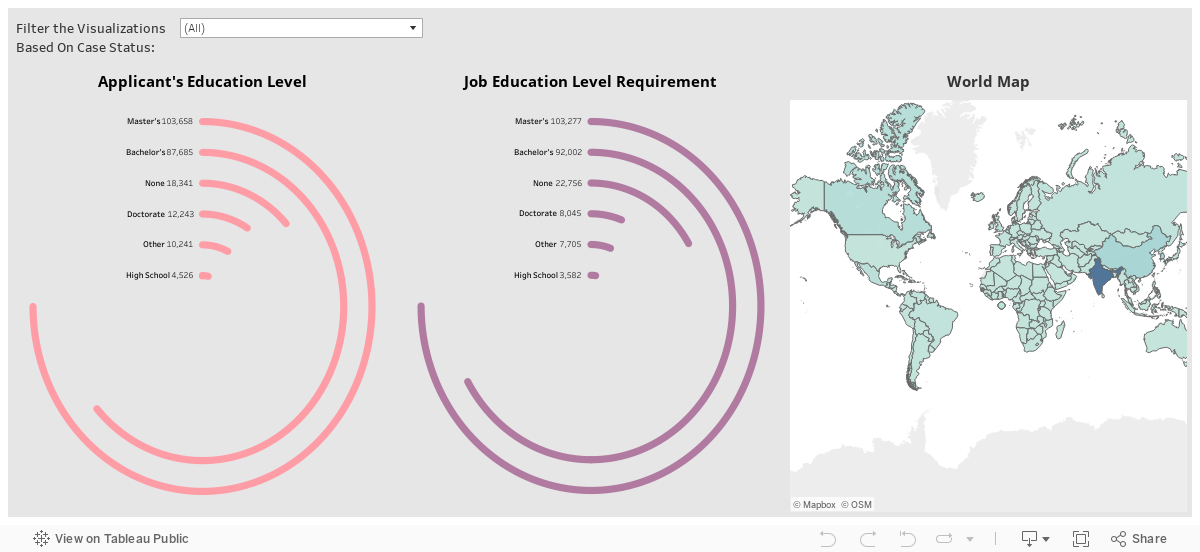
Based on the first radial bar chart, there is a visible pattern in the education level requirements for jobs. As indicated, a Master’s degree is the most commonly sought after qualification, followed by a Bachelor’s degree, and with “None” representing the third category. This information could have implications for individuals seeking employment visas: since the majority of job opportunities require a Master;s degree, prospective visa applicants can enhance their chances by acquiring this degree. Bachelor holders will also find opportunities, but with higher competition, while individuals without an educational background, or a doctorate, might have limited options.
This second radial bar chart showcases the applicant’s education level, with a masters degree coming on top, followed by a bachelor, and doctorate coming as third. This information suggests that both Master’s and Bachelor’s degrees are the most common educational levels among applicants. This finding signifies that US visa applicants hold a high level of education. The prominence of doctorate degrees, even if third in frequency, indicates a pool of highly qualified and specialized cadidated. Visa authorities and employers may take note of this educational distribution, potentially influencing the competitiveness of applicants based on their educational backgrounds.
The world map aims to visualize the distribution of the top countries where visa applications originate from, taking into account the birth country as well as the country of citizenship of applicants. When considering birth country, India comes on top, with 31,363 applicants originating from the country, followed by China, with 4,870 applicants, followed by Canada with 2,033 applicants. This data correlates with our research, where India comes on top when it comes to visa applications.
Proposed Solutions:
1- Optimize Online System: Applicants should advocate for embassy investment in optimizing the online system to enhance efficiency. Focus on user-friendly interfaces, mobile responsiveness, clear guidance, and targeted measures to address common issues leading to refiled applications.
2- Validate Information: Applicants are advised to thoroughly review and validate all entered data during the application process to ensure accuracy and completeness, reducing the risk of immediate denial due to inadvertent errors or misinformation.
3- Avoid Traditional Mail Submissions: Discourage the use of traditional mail submissions due to the higher risk of denials caused by potential discrepancies and errors in the manual processing involved.
4- Apply for Correct Visa Type: Ensure applying for the correct visa type, understanding distinctions between similar visas, and aligning qualifications with the intended job to prevent application denial.
5- Advocate for Industry Collaboration: Tech majors should actively advocate for closer collaboration between the immigration department and industry leaders to address specific challenges faced by IT professionals. Proactive research on tech job requirements is recommended.
6- Partnerships with Major Employers: Establish partnerships with major tech employers to streamline the visa application process, address challenges, and ensure a smoother experience for applicants targeting renowned organizations.
7- Seek Assistance from Parent Companies: When applying to a subsidiary, seek assistance from the parent company to enhance the chances of approval, as applications from well-known industry leaders are more likely to be approved.
8- Feedback Mechanism for Past Applicants: Establish a feedback mechanism to collect insights from past applicants, identify pain points, and implement changes for an improved overall application experience.
Conclusion: These proposed solutions collectively aim to address various aspects of the U.S. visa application process, from system optimization and data validation to industry collaboration and feedback mechanisms. Implementing these measures can contribute to a more efficient, accurate, and applicant-friendly visa application experience.
Share Your Experience!
Have you navigated the U.S. visa application process? We’d love to hear about your experiences, challenges, and successes. Share your insights in the comments below and let’s create a space for knowledge-sharing and support as we collectively navigate the path to a thriving career in the United States!
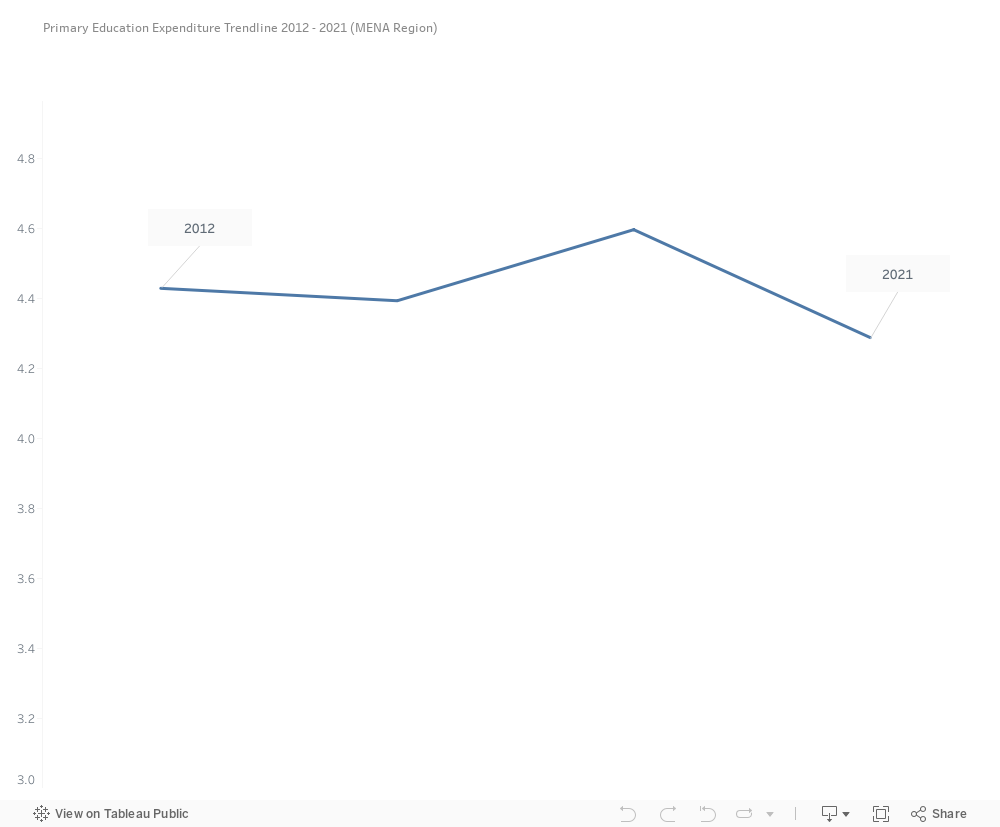
Imagine a journey through time, from 2012 to 2021, where Primary Education Expenditure in the MENA region is on a decreasing trend from 4% to 3%. It’s a concerning trend that threatens the very foundation of education for our children.
The Problem
The problem is crystal clear. When you cut down on education spending, you’re essentially trimming the wings of future generations. The numbers don’t lie. The shrinking budget for primary education means dilapidated schools, underpaid teachers, and a lack of essential learning materials.
The Bright Path Forward
The road to recovery starts with one word: Investment.
Pouring more funds into primary education.
Making the most of available resources.
Shouting from the rooftops about why this matters.
Rewarding those who make it happen.
How do we know our solution works?
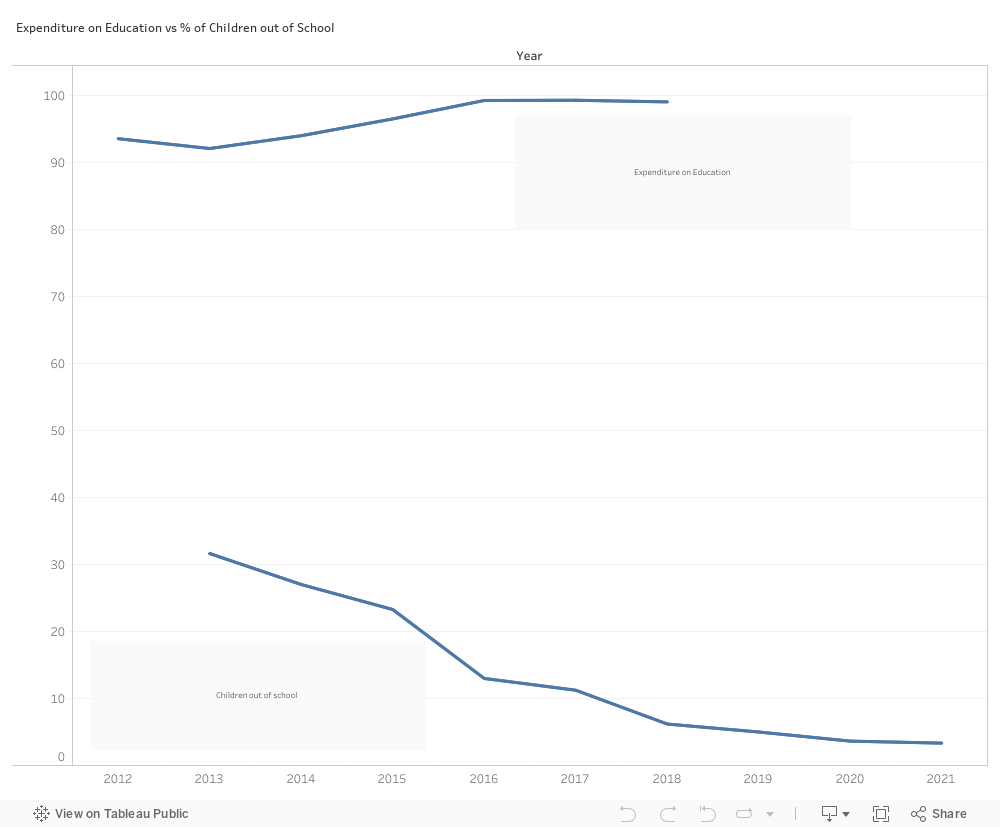
Numbers don’t lie, but they can also tell a tale of triumph. And “Cote D’ivoire” is a great example. When increasing the educational expenditure, the percentage of children school drop outs decreased from 31% in 2013 to 3.1% in 2021.
Recommendation
The results speak for themselves. More investment equals better education. Keep the funds flowing, optimize, and let’s champion education together.
When we invest in primary education, we invest in brighter futures. It’s high time MENA governments heed the call and secure quality education for all.
Crash injuries are ranked as the eighth leading cause of global mortality across all age groups and this is predicted to climb to seventh by 2030. Lebanon, in particular, stands out with a safety record deemed “among the worst globally” by the World Bank. According to 2020 data from the World Health Organization (WHO), Lebanon holds the 89th position in global safety rankings.
Due to the importance of the above-stated issue, we analyze the primary causes of road crashes, focusing on fatalities and the most affected population, wrapping up with recommendations for authorities.
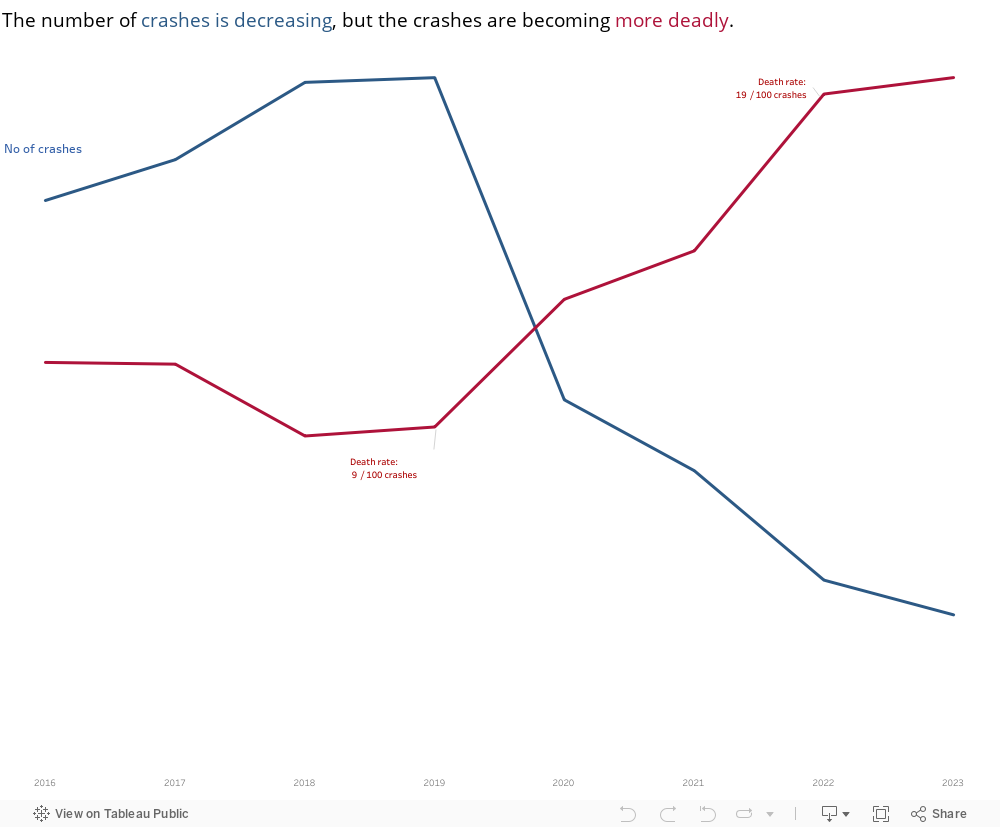
To start with, the number of crashes in Lebanon followed an upward trend until it reached its peak in 2019. After the economic crisis in Lebanon and the increase in gasoline prices in the country, the number of crashes decreased and started following a downward trend till today. Although these numbers seem promising, when examining the death rate / 100 crashes, we notice that it has been following an upward trend since 2019. This suggests that while the overall number of accidents in Lebanon has decreased compared to four years ago, the severity of these accidents has escalated.
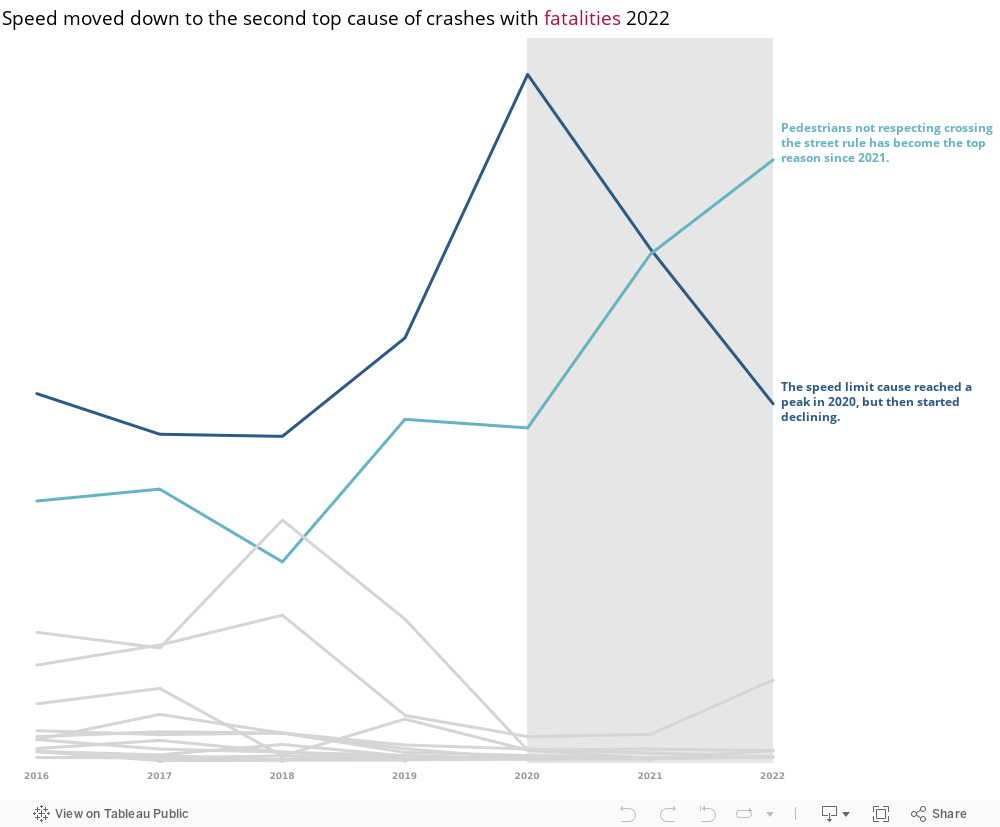
Now we are interested in checking the causes behind crashes with fatalities to understand what is happening. The figure below shows that there are two main causes of these crashes:
1- Driver not abiding by the speed limit
2- Pedestrian not abiding by crossing the street rules
As the above figure shows, pedestrians not abiding by crossing the street rules has become the top cause leading to crashes with fatalities.
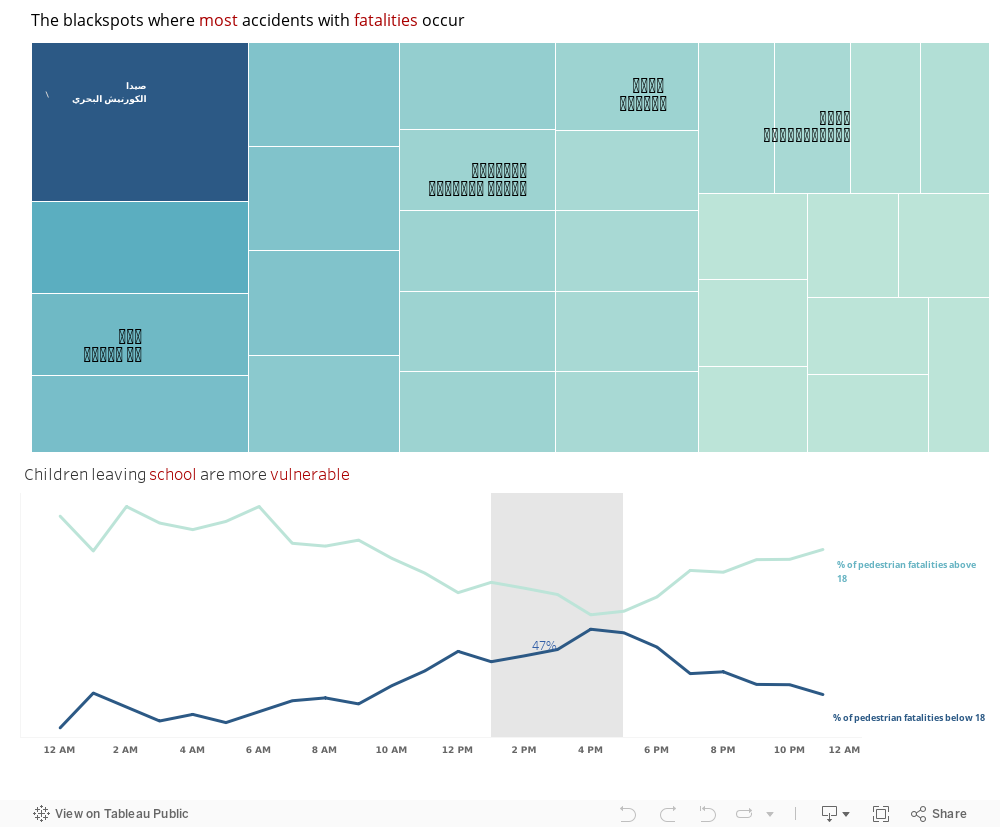
Now let’s keep this in mind and check for “blackspots” or spots with high crashes leading to fatalities to understand what is happening.
The figures below show that:
1- There are several blackspots in Lebanon, 5 of which are common findings with ISF Lebanon. After checking all 5 locations, we found out that all have a structure similar to highways.
2- The percentage of pedestrian fatalities among children reaches its peak between 2 PM and 4 PM – end of school hours time.
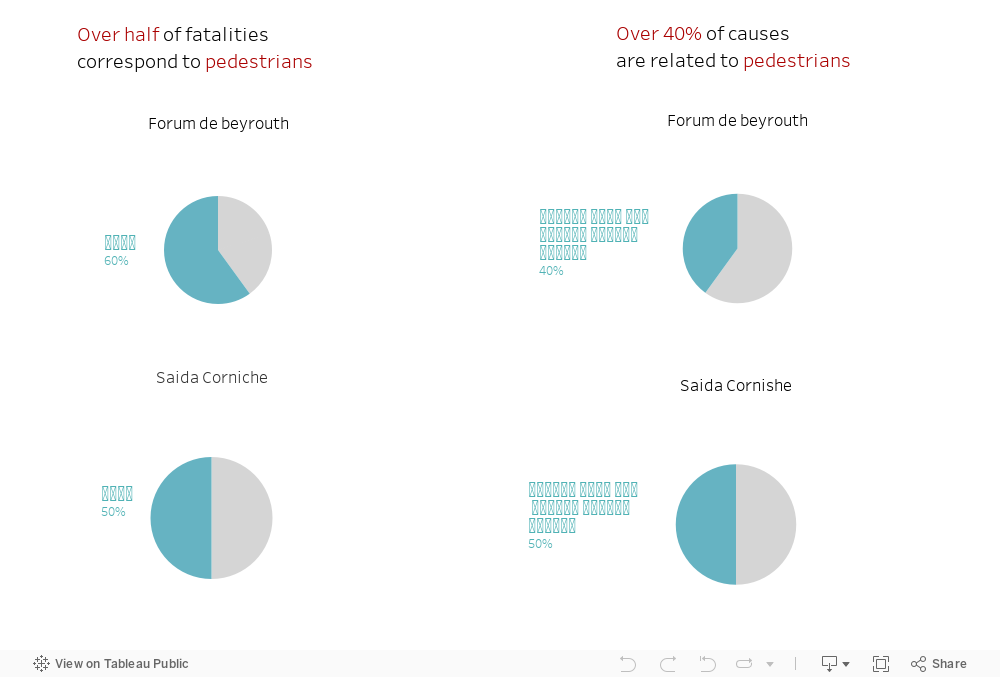
Now, we need to check what is the most vulnerable population (that has the highest fatality rate) and what is the main cause of such crashes. We do so by focusing on two of the blackspot locations: Saida (الكورنيش البحري) and Carantina (فوروم دو بيروت).
When drilling down into the two blackspots, we realize the following:
1- Pedestrians constitute at least 50% of the fatalities.
2- At least 40% of ‘Cause of Crash’ is: Pedestrian not abiding by street crossing rules, a cause discussed earlier above.
But here a question arises: Does this sound as if we are over-blaming pedestrians? What rules are we talking about? Does the street situation in Lebanon, facilitate crossing the streets for pedestrians? As we all know, in most cases, the answer is no, we don’t. Then, what could be done?
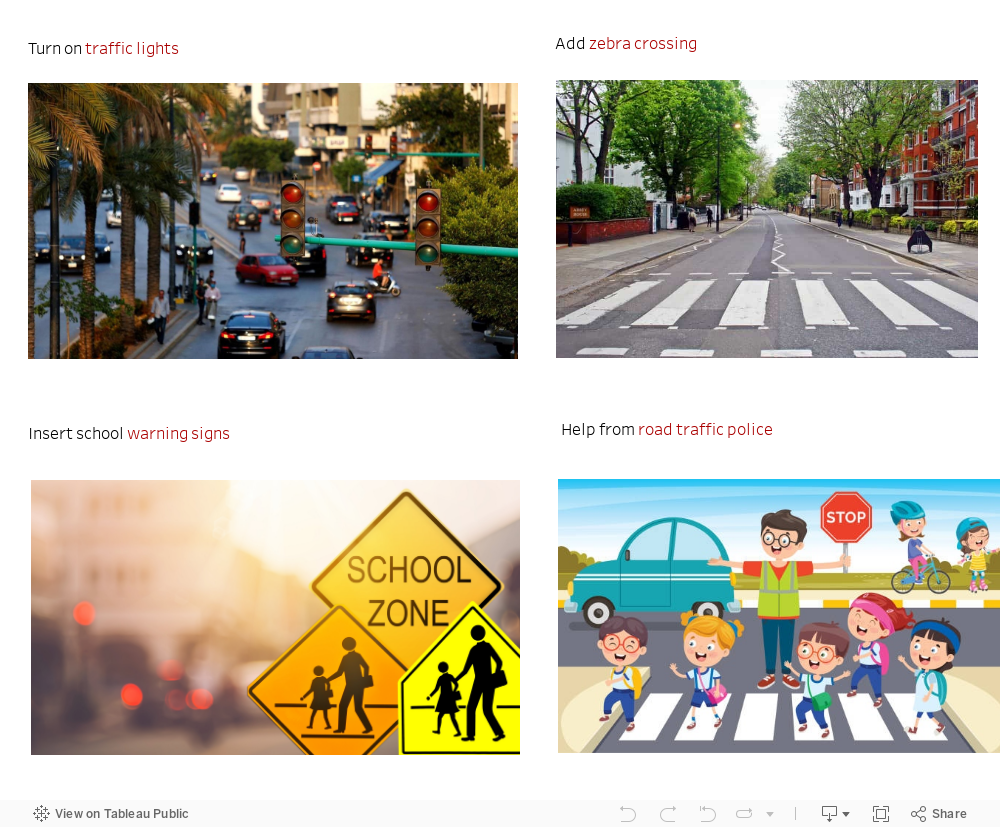
Since we all know the economic situation in Lebanon, we are here to offer low-budget approaches that are applied in other countries and have proved their efficiency:
1- Turn on traffic lights, at least those that are on junctions and cross points. This could be done in collaboration with civil society and NGOs that would be pleased to help by providing electricity supply through their private generators or solar stations; some initiatives have already been done.
2- Paint specific locations where pedestrians need to cross roads by Zebra Crossing in order to signal for cars to slow down and pay more attention to pedestrians.
3- When it comes to needed areas around schools, add school warning signs. Traffic police could also help during out-of-school hours on certain roads.
The figures below provide examples of what has been discussed earlier.
In addition to the above-stated on-ground actions, spreading awareness is a key action that could be performed at different levels targeting different age groups, starting from intensifying road safety topic in school programs at early age stages, reaching to broadcasting awareness campaigns that target older age groups.
Acknowledgement:
All data used for this blogpost is retreived directly from ISF who has thankfully collaborated and provided the data needed covering years 2016 – 2023.
Exposing Beirut’s Struggle with Insight from Chicago’s Urban Symphony
In the once-vibrant areas of Beirut, a city facing economic crisis, a quiet upsurge in crime, especially theft and robbery, casts a shadow. The challenge increases when important crime data is still confidentail, making it more difficult to understand the complex criminal environment in the city. Unflinching in the face of difficulty, our investigation draws inspiration from Chicago’s urban environment and aims to uncover the hidden strands that may lead to crime hotspots and relevant individuals in question. The study turns into a ray of hope, a data-driven compass pointing the path toward strengthening public safety in the face of Beirut’s difficulties.
Cracking the Nuanced Web of Beirut’s Increasing Crime Rates
As we delve deeper into our investigation of Beirut’s urban dynamics, the rise in crime rates becomes an interesting illustration of the city’s intricate issues. The social and economic fabric has been scarred by the turbulent aftermath of the Beirut port explosion and the widespread effects of COVID-19, which created opportunities for crime. The ongoing economic crisis, made worse by inflation and financial stress, drives people to extreme lengths. When there is political turmoil, those who take advantage of the situation and avoid responsibility exploit the confusion.
Connecting Chicago and Beirut through Shared Data Approaches to Reduce Crime
A promising possibility for the implementation of a comparable crime reduction plan is revealed by drawing comparisons between Chicago and Beirut. The Chicago Police and the Lebanese Internal Security Forces (ISF) possess similar datasets regarding crimes. The common data elements set the stage for replicating Chicago’s effective strategy in Beirut, including crime locations, kinds, and the critical differentiation between domestic and non-domestic occurrences.
Here’s to a Safer City
A strategic beacon appeals in the maze of urban issues, where the conflict of rising crime is increasingly complemented by the rhythm of city life. Imagine this: smart use of resources, keen observation of trends, and cooperative interaction with regional authorities. These are the cornerstones of our practical strategy to strengthen public safety:
– Allocating Resources in Hotspot Regions: Determine high-crime areas and use resources like police stations and security cameras strategically.
– Identification of Patterns: Find recurrent crime trends and stay alert of problems near certain hotspots, such as banks and jewelry stores.
– Follow daily and seasonal trends: Assign more officers on duty when crime is at its highest.
– Monitoring and Assessing Performance: Monitor crime rates both in terms of time and location. Perform analysis based on category and use unit performance as a benchmark for efficient research strategies.
Through the perceptive eye of data visualization, all the suggested strategies may be indicated and easily applied, providing a thorough and dynamic perspective on the dynamics of urban crime.