2008 Recession
The 2008 financial crisis, also known as the “Global Financial Crisis” or the “Great Recession,” was one of the most severe economic downturns since the 1930s Great Depression. Originating in the United States, it rapidly became a global phenomenon that impacted economies worldwide. A confluence of factors, including the bursting of the housing bubble, a surge of subprime mortgage defaults, and a crisis in the global financial system, precipitated the crisis.
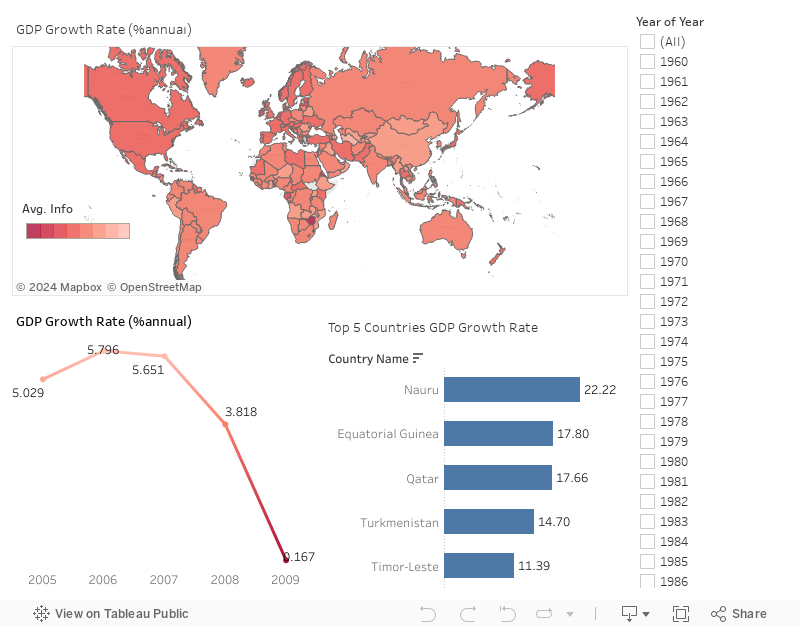
Nauru has the highest average GDP per capita among the countries enumerated (22.22), followed by Equatorial Guinea (17.80), Qatar (17.66), Turkmenistan (14.7), and Timor-Leste (11.39). These nations are distinguished by their diverse economic structures and vast natural resource wealth.
The data illustrates the effects of the 2008 financial crisis on inflation and per capita GDP over time. In addition, it emphasizes the varied economic circumstances of the countries mentioned, with differing levels of average GDP per capita.
Indicators Visualization
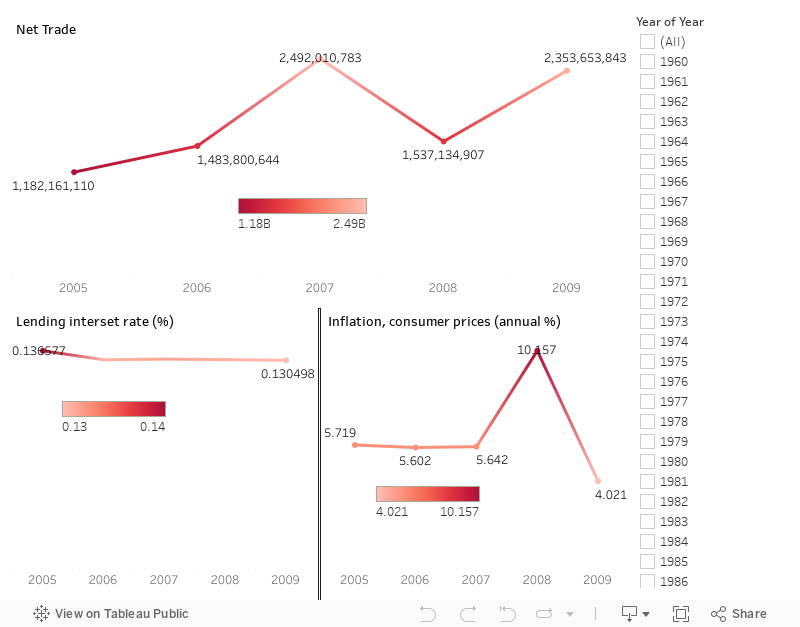
In 2009, the value of net commerce increased to $2,35 Billion, indicating an increase in exports relative to imports. This may have been the result of a shift in external demand or the depreciation of domestic currencies, which has made exports more competitive.
Throughout the crisis years, lending interest rates remained relatively stable, lingering around 0.13 percent. In the midst of the financial turmoil, central banks likely maintained accommodating monetary policies in an effort to maintain liquidity and stimulate borrowing and investment. This stability in lending rates could have been instrumental in bolstering economic activity and consumer access to credit.
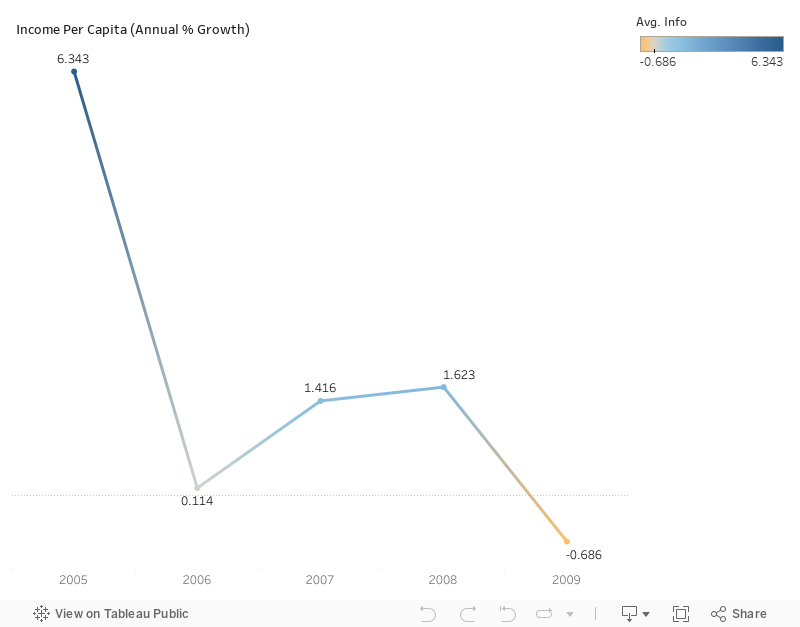
During the crisis, however, inflation rates experienced significant shifts. Inflation soared to 10.16 percent in 2008, reflecting inflationary pressures caused by supply chain disruptions and increased uncertainty arising from the economic crisis. However, inflation rates began to moderate in the years that followed, suggesting that central banks and policymakers may have taken steps to control price pressures and stabilize consumer prices. Moreover, the indicator of income per capita experienced significant fluctuations, reflecting the economic challenges countries confronted during this time. In 2009, the per capita income declined by a significant -0.69%. This decline could be attributed to the crisis’s negative effects, such as employment losses, decreased economic activity, and financial market turmoil.
These indicators illustrate the volatility and complexity of the 2008 financial crisis. The impact of the crisis on net trade, lending interest rates, and inflation highlights the dynamic interplay of economic factors and the difficulties governments and central banks face in managing macroeconomic stability during this difficult period.
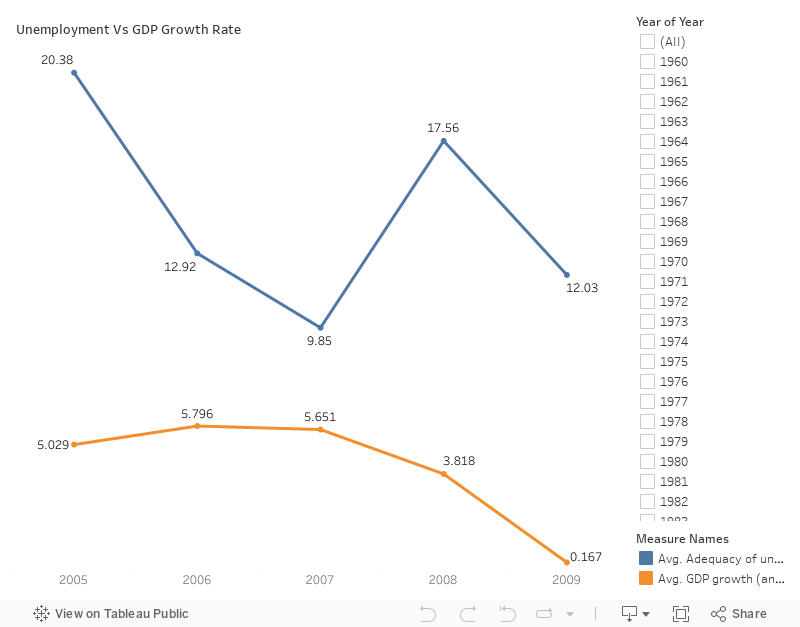
Compared to the average GDP growth rate (3.82%), the adequacy of unemployment benefits and ALMPs (% of total welfare of beneficiary households) was relatively low at 17.56%. This indicates that the assistance provided to unemployed individuals through unemployment benefits and active labor market programs may not have had a significant impact on the overall economic growth during that year.
The Recovery Process
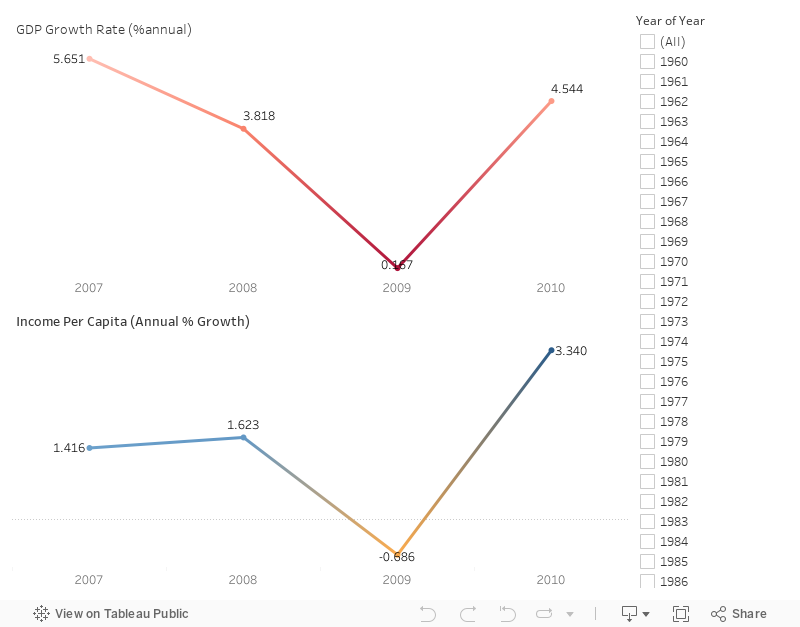
After the 2008 financial crisis, both the GDP growth rate and per capita income showed evidence of economic recovery and improvement in 2010. The GDP growth rate rebounded significantly, reaching 4.54 percent, indicating a robust recovery in economic activity compared to the modest growth rate of 0.17 percent encountered at the height of the recession in 2009. This rebound in GDP growth indicates that the crisis-era policy measures, stimulus packages, and economic reforms had a positive effect on restoring economic stability and stimulating growth.
In 2010, the per capita income also increased at a significant rate, 3.34 percent. This growth indicates an increase in individual incomes and suggests that efforts to promote employment, strengthen social safety nets, and stimulate economic recovery had a positive impact on household incomes. Positive trends in both the GDP growth rate and per capita income in 2010 reflect the resilience of economies and the progress made in overcoming the obstacles posed by the 2008 financial crisis. Despite the fact that the recovery process has been gradual, these indicators point to a positive trajectory of economic development and a path to restoring prosperity in the post-crisis era.