
by Anna Maria | May 6, 2020 | Visualization
Accommodating the Covid-19 Sick Patients within Hospital Beds has been the main challenge worldwide for poor and rich countries alike and for countries with strong healthcare systems and weak healthcare systems alike. Securing these beds is a life or death situation for the Covid-19 critically ill patients who need special intensive care beds. This visulaization will show you the distribution of intensive care patients by country and will show you that the more hospital beds available per 1,000 poulation the lower the Covid-10 mortalility rates.
As per the scatter diagram, countries with higher number of beds per 1,000 population have maintained lower Covid-19 mortality rate even after they went into the peak of Covid-19; best example being Japan with only 4 dead per 1 million population. This is contrasted with England for example which, even prior to reaching the peak of Covid-19, had a high Covid-19 mortality rate of 305 per million. In Japan, there are 13.4 beds per 1000 population whereas in England there are only 2.8 beds per 1000 population.

As per the heat map, we find that Brazil, Iran, Vietnam and Thailand are having the highest percent of critical care patients. Also, this map shows that Lebanon has a 6.53% of critical Covid-19 cases.


by Samar Eid | May 6, 2020 | Dashboard, Visualization
“When you carry a life and it’s there, and then gone, a part of your soul dies. Forever”. Casey Wiegano
Yes, I’m a mom, and just thinking about it for a fraction of a second breaks my heart! Unfortunately, Sub-Saharan countries along with some South Asian countries which are highlighted with darker blue in the map whiteness the highest infant mortality rates. In Sub-Saharan countries ,on average, 68 infants die in every 1000 births and this rate is the second highest among the classified regions (second graph)

From the bottom graphs, we can see that there is a high correlation between the average adolescents fertility rates and the female adolescents who are out of school. On the other hand, a correlation exists between the adolescents fertility rate and the mortality rate of infants.The highest rates are also observed in Sub-Saharan countries (darker blue).
Putting these observations into one sentence, we can infer that the more adolescent females that are out of school the more likely they are to give birth to infants that have higher chances of dying.
As such, female students in Sub-Saharan countries should be empowered. They should be encouraged to continue their education aiming to lower their fertility rates and indirectly lower infants mortality rates. With no doubt, many other factors should be considered such as improving healthcare systems for both, moms and children.
by Khajag Tabakian | May 6, 2020 | Uncategorized
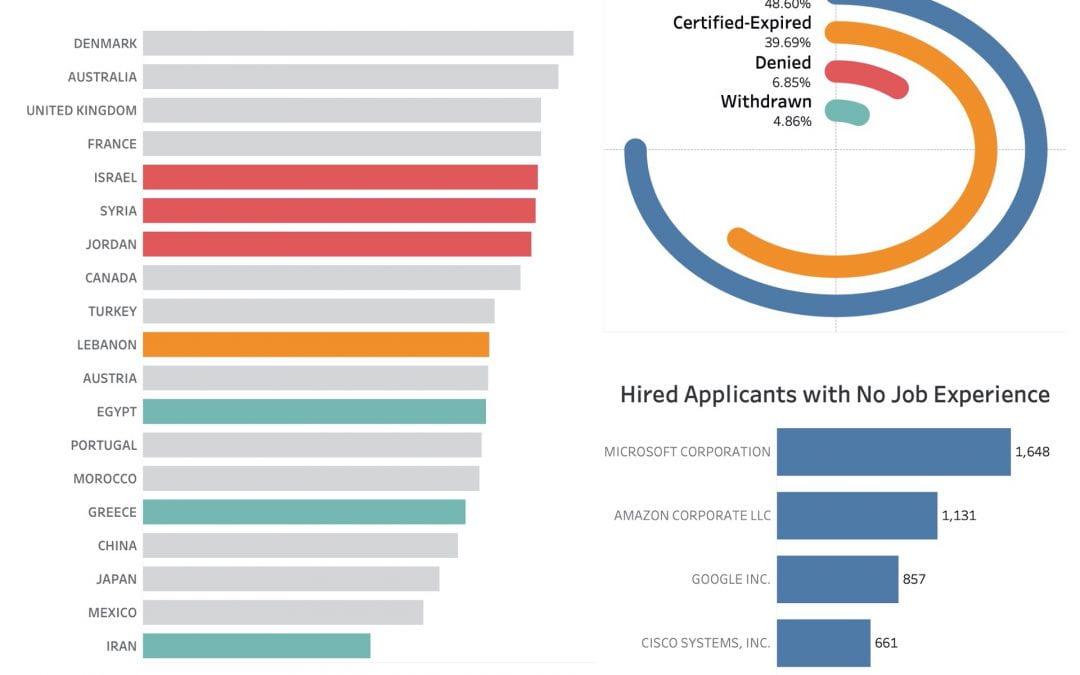
Did you know that applicants from our nearest neighbors like Israel, Syria and Jordan receive higher salary offers from Lebanese applications? On the other hand, Lebanese applicants receive salaries higher than those from Egypt, Greece and Iran.
Did you know that you have 7% chance of having your visa application rejected?
Did you know that giant companies like Microsoft, Amazon or even Google hire fresh graduates who do not have any prior job experience?

by Nour Chaccour | May 6, 2020 | Visualization
In every Lebanese driver, there is a hidden Michael Schumacher inside of him/her. Unfortunately with all NGOs providing all possible resources for the promotion of road safety awareness, car accidents numbers are all the way up. The sad part is that drinking and driving is illegal but do we really abide by this law. When was the last time you called a taxi because you were drunk? And the most important aspect is that car Speed is a competition and a show off.
It was interesting to find through the below dashboard that most car accidents happens during summer season (July and August).
The dataset contains both monthly and yearly statistics of car accidents in Lebanon from 2007 to 2019. This dataset is aggregated by the number of car accidents, the number of injuries, and the number of fatalities.

by Vera Ashkar | May 6, 2020 | Visualization
Think twice before approaching to an animal and especially to a dog, why?
Well.. After reading this you will consider counting to 10 before getting close to a specific breeds of dogs unless you’re ready to get a bite.
Let’s explore the resulted visuals and info we generated using a dataset that includes information on over 9,000 animal bites which occurred in the USA.

We saw that dogs are the most likely to bite human, let’s explore some data about dogs.

One advice, stay away from brown and black PitBul, and don’t play with a black Labrador. You might get a bite and even on your head.