by Rosa Soufan | May 7, 2020 | Dashboard, Visualization
Dear Communities,
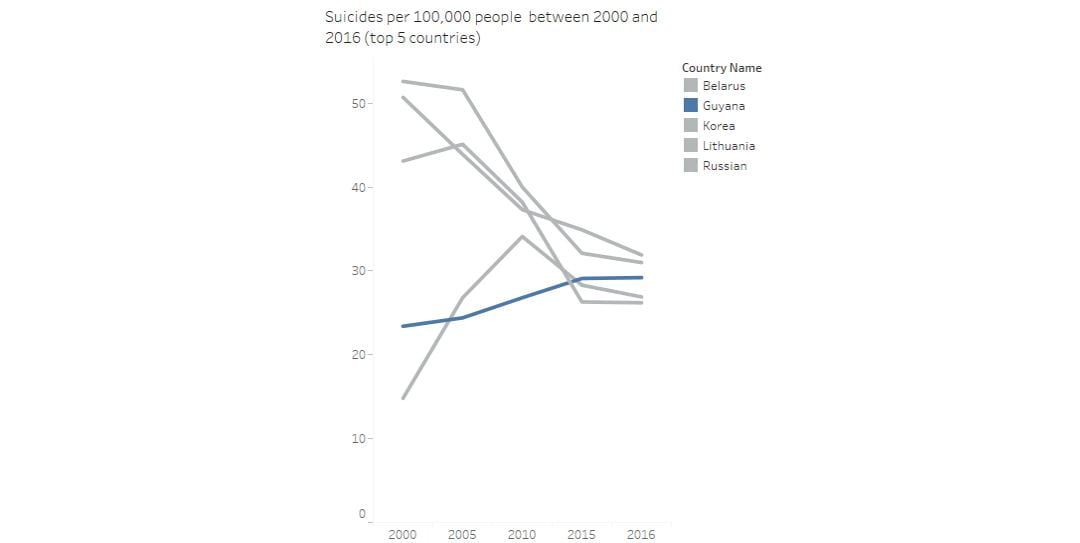
Save Guyana!
Since 2000 Guyana is witnessing an increase in number of suicides. This increase should grab communities attention to work hard on reducing this rate. We have to instill hope again in every home in Guyana.

by Jana Madi | May 7, 2020 | Visualization
Going over UNICEF’s datasets, I noticed that child marriage in Lebanon is very common especially for girls and there are many factors leading to these high percentages. One of the main factors would be that different religions and sects have different minimum age requirements for marriage and the absence of laws. Religious courts regulate most cases and set the minimum age to be fifteen, however, it is worth noting that some girls are forced to get married at ages younger than that.
The below visualization shows the legal marriage age across different religions in Lebanon.

Law enforcement is a major step in decreasing child marriage. Lebanon should develop a national strategy to end child marriage

by Leila Choueiri | May 7, 2020 | Visualization
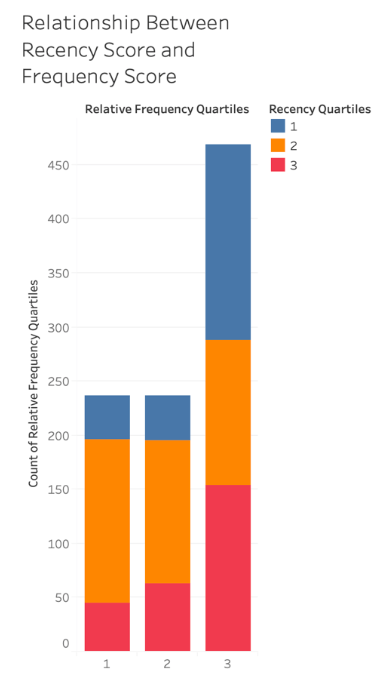
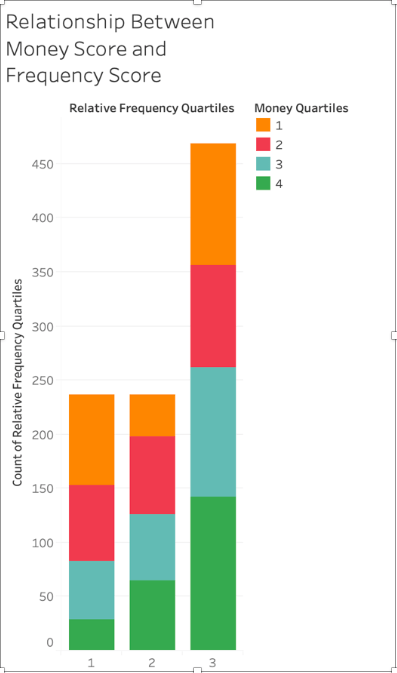
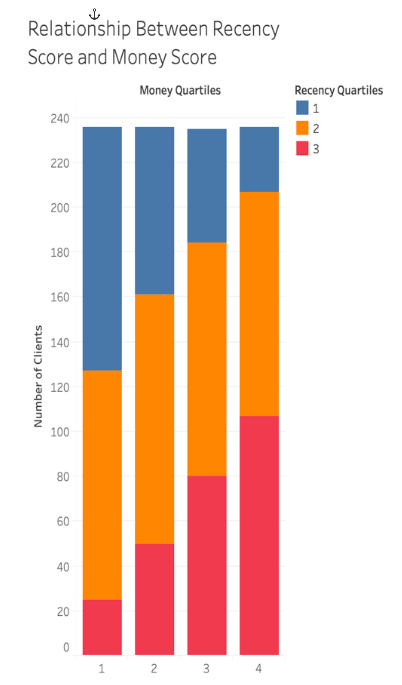
While working on the Sales Call Cycle of a private distributor in Lebanon, we generated the following graph to analyze our clients’ contribution to total revenues. As we observe in the diagram depicting the relationship between the recency score and money score, the clients with higher money scores also have a higher percentage of recency. Those with recency scores of 2, always appear in every money score band. This is probably due to three reasons, in the past year business has not been optimal and only the larger institutions can order consistently, this could also be why this is also the case for why clients with money scores of 3 and 4 most commonly order frequently. The second probable reason is that company keeps a closer eye on larger institutions, so when management realizes that a large client has not ordered in a while, they tend to follow up and get an order. The final reason is that smaller companies tend to run out of business at a much higher rate than their larger counterparts. These businesses might either have ordered once and ran out of work or couldn’t pay their fees on time, and were dropped as a result. For the relationship between recency scores and frequency scores, it makes logical sense that those who have a high frequency have a higher probability of being more frequent. The amount of low recency and high frequency clients that exist is cause for concern. These are frequent clients that haven’t ordered in a while, so there is something unusual about their behavior. For this reason, the company allocated a new sales call cycle to trigger those businesses.

by Jana Madi | May 7, 2020 | Visualization
Further to inspecting the World Development Index datasets on Tableau, I was surprised by the proportion of women subject to violence in the world. Although many NGOs and organizations are working very hard on achieving equality between men and women, violence against women is still an issue that is sometimes neglected. Digging deeper into the indicators, I noticed that the proportion of violence against women is higher in countries that have no legislation to protect women or don’t abide by the existing laws.

As we can see from the below visualization, countries that enforced laws to protect against women violence had a major decrease in the proportion of violence

It is very important to increase awareness of the causes and consequences of violence and build capacity of partners to prevent and respond to violence. Moreover; we should work on promoting the need for changing norms and behavior and advocating for gender equality and women’s rights.

by Sara Dabbous | May 7, 2020 | Dashboard, Visualization
Since I started working in the healthcare sector I’ve always been interested in knowing more about this industry. As such, while exploring the WDI Data I studied several healthcare indicators and it turns out – Lebanon is doing better than we thought! I was intrigued to know what’s beyond those indicators, and luckily I found a detailed dataset about Primary Health Care Centers in Lebanon on The Humanitarian Data Exchange, I was surprised to know we had this many centers.
Could this visualization be a sign of a sound healthcare system ?
Did this awareness in healthcare aid us in containing the Covid-19?
Do you think there is a better future for the healthcare system for Lebanon, or will it be worst?
Personally, I am optimistic..
So here are some things I didn’t know:
- There are 174 Operational Primary Healthcare Centers in Lebanon
- There are 25 PHC funded by UNHCR
- There are 100 PHC that provide subsidized services.
- Nabatieh has 0 operational PHCs.
- The North governorate has the highest number of operational PHC: 36

In this dashboard, I prepared – using Tableau – a map that shows the different Operational PHC locations in Lebanon filtered by UNHCR Funding. Alongside it, is a bar chart showing the percentage of operational PHC in each Governorate. Finally, at the bottom, you can find a stacked bar chart representing the number of operational PHC per governorate, highlighting those who offer subsidized services.