Data Visualization

Blog of the Data Visualization & Communication Course at OSB-AUB

This is my favorite part about analytics: Taking boring flat data and bringing it to life through visualization” John Tukey

Towards a Peaceful Strong World: Homocides and the Quest for Global Justice

Towards a Peaceful Strong World: Homocides and the Quest for Global Justice

A world we all aim for

In the pursuit of a world marked by Peace, Justice, and Strong Institutions (SDG 16), there exists a formidable challenge that casts a shadow on our collective journey: intentional homicides. As nations strive for equilibrium and progress, this rising tide of violence threatens to disrupt the delicate balance sought under SDG 16, unraveling the fabric of our communities and hindering the path to justice.

The Unsettled World

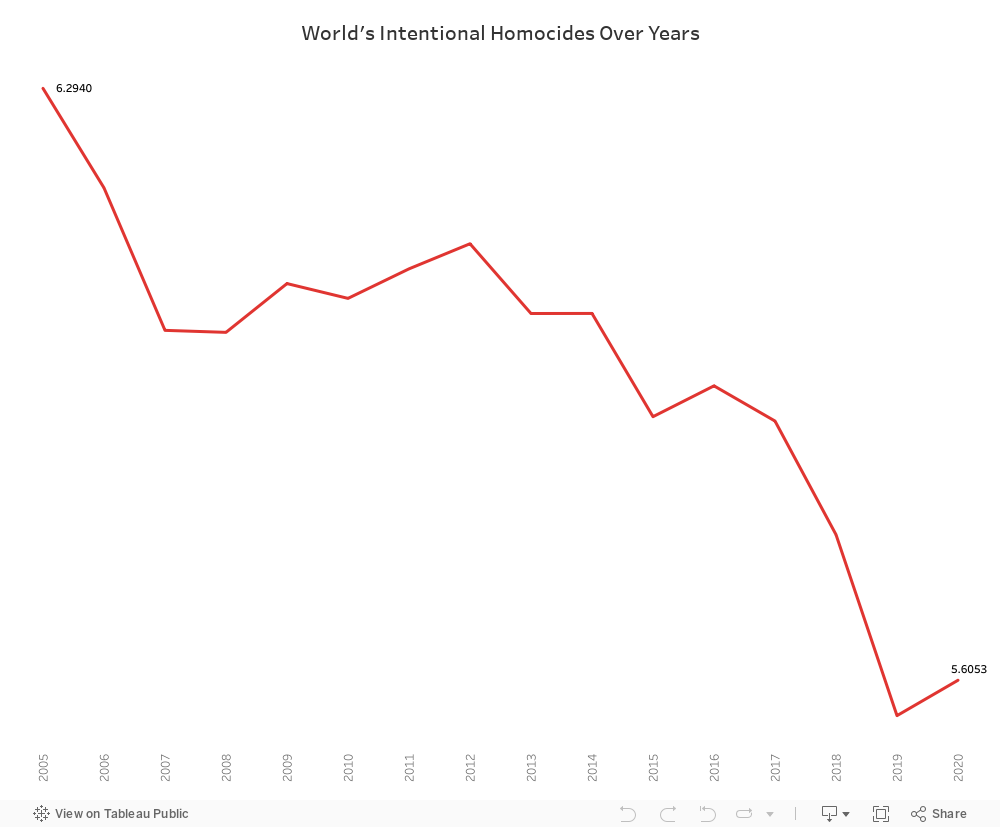
Intentional homicides not only claim lives but shatter communities, leaving a trail of grief and despair in their wake. The impact reverberates beyond the immediate loss, affecting the very foundations of sustainable development. As we stand at the intersection of a quest for global justice, intentional homicides emerge as a stark reminder of the work yet to be done.

A Sign of Change

The CPIA (Country Policy and Institutional Assessment) Public Sector Management and Institutions cluster average provides an assessment of a country’s public sector quality, including aspects of governance and institutional strength. While this assessment doesn’t directly address homicides, improvements in public sector management and institutions can have indirect effects on reducing crime and promoting stability.

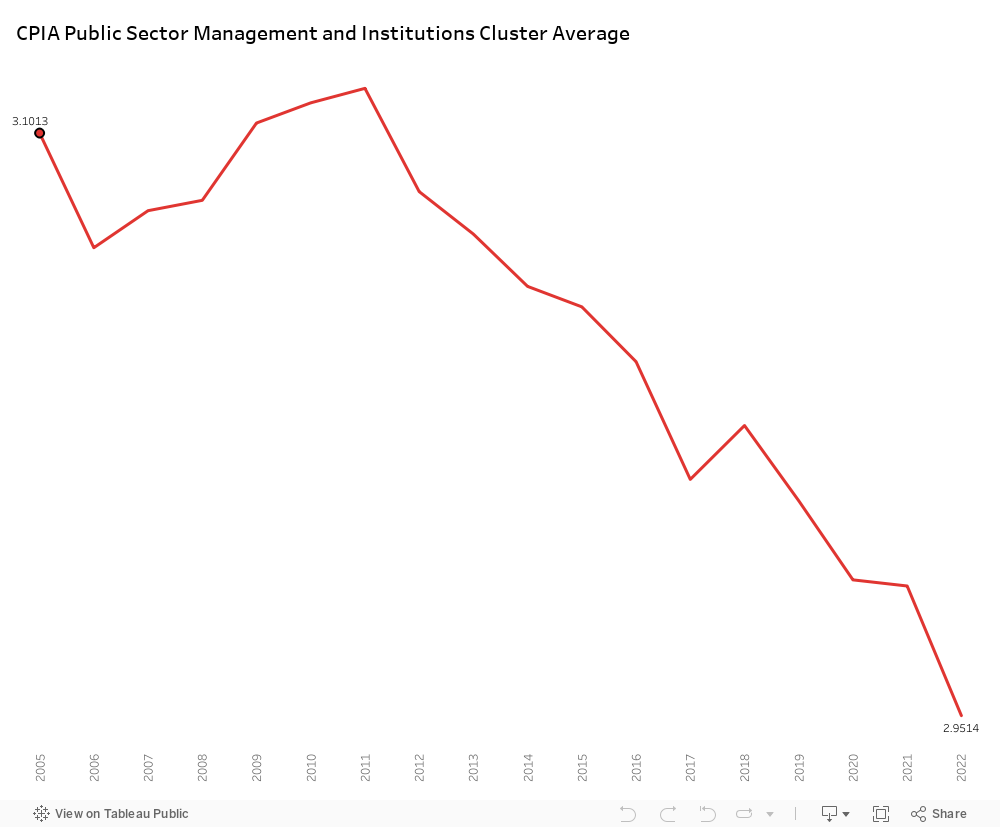
Countries with higher CPIA Public Sector Management and Institutions cluster average scores are likely to have more effective governance, transparent institutions, and better public administration. Such improvements can contribute to a stable environment, potentially discouraging criminal activities, including homicides. Strengthened institutions often lead to better law enforcement, judicial systems, and crime prevention strategies, indirectly impacting public safety.

Bold Steps

It’s our turn to help in implementing SDG 16. Let’s start drawing the peaceful world we always dreamed of by:

  1. Advocating for Policy Reforms: Encourage comprehensive policy reforms that prioritize enhancing public sector management for increased transparency and responsiveness.
  2. Promoting Anti-Corruption Measures: Emphasize the importance of anti-corruption measures within public institutions to ensure integrity and accountability.
  3. Investing in Judicial and Legal Reforms: Support initiatives aimed at improving judicial and legal systems for fair and efficient justice.
  4. Empowering Local Communities: Foster community engagement in decision-making processes, empowering citizens to actively participate in governance.
  5. Championing Transparency with Open Data: Advocate for transparency through open data initiatives, making government data accessible for public scrutiny.
  6. Enhancing Education and Training: Invest in education and training programs for public servants to elevate their skills and knowledge.
  7. Encouraging Collaboration: Promote collaboration between government, civil society, and the private sector to address shared governance challenges.
  8. Raising Public Awareness: Launch public awareness campaigns to inform citizens about the importance of strong institutions in ensuring justice and maintaining peace.


Government Health Expenditure on Life Expectancy

Government Health Expenditure on Life Expectancy

The most important statistic for measuring population health is life expectancy. Life expectancy captures mortality across the whole life course, making it more comprehensive than the restricted measure of newborn and child mortality, which concentrates only on mortality at a young age. It provides information on the typical death age for a population.

Since the Age of Enlightenment, life expectancy has rapidly grown. Life expectancy began to rise in the early industrialized nations in the 19th century, but it remained low in the rest of the world. As a result, there was a huge disparity in the distribution of health throughout the world. Good health in the wealthy nations and continuously poor health in the developing nations. This worldwide inequality has declined during the last few decades. The nations with the highest life expectancy in 1800 are the only ones in the world with a lower life expectancy today. Many nations that were formerly afflicted by poor health are quickly catching up.

The world map below shows the life expectancy of the year 2000.

African nations have been struggling with health related issues for quite some time. One of them is that, when compared to other continents, such as Europe Africa has the nations with the lowest life expectancies. Why is that? Does government health expenditure play a big role disaster?

Government health expenditure plays an important role in guaranteeing people’s livelihood and in improving the quality of human capital, and it also plays an important role in affecting economic development.

In order to characterize the specific trend of government health spending affecting life expectancy in Africa, the dashboard below chart shows the expenditure in healthy sectors by the government, from years 2000 to 2018, of the top 3 countries (in terms of life expectancy) and the bottom 3 in comparison as shown in the map.

We clearly see that countries with high government expenditure have a higher life expectancy.

Even though African nations still have a low life expectancy in comparison to other countries, significant improvement has been made since the early 2000s as life expectancy within African nations has seen an increase of at least 10 years.This shows a positive relationship between government health expenditure and life expectancy.

What we can do to further help and develop Africa is to create a funded project by the UN or the WHO to help create more hospitals in the region that would be specialized in treating and aiding people with diseases.

Problem with CO2 Emissions in the Arab World

Problem with CO2 Emissions in the Arab World


Meet Ahmad 

Ahmad is a young and healthy adult who likes to engage in various sports. However, he suffers from severe cases of asthma and regularly takes prescribed medications along with his inhaler. Like many people his age, Ahmad is very ambitious about his future and hopes one day that he can become a world star athlete.

Unfortunately, Ahmad is living in Qatar which is known to have a very harsh environment that is filled with air pollution and CO2 emissions that can risk his healthcare and well being.

Let’s Examine what Ahmad is up against!

The following Visual  is a Bar Chart displaying  the average CO2 emissions (metric tons per capita) in Arab countries

Observations

Ahmad was simply shocked!!

Although Ahmad knew that Qatar had very high levels of air pollution, he was not excepting it to be the highest among all other Arab countries. Ahmad had to act fast and think about ways to convince his parents to finance his journey to a cleaner country with low levels of greenhouse gas emissions. However, the previous graph was not entirely convincing for his father since he wanted to have a more visual understanding of the countries.

A better Visual? 

The following Visual  is the same visual presented before but projected on the map of the Arab World

Before Deciding

Although it seemed Obvious for Ahmad to travel to any of the countries that had low levels of C02 emissions, Ahmad’s Father wanted his son to have a good future prospect. The father demanded to know which of these countries had low levels of unemployment. After a lot of hard work, Ahmad was able to come up with a great visual that explains exactly what his father wants.

Now That’s Clearer

The following Visual is a Stacked Bar chart displaying the average CO2 emissions (metric tons per capita) and % of unemployment in Arab countries

Problem Solution

Potential Solutions Solution Validation Recommendation
For Better Future: Convince Ahmad’s father to finance his travel to Saudi Arabia it has less CO2 levels (12.62) with slightly higher unemployment rate (5.58%) Try Exploring other Non-Arab Countries that meet Ahmad’s requirement
For Better Health: Convince Ahmad’s father to finance his travel to Lebanon it has significantly less CO2 levels (2.96) but a higher unemployment rate (8.63%) If to stay in Qatar for guaranteed employment, Ahmad should drastically change his lifestyle and become more health cautious


Conclusion

Ahmad has choices There is no “perfect” solution for Ahmad’s Situation but he has a few options to explore. The problem in our Arab World is that we are (in most cases) required to sacrifice important aspects of our lives to improve other aspects. This dilemma is affecting so many people across the Arab World, especially during these hard times.

Insights on Suicide around the World

Insights on Suicide around the World

The below graphs show the variation in number of suicides with respect to sex,age,GDP per capita and countries.

Males commit suicide more than females!

Most who commit suicide their age between 23-34.

Suicide number increase as GDP per capita increase !