“Hiring and promoting talented women is the right thing to do for society, and its economic imperatives.” Carlos Ghosn
Despite the economic and technological development, gender equality remains a topic of debate and the patriarchy still poses obstacles against women development and leadership. What if we can prove that promoting and sustaining an equality between genders results in high return on investment and creates an opportunity of economic expansion especially in developed as well as emergent nations?
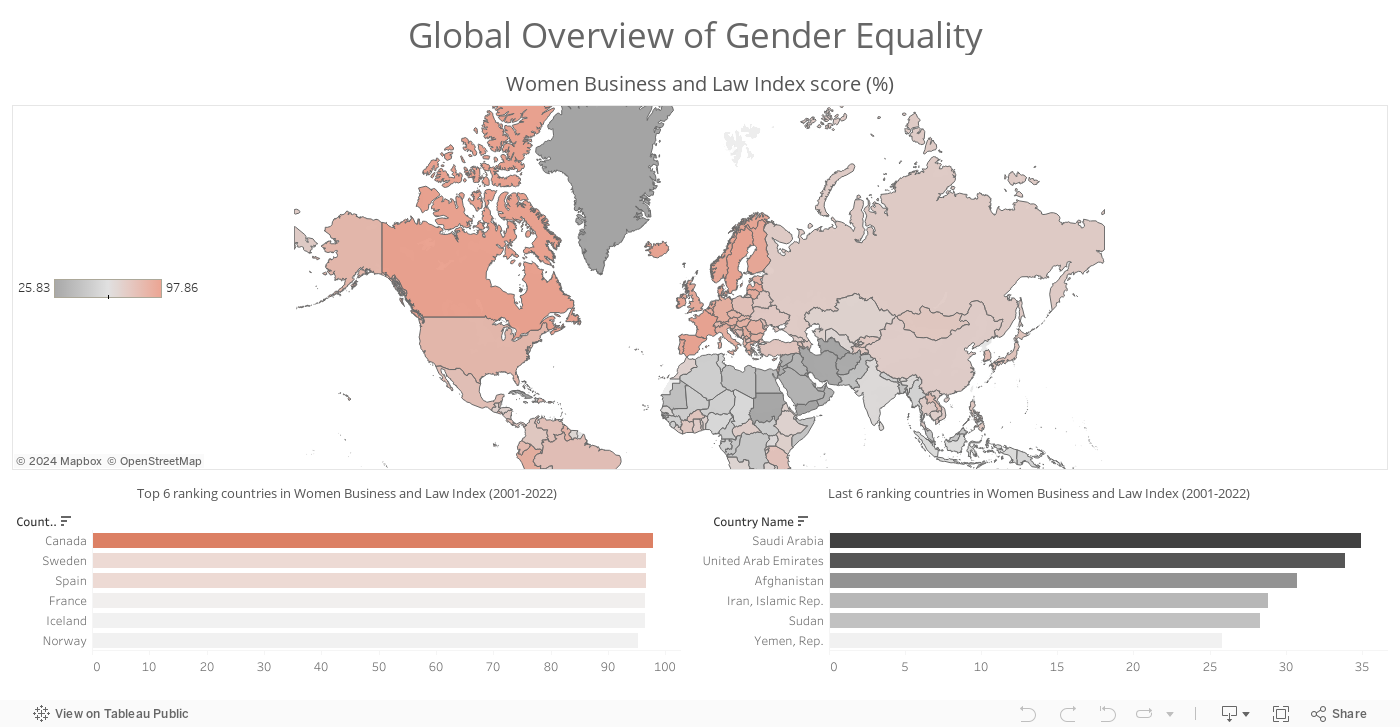
The united nations created the Women Business and Law Index that assesses the performance of each country in tightening the gender gap through businesses, laws, and female integration.
Canada ranks first globally with an overall score of 97.8% indicating the successful effort the country is making towards gender parity and the high degree of female contribution to the business world. On the other hand, 4 Arab countries rank last, with United Arab Emirates interestingly being one of them with an overall score of 33.8%.
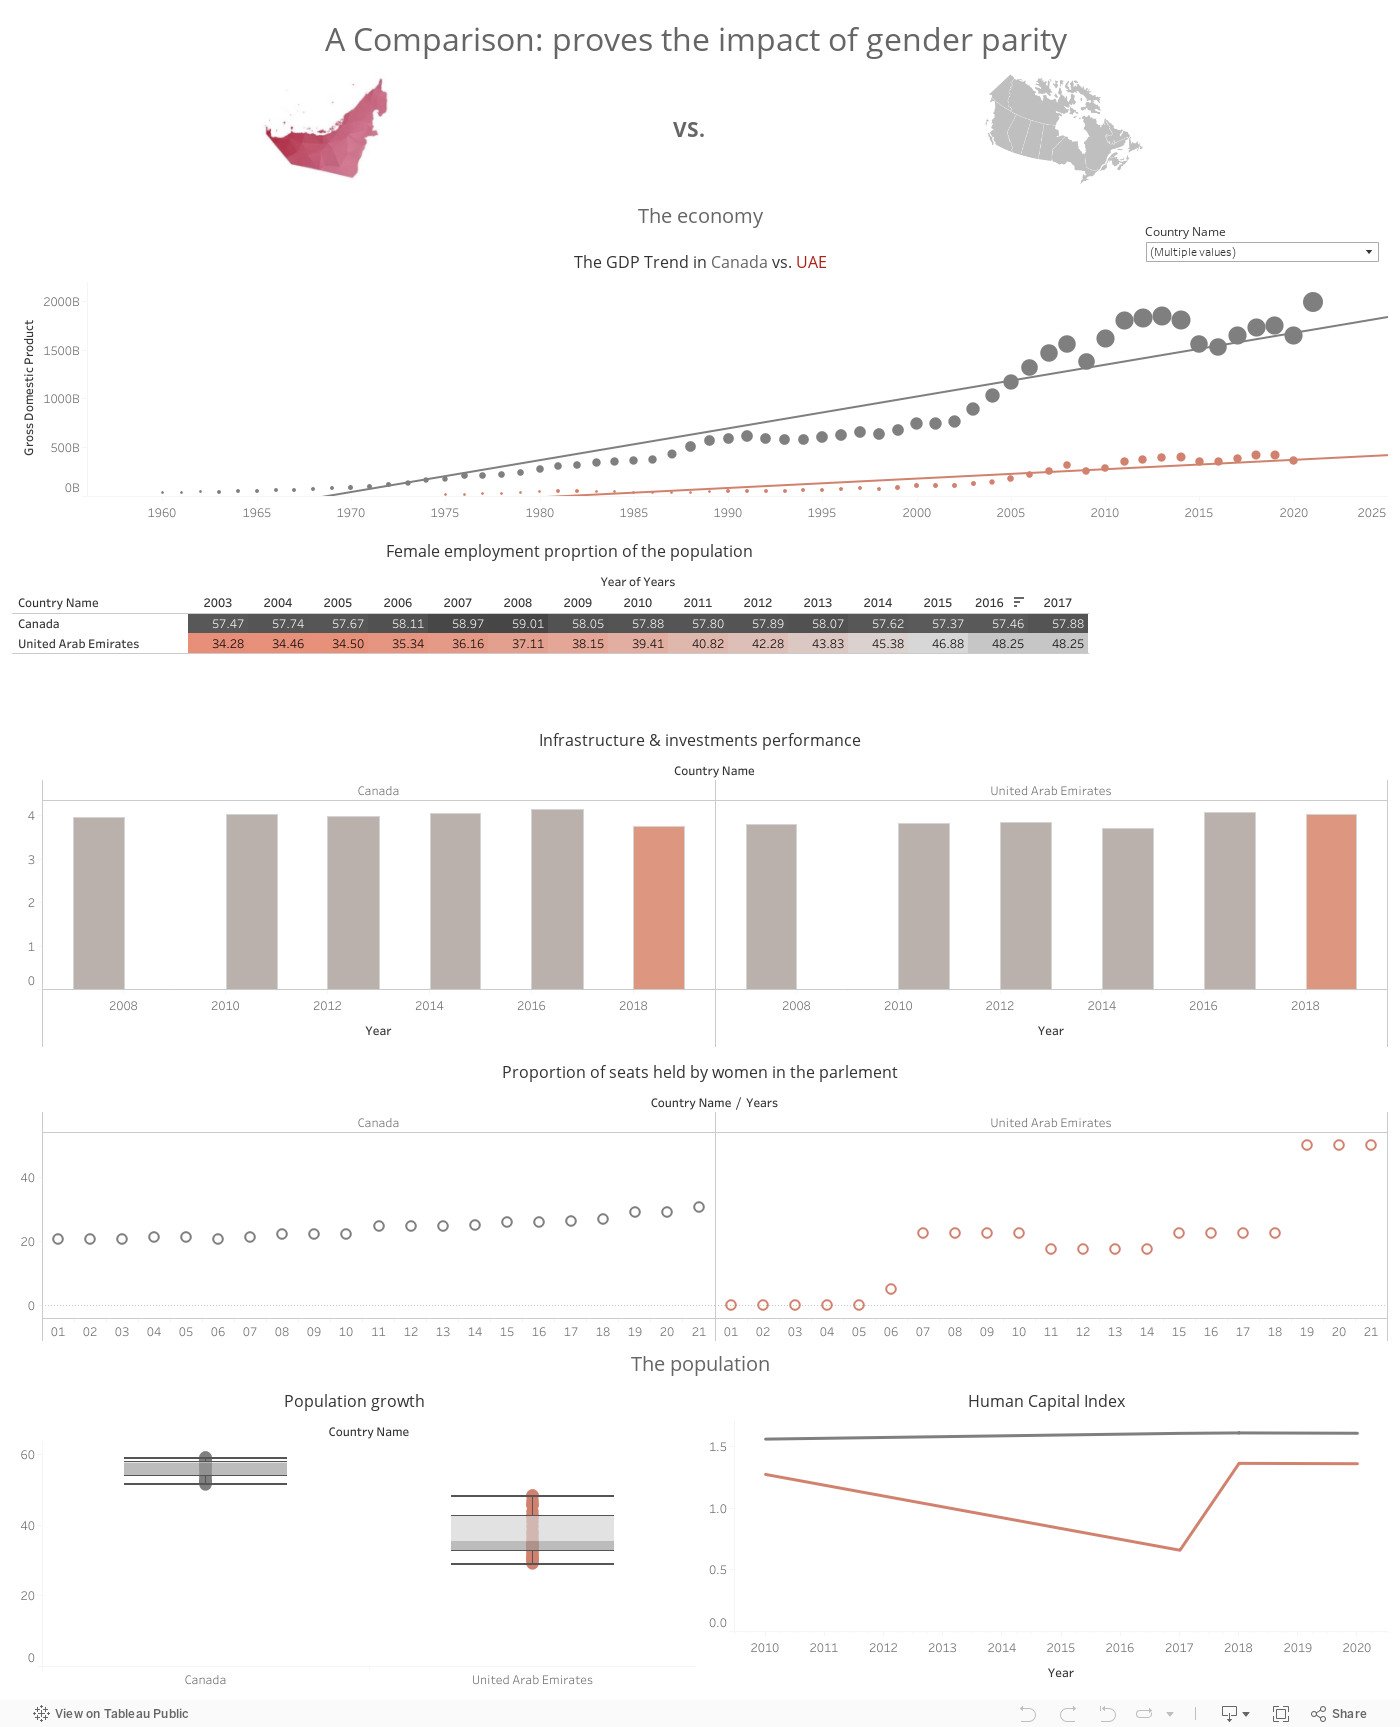
To understand the implications of the difference of gender gap on the country’s development, we will compare Canada to the UAE on different levels.
Canada, with the higher WBL index, has a higher economic growth compared to UAE. However, UAE, which ranks last, has much more developed infrastructure and better investment performance than Canada. Thus, there must be some other factors affecting the GDP Growth.
Between 2003 and 2016, UAE’s GDP had a noticeable increase of 170% parallel to an increase in female employment percentage of 14%.
Similarly, between 2010 and 2019, Canada’s GDP also had increased remarkably, parallel to a 10% increase in the proportion of female leaders in the parliament.
On the level of the population, Canada has a higher and healthier population growth compared to UAE, as well as Human Capital Index.
Thus, gender parity is more than giving rights to women; it is a critical factor to a healthy and sustainable economic growth. It is crucial to focus the efforts towards equality in order reach a holistic success especially for the underdeveloped countries.
To achieve gender parity, nations should:
Relax the restrictions on women’s time and schedule
Eliminate the legal and organizational barriers (Glass Ceiling) to women’s economic and political leadership
Promote the entrepreneurship and self-employment among young females
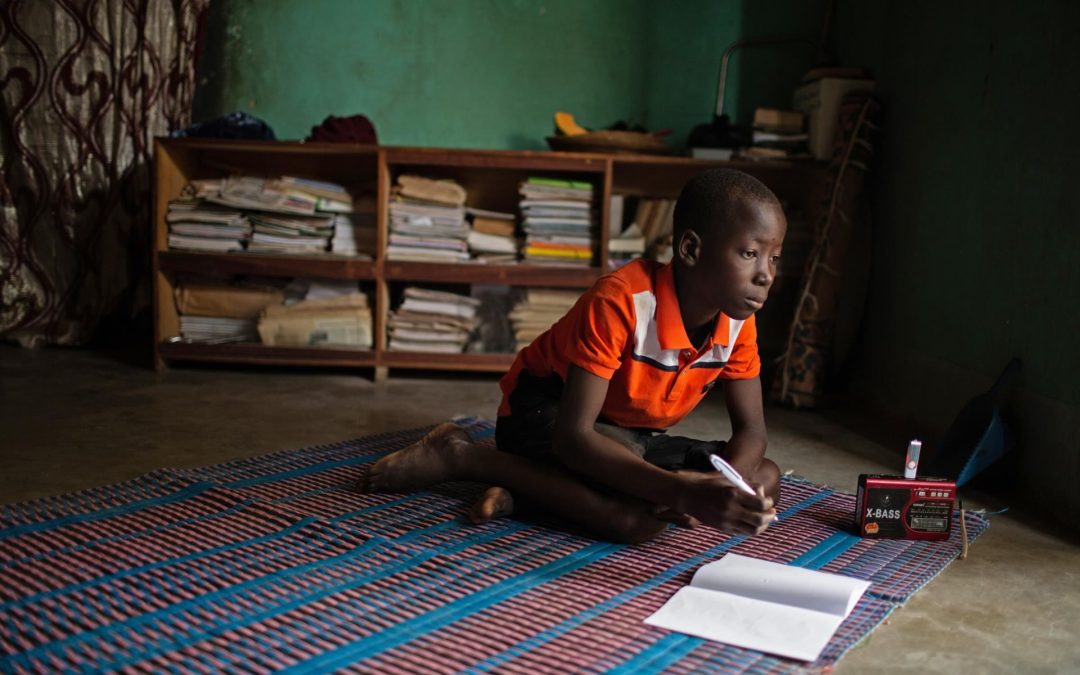
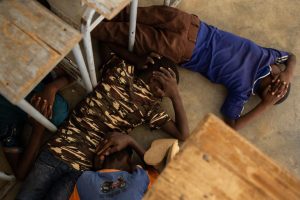
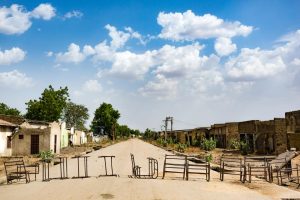
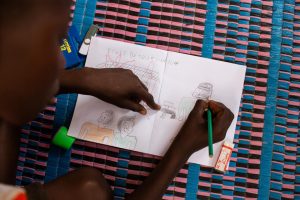
Hussaini, 14, is one of the lucky ones. He escaped. In 2018, as terrorism by extremist groups crossed into Burkina Faso, his village was attacked while he was in school. First, he heard screaming, and then gunfire. “They shot at our teachers and killed one of them,” he says. “They burned down the classrooms.” Hussaini ran home and within a matter of minutes, his family set off. They left everything behind, including school. Since that day, Hussaini has not set foot in a classroom. “I used to love school, to read, to count and to play during recess,” he says. “It’s been a year since I last went…”
From the end of 2017 to 2019, the number of schools forced to close due to rising insecurity tripled. More than 9,200 schools closed across Burkina Faso, Cameroon, and others, leaving 1.9 million children without education. These children face a much higher risk of recruitment by armed groups, gender-based violence and targeting by traffickers. Most parents in Africa will tell you that their children’s education is the most important investment they can make.
Trouble Cycle
Education is the UN’s top priority because it is a basic human right and the foundation on which to build peace and drive sustainable development. Unfortunately, lack of education for the young generation remains highly present in the world.
The problem is a cycle: lack of education results in high child labor and low literacy rate thus increasing the world’s problems such as crimes. And in its turn, terrorism decreases education opportunities. Hussaini is among millions of other children that were deprived from quality education and had high chances to be part of child labor.
Evidence
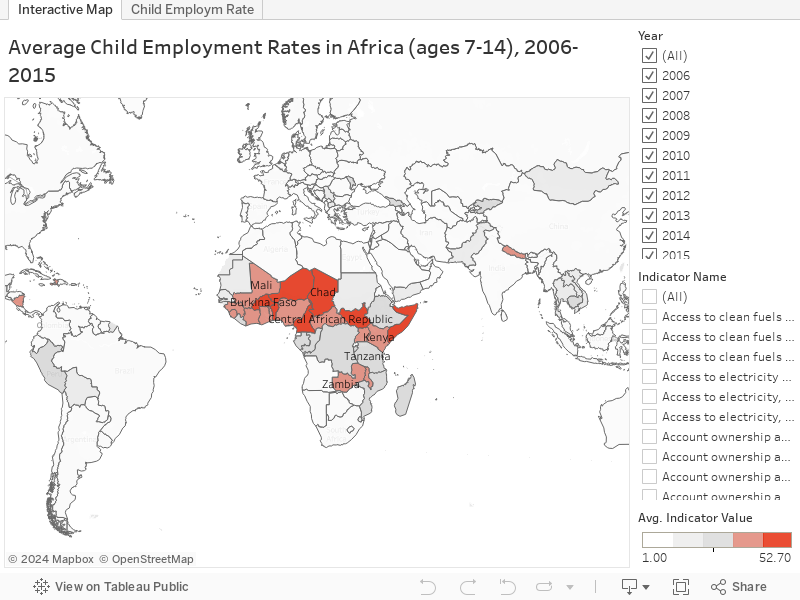
Poor basic education can be identified by high child employment rate. So, what are the target continent and countries?
The map shows that the Average Child Employment Rates (ages 7-14) is highest in Africa.
Having a deeper look, Cameroon ranks first for having the highest average child employment rate of 52.7% for years 2006-2015, followed by Niger, Benin, and Burkina Faso.
Referring to the UN’s Sustainable Development Goal number 4:
What if kids will get exposed to education in early stage?
Can we influence their perception?
Fulfilling the Dream
Education cannot wait, and our world had enough. It is time to increase the number of education programs targeting young generation, and specifically African countries as previously mentioned, with Cameroon being a major target.
Creating education programs would:
Have education camps with volunteering and non volunteering teachers all around the world
Use workshops and fun trainings to later voluntarily engage kids
Involve underdeveloped countries in globalization
Introduce the diversity of cultures
Work on making education a need and will for every kid and parent- representing a lasting impact environment
Many past programs were successfully implemented in Cameroon such as Open Dreams, which already funded more than 200 scholarships and mentored more than 1000 students.
Is it Time?
Targeting Cameroon, and implementing it as a first stage project, would be a start to then expand into other countries.
Finally, from another perspective, how about looking at equalizing educational opportunities as a solution to many other issues? and working on SDG 4 for quality education will strongly and positively affect other goals such as ending poverty and hunger?
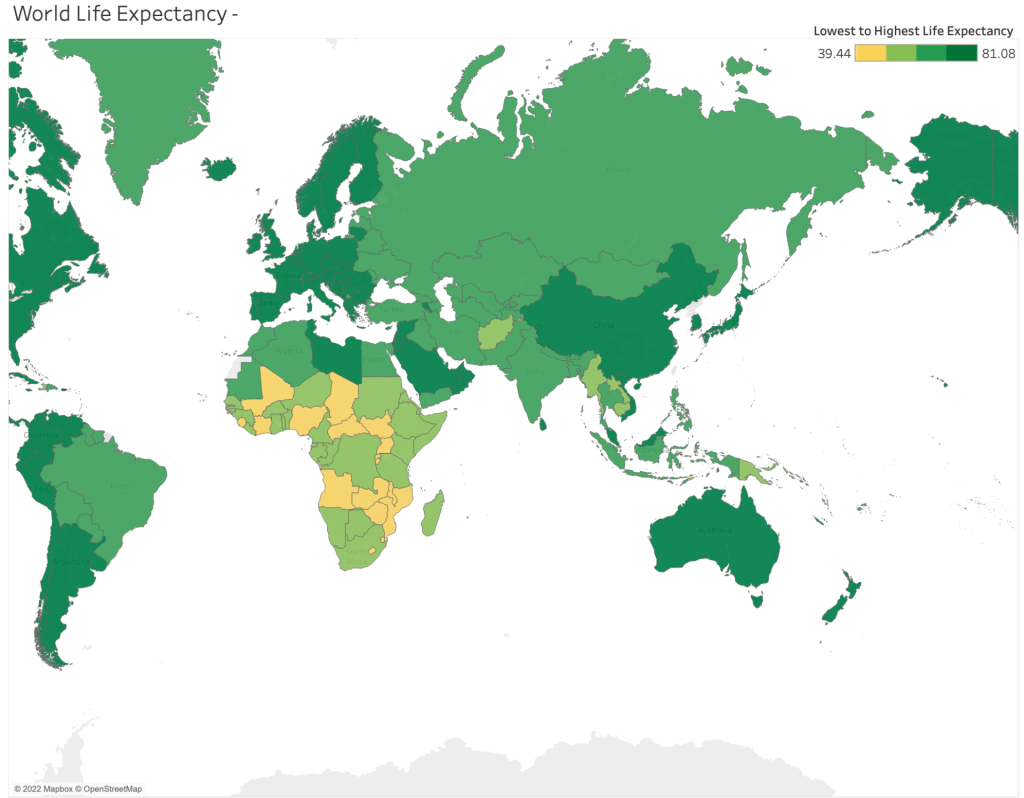
The most important statistic for measuring population health is life expectancy. Life expectancy captures mortality across the whole life course, making it more comprehensive than the restricted measure of newborn and child mortality, which concentrates only on mortality at a young age. It provides information on the typical death age for a population.
Since the Age of Enlightenment, life expectancy has rapidly grown. Life expectancy began to rise in the early industrialized nations in the 19th century, but it remained low in the rest of the world. As a result, there was a huge disparity in the distribution of health throughout the world. Good health in the wealthy nations and continuously poor health in the developing nations. This worldwide inequality has declined during the last few decades. The nations with the highest life expectancy in 1800 are the only ones in the world with a lower life expectancy today. Many nations that were formerly afflicted by poor health are quickly catching up.
The world map below shows the life expectancy of the year 2000.
African nations have been struggling with health related issues for quite some time. One of them is that, when compared to other continents, such as Europe Africa has the nations with the lowest life expectancies. Why is that? Does government health expenditure play a big role disaster?
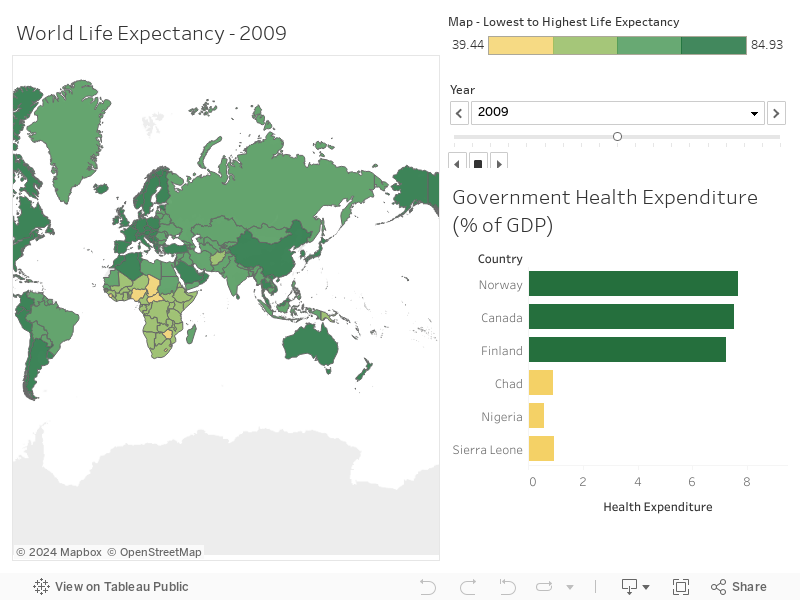
Government health expenditure plays an important role in guaranteeing people’s livelihood and in improving the quality of human capital, and it also plays an important role in affecting economic development.
In order to characterize the specific trend of government health spending affecting life expectancy in Africa, the dashboard below chart shows the expenditure in healthy sectors by the government, from years 2000 to 2018, of the top 3 countries (in terms of life expectancy) and the bottom 3 in comparison as shown in the map.
We clearly see that countries with high government expenditure have a higher life expectancy.
Even though African nations still have a low life expectancy in comparison to other countries, significant improvement has been made since the early 2000s as life expectancy within African nations has seen an increase of at least 10 years.This shows a positive relationship between government health expenditure and life expectancy.
What we can do to further help and develop Africa is to create a funded project by the UN or the WHO to help create more hospitals in the region that would be specialized in treating and aiding people with diseases.
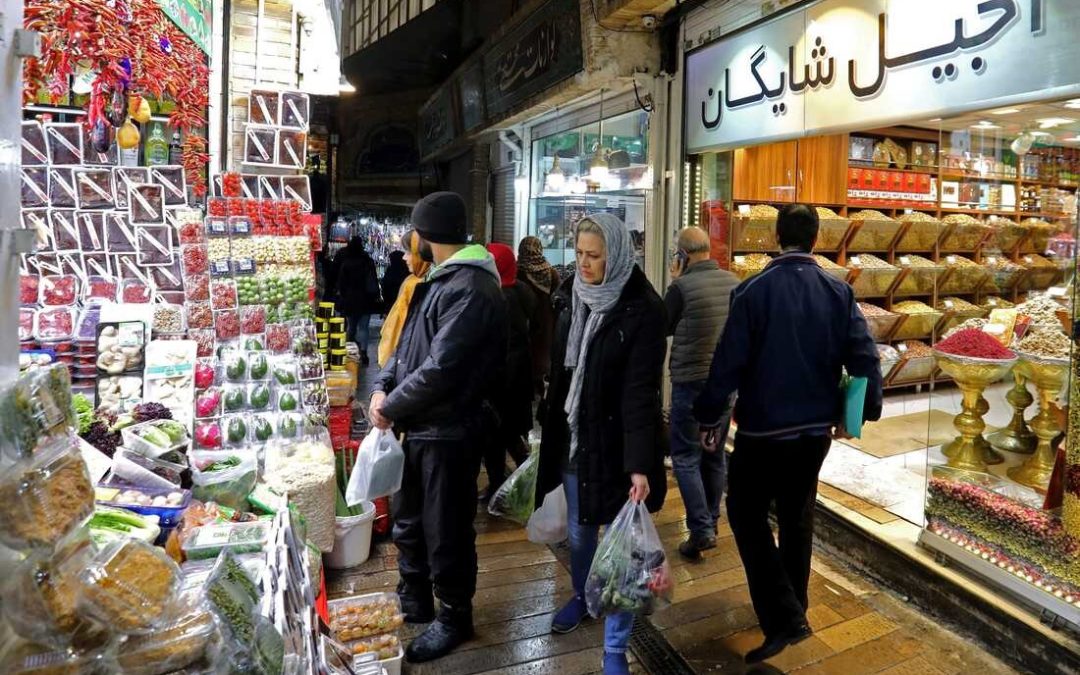
2018-2019 have been of the worst years for the Iranian people where Iran has witnessed compounded crises such as inflation, brain drain, poverty, unemployment, and inequality.
As a result, I have exploited the World Bank’s World Development Indicatorsand I have identified several indicators to measure the impact of the economic crisis in Iran between in 2018. For instance, Items that cost 5000 Rial in 2017 cost almost more than 250000 in 2018.
I will also try to discuss two potential measures that could mitigate its severe economic crisis.
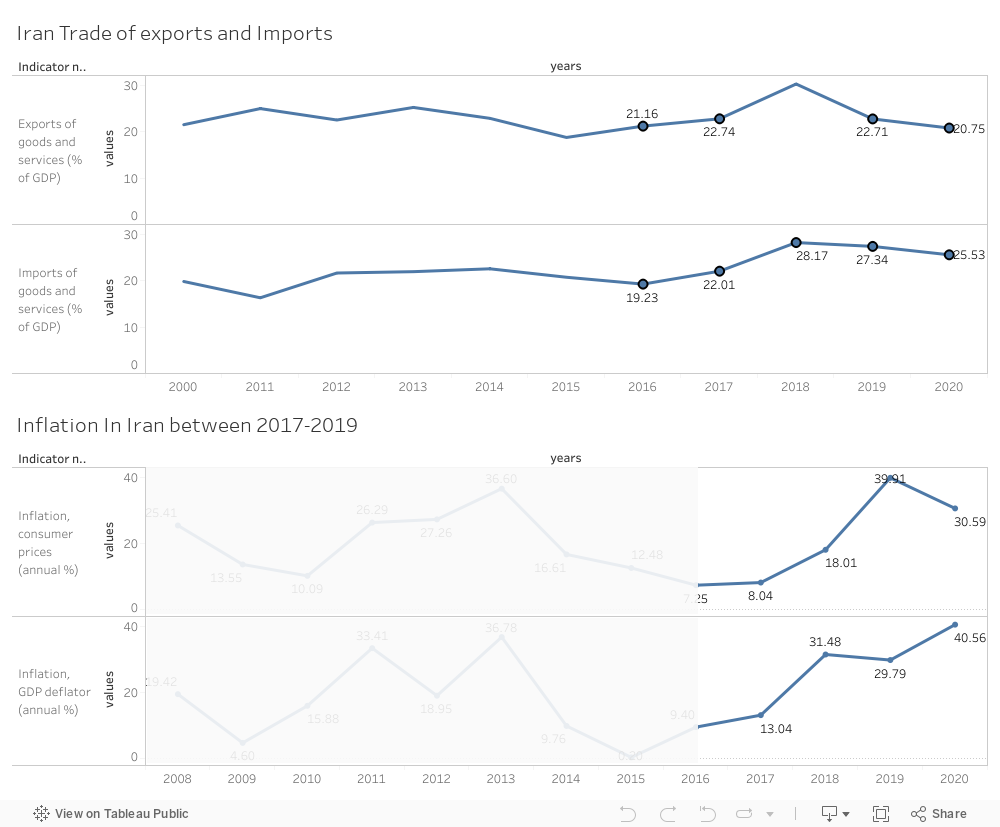
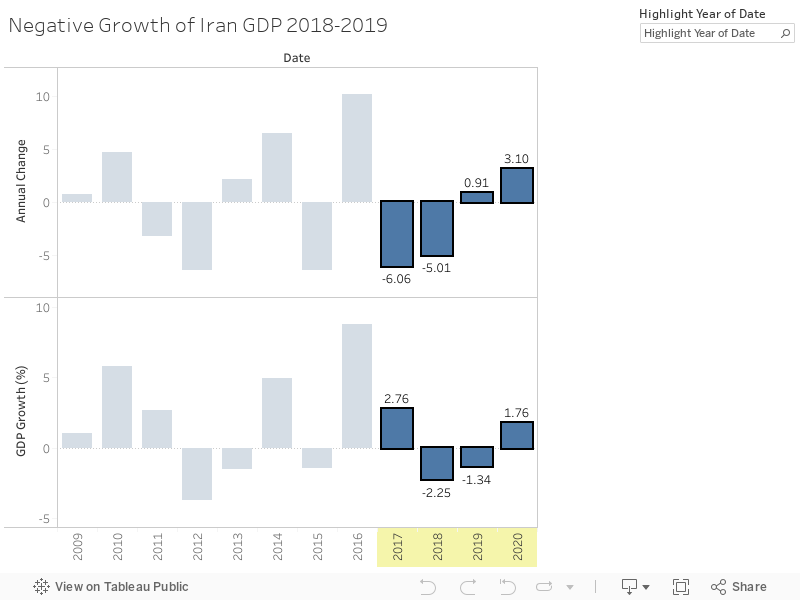
The following graphs reflect the severity of the Iranian collapse. These graphs plotted in the dashboard were based on the UN World Indicators dataset.
What happened in Iran was against the SDG 8.1.1 to Sustain per capita economic growth in accordance with national circumstances and, in particular, at least 7 per cent gross domestic product growth per annum in the least developed countries and SDG 8.6 By 2020, substantially reduce the proportion of youth not in employment, education or training
External shocks, including sanctions and commodity price volatility, caused a long ecumenic stagnation. I will shed light on indicators that shows the Iranian economy collapse, starting with the Gross Domestic Product GDP per capita in US dollars used to assess the economic prosperity over time, before and after the crisis.
Also, the large contraction in oil exports placed significant pressure on government finances and drove inflation to over 40 %for four consecutive years. Weaker global demand and competitions discounted oil exports to China are expected to moderate Iran’s oil sector expansion. Domestic demand will also be affected by the negative impact of high inflation on consumption and investments
Sustained high inflation led to a substantial reduction in households’ purchasing power. The economic crisis has hit Iran’s youth particularly hard, especially those from lower economic backgrounds because the country’s rigid formal labor market preserves jobs for older workers. At the same time, job creation was insufficient to absorb the large pool of young and educated entrants to the labor market.
While relatively diversified for an oil exporting country, economic activity and government revenues still rely on oil revenues and have, therefore, been volatile.
I would recommend investing in the internal consumer market growth:
After the sanction, Iran was obliged to increase its imports due to the hardness of getting raw material for production and consumption especially for merchandizing and consumer goods. Thus, we recommend that Iran invest in its internal development of consumer good market.
To support this solution,
It has great supply of Petroleum, natural gas, and coal and oil for facilitating the trade and production
rapid changes to meet the increasing domestic demand for authentic, high-quality imported goods, including electronics, telecom products and parts, clothing..
Already high-end brands and middle-income brands are coming to invest
Iran is a substantial market of 80 million consumers with a growing and well-educated middle class
Because of the country’s unique geographical and strategic location, Iran is also the entry-point to other upcoming regional markets in the Middle East and Central Asia with equally high demands for foreign investments and trade.
The consumer goods market in Iran has also long thrived off the internal distribution networks
Tehran is a key transport hub, with several terminals set up around the capital connecting it to most major cities.
A good time for international companies to manufacture consumer goods in Iran for export across the region, which is helped by the fact that full foreign company ownership is permitted in Iranian law.
MGI’s 2016 Iran report predicted that the fast-moving consumer goods sector alone would create an additional 850,000 jobs by 2035
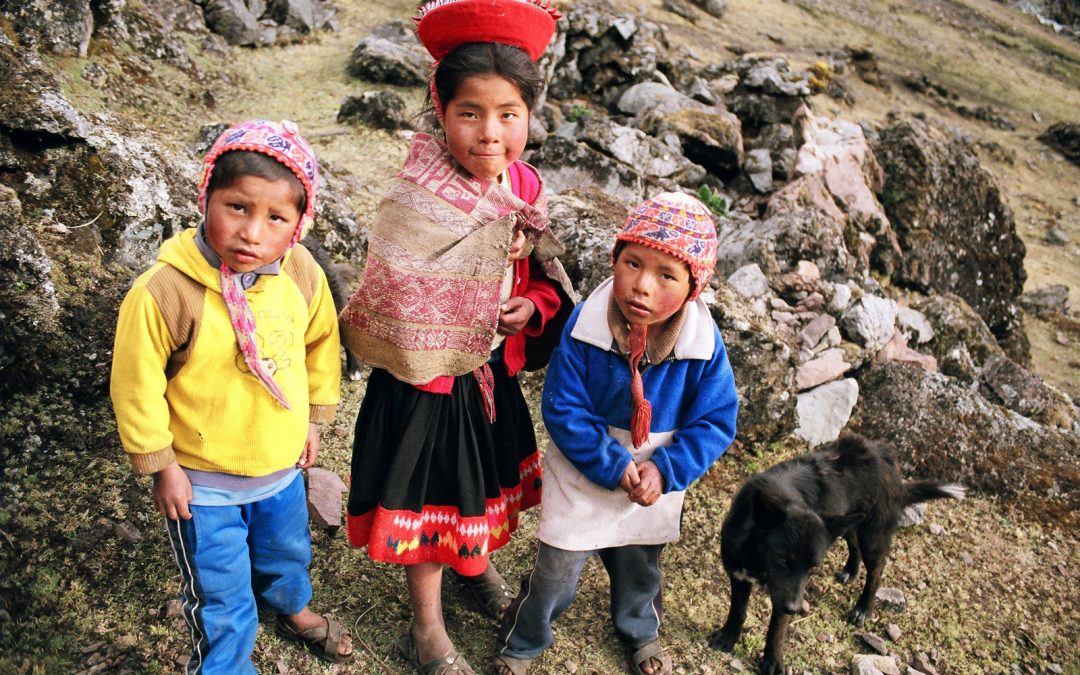
Poverty, it is a well-known topic that you have definitely heard of, worked on or even know someone who struggles from its conditions. Well, poverty have different categories and is linked with many stressful life situations, some of those links are substandard housing, homelessness, inadequate nutrition and food insecurity, inadequate child care, lack of access to health care, unsafe neighborhoods, and under-resourced schools which adversely impact our nation’s children and many more. Let’s see together how Peru’s Poverty was 10 years before versus now in numbers and what they did to alter the country’s situation.
The problem in 2009 and 2010 was that the percentage of the population living below the national poverty lines was high and government was much needed in order to plan and implement strategies in order to decrease this dangerous humanitarian problem. So this is a mini development project that fits in the first development goals that are set by the United Nations for countries to reach by 2030.
Statistics provided by the United Nations for countries helped in showing the world the effect of such problems in numbers in order to understand the size and urgency of such humanitarian world situations. In the below visualizations we can observe the evidence of poverty in Peru from the two graphs; the bar graph of population living on less than 3.20 U.S. dollars per day and the poverty headcount ratio. As we can see the poverty headcount ration in Peru was 33.5% in 2009 and the share of population living on less than 3.20 U.S. dollars per day was around 15% in 2010. Both numbers are high and reflect a real social problem that effects the country’s social safety negatively.
Potential Solutions, Details and Validation
Government is the critical entity and the solution provider for such huge objectives because the goal is on a country level. Social safety net programs are very impactful and practical approach for such problems where government can work on and implement. Government social safety net programs provide healthcare, health insurance, retirement funds, disability payments, education, and other welfare services to people. Such aids in different sectors improves the quality of life, in financial terms and overall wellbeing.
The social safety net consists of non-contributory assistance existing to improve lives of vulnerable families and individuals experiencing poverty and destitution. An estimated 36 percent of the very poor escaped extreme poverty because of social safety nets, providing clear evidence that social safety net programs. Which include cash, in-kind transfers, social pensions, public works, and school feeding programs targeted to poor and vulnerable households.
Post implementing social safety net programs we can validate their impact from the visuals above, were we can observe the following:
The percentage of poverty headcount decreased from 33.5 % in 2009 to 20.2 % in 2019 which is a significant positive decrease.
The percentages share of population living on less than 3.2 U.S. dollars per day decreased in half the value from around 15 % in 2010 to 7.5 % in 2019 which is another significant positive decrease.
However, from the below visuals we can observe that the benefit percentage of social safety net programs in percentage decreased from 68% to 50.5% between 2012 and 2019 in Peru knowing that the coverage of these programs is high, where it covers around 88% of the targeted population.
Findings and Recommendations of the social safety programs
The government should continue offering a variety of social safety programs in order to continue with its positive growth in terms of reducing poverty, unemployment and other social and economic difficulties. Funds must be used wisely and strategically in order to continue with those programs especially the critical ones such as the food subsidies for the extremely poor families via food coupons and stabilize price fluctuations of basic food items, which included sugar, rice, and meat besides cash transfers if applicable depending on area and technology available.
From the below Visuals we can observe that Peru successfully worked on reducing poverty and controlled social difficulties such as increase of urban population and controlling poverty gaps.
In conclusion, funds and strategic management provided by the governments shall improve the chances of success of the structural adjustment programs hoping to reach a level of zero poverty not just in Peru but also worldwide.
Most countries in the Arab region are witnessing high rates of poverty due to the poor management held by its authorities. There’s lack of economic development which is directly affecting the situation in each of the countries. There are several reasons behind delaying the growth of the economies and one of them is not understanding the real purchasing power of the consumer. In order to better understand it , countries should start evaluating their gross domestic product based on purchasing power parities rather than exchange rates.
What are purchasing power parities?
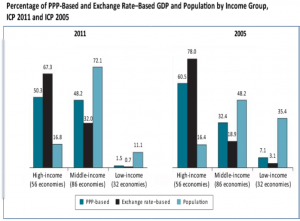
Purchasing Power Parities measure the amount of currency needed in a certain country to buy the same basket of goods and services that a single unit of another country’s currency can buy. PPPs make it possible to compare the output of economies and the welfare of their inhabitants in real terms, thus controlling for price level differences across countries.
PPPs are used for analysis and measurements in many areas by a wide variety of users, ranging from international organizations to policymakers, academia and the private sector. Due to significant differences in price levels across countries, market exchange rate‐ converted GDP does not accurately measure the relative sizes of countries or the levels of material well‐being. For this reason , we can see how the illogical health care, education and living costs in the countries are leading to poverty and unfortunate productivity.
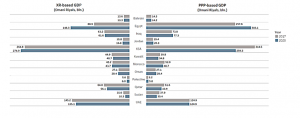
In the below visualizations we can see how the income gaps between countries have been narrowed after observing the results in 2005 and in 2011.
Moreover, in the below visualization, we can see that Egypt surpassed Saudi Arabia in having the largest economy in 2020 when we compared GDP based on PPPs.
% change of GDP based on PPP between 2017 and 2020
We can see also that Egypt witnessed the highest % change in GDP with 17.63 % while Sudan observed a major decrease by 19.75%.
Recommendations:
Countries should use PPPs because it allows them to analyze their income or consumption data in globally-comparable terms by taking account of the purchasing power differences between countries.
Without PPPs, comparisons of income and consumption levels would typically rely on market exchange rates, which generally underestimate the purchasing power of consumers in poorer countries, making them appear too poor relative to those in richer countries, compared with the real differences in their living standards.
Use PPPs to set a real poverty line which describes the real deprivation level of the individual . This person is considered poor if his or her income or consumption falls below this line.


 Creating education programs would:
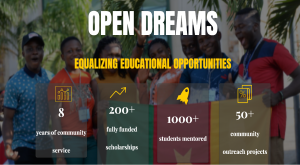
 Finally, from another perspective, how about looking at equalizing educational opportunities as a solution to many other issues? and working on SDG 4 for quality education will strongly and positively affect other goals such as ending poverty and hunger?