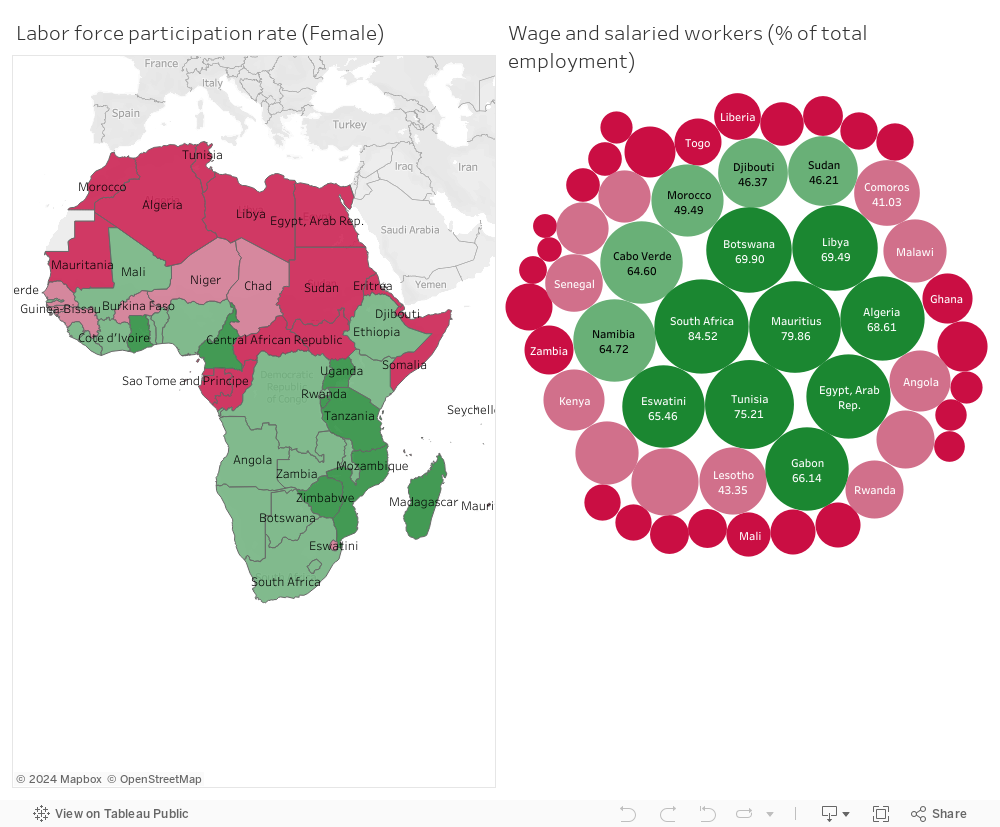
Decent work and equal pay remain pivotal challenges in Africa, as nations strive to create job opportunities that are both equitable and sustainable. The quest to balance economic growth with social inclusion is evident in the varied landscape of female labor force participation and the proportion of wage and salaried workers across the continent.
In the visualization of Africa’s labor landscape, the contrast in female labor force participation is stark. Countries like Niger and Central African Republic show participation rates of 39.02% and 60.29% respectively, indicating a significant portion of women contributing to their economies. Yet, this is only a fragment of the picture. The proportion of wage and salaried workers offers another perspective on job security and equity in compensation. South Africa leads with 84.52%, hinting at a more structured and possibly equitable job market. However, in countries like Algeria, with a lower 16.51% female participation rate and a wage and salaried workers percentage of 68.61%, there’s an implied gap in decent work availability and fair pay, particularly for women. These numbers are not just data; they are indicators of the progress and challenges in achieving decent work and equal pay across the continent.
Youth Employment and Education
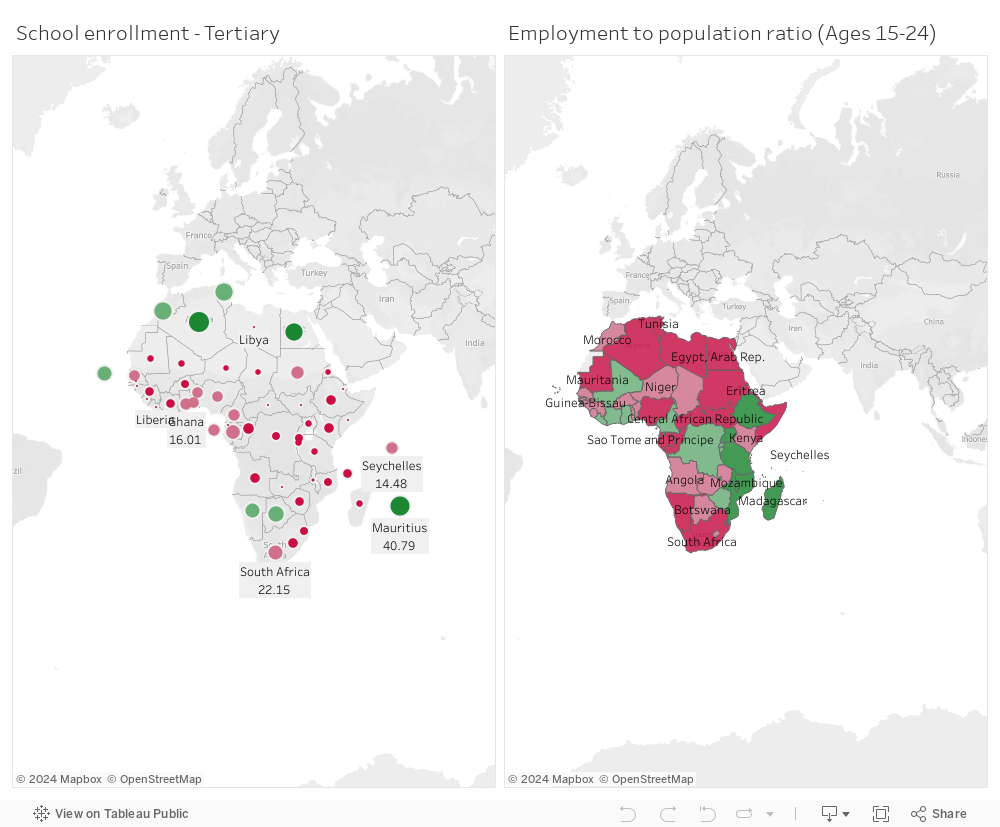
In Africa, the pursuit of Youth Employment and Education target confronts a complex tapestry of opportunity and challenge. As nations strive to significantly reduce the proportion of youth not engaged in employment, education, or training, the interplay between advancing educational attainments and the evolving job market becomes crucial to shaping the future workforce.
The juxtaposition of tertiary school enrollment against youth employment rates in African countries may reflect systemic challenges in aligning educational outputs with labor market demands. High enrollment numbers, such as those in Algeria and Tunisia, do not necessarily translate into employment, which could indicate a surplus of graduates with skills that do not meet the needs of the current job market or possibly a lack of job creation. On the other hand, countries like Ethiopia and Mali show high youth employment rates despite lower tertiary enrollment, which may suggest that young adults are entering the workforce earlier, possibly due to economic necessity or the availability of jobs that don’t require higher education. This scenario raises concerns about the quality of employment and whether these jobs can offer long-term stability and growth, which are crucial for sustainable economic development and poverty reduction.
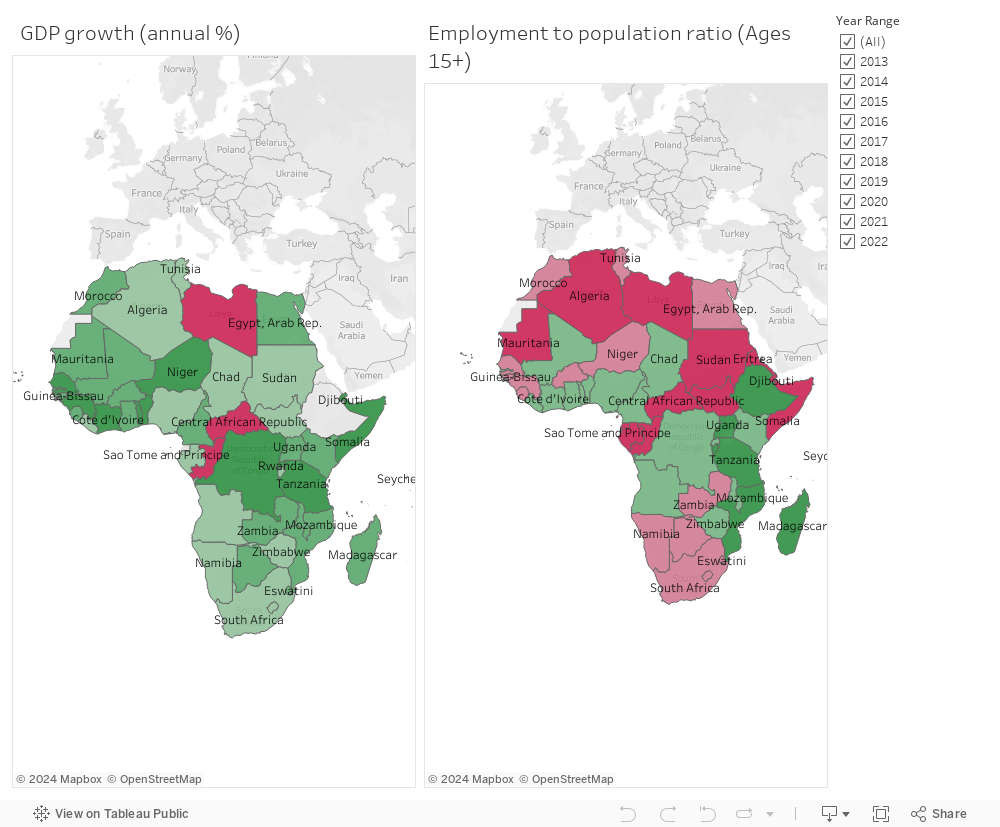
Economic Productivity and Employment Growth
Economic Productivity and Employment Growth in Africa stands at a critical juncture. The region’s future hinges on its ability to diversify, innovate, and enhance technological capabilities to foster a labor market that is both vibrant and inclusive.
The visual contrasts GDP growth with employment-to-population ratios across various African nations, highlighting economic dynamism juxtaposed with labor market realities. Notably, countries like Egypt and Chad show significant GDP growth, yet this does not directly correlate with high employment ratios, underscoring the complex relationship between economic expansion and job creation. Conversely, Mozambique’s lower GDP growth accompanies the highest employment ratio, suggesting that economic growth rates may not always predict employment health. This dichotomy reveals the nuances of economic development and labor markets, indicating that growth does not automatically translate into widespread employment opportunities, a critical consideration for policy interventions.
Conclusion
The intricate balance between ensuring decent work and guaranteeing equal pay in Africa is a vivid reflection of the broader global struggle for economic equality and labor rights. Despite advancements in some areas, the disparity in female workforce participation and the varying percentages of wage and salaried workers across the continent underscore the ongoing challenges. This complexity necessitates a nuanced, multifaceted approach to policy-making that prioritizes both the creation of quality jobs and the assurance of fair compensation, particularly for underrepresented groups such as women. Only through such targeted strategies can sustainable economic and social progress be achieved.
Cyprus’s GDP growth rate has been on a decline, with more recently negative growth rates. My team of reaserchers and I need to find out why, and the potential solutions to improving the GDP in the upcoming years whilst tackling the root cause.
GDP: Downward trend
Evidence for this decline in GDP growth rate is shown through visualising the data. I discovered that the decreasing growth rate is correlated to the increase % dependancy age of old people (65+) in the working force over the years . Hence the working force tend to come from senior workers who have a higher probabilty of retiring, overall affecting productivity and efficiency.
Solution : AUB Mediterraneo
Opening Universities such as AUB campus in Cyprus, to get Lebanese people out of the bad economical state of Lebanon whilst getting their education from Cyprus along with a stronger passport by the end of it. This also allows Cyprus to get a working force coming from the younger more revitalised workers hence improving efficiency and overall GDP.
Validation
The solution is validated by gathering data regarding the average age of the labor force , and noticing if theres a decrease in age range. Also by monitering the GDP, looking for any improvements that is a result of an increase dependancy on our younger labour force.
Further recommendations
Moreover due to the decrease of birth rate seen in the visualisation, I recommend that the government incentivises the locals to reproduce. Through offering assistance allowance for parents with more children.Therefore when old enough to work they can contribute to the GDP. Cyprus’s working age is 15, they can reduce it to 13 to get more efficient workers whilst improving the overall GDP.
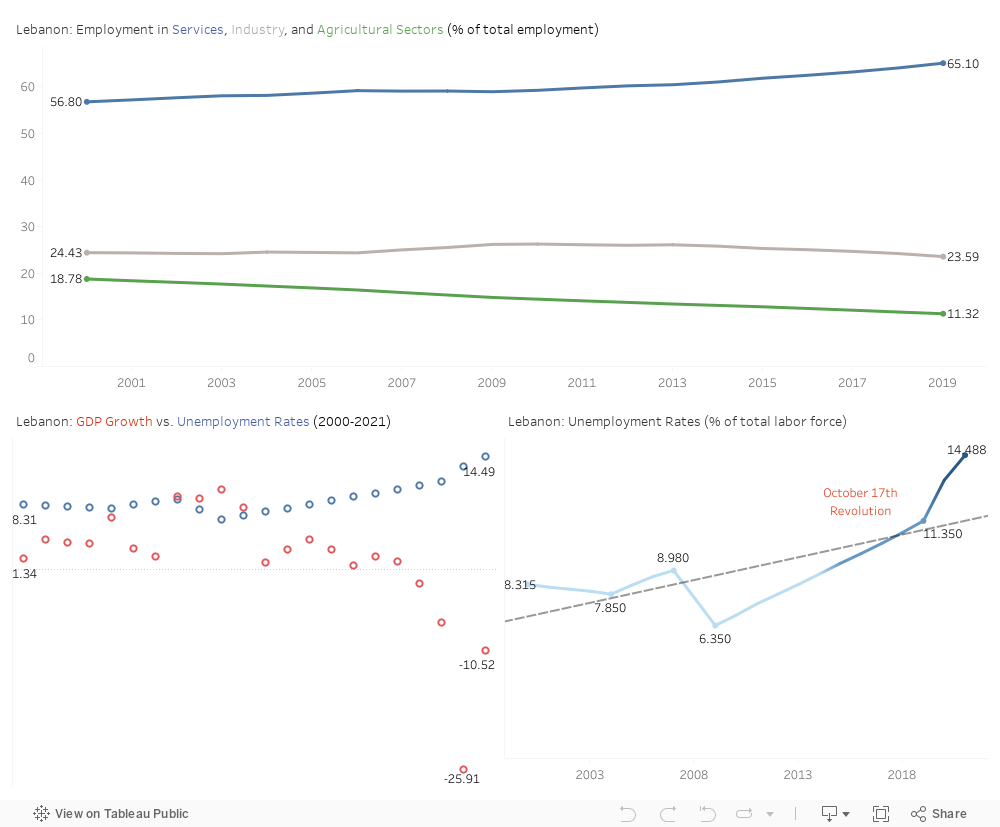
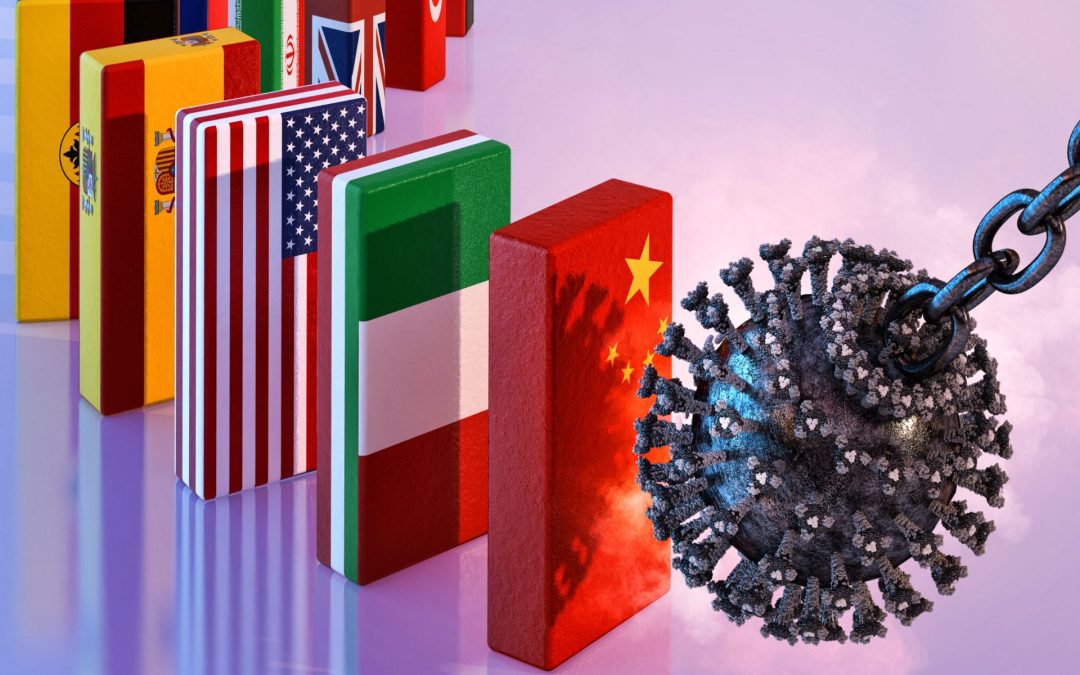
Wassim, Nathalie, and Imad; three individuals who were pushed out of work by the deteriorating economic conditions in Lebanon. Tens of thousands of people like them have been suffering daily for the past 3 years living from paycheck to paycheck up until they were forced out of it (work). Lebanon has witnessed what no other country has. Unemployment rates doubled in only a decade, COVID-19 took out thousands, and inflation bankrupted hundreds of businesses.
According to Okun, a very low or negative growth in GDP leads to a rise in unemployment. By observing this visual, we can see how unemployment skyrocketed while GDP growth took a deep dive. Comparing the years 2008 and 2009, GDP growth increased 10.23 percentage points while unemployment rates decreased by 6.35 percentage points. We can conclude an inverse correlation between GDP growth and unemployment. Another observation is that between years 2020 and 2021, GDP growth increased by almost 15 percentage points. Despite this growth, unemployment remains significantly high at 14.49 percentage points. Importantly, this project is action-oriented in that it shows the nexus between unemployment and GDP growth #SDG8, which are intrinsic to an economy, from more “policy-driven” factors that can be addressed, improved or mitigated.
Here, a question rises? What is the cause for the disproportionality between GDP growth and unemployment rates? There are 3 possible causes for its inverse relation:
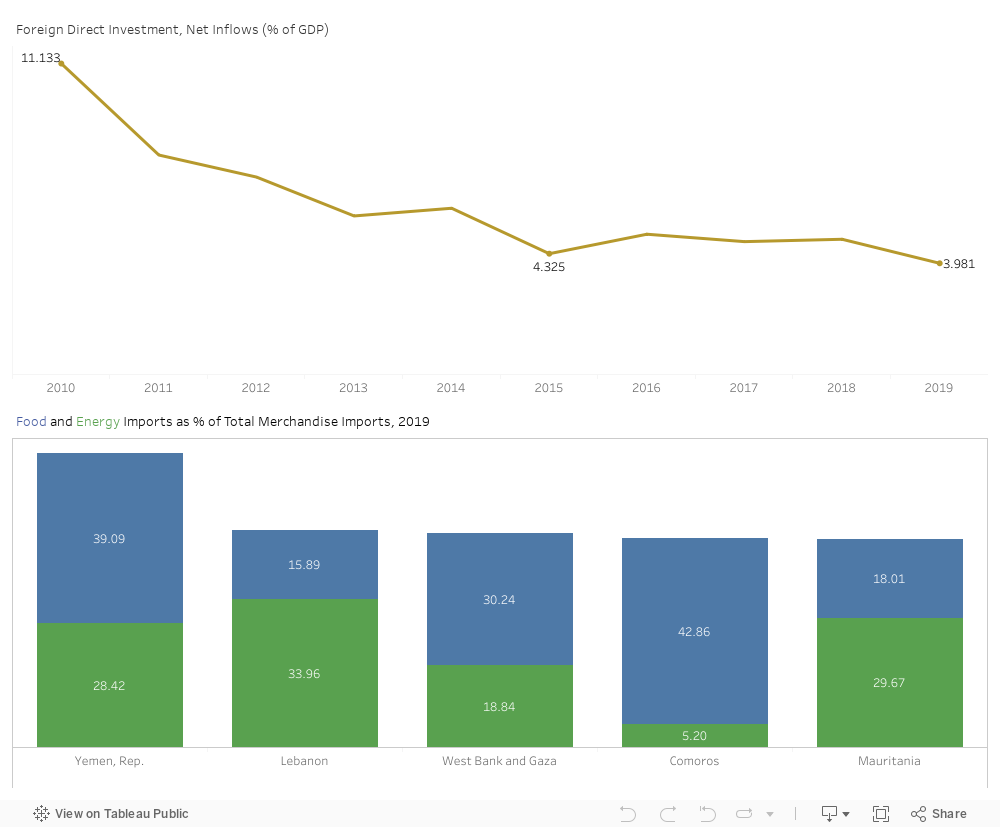
• The decrease of Foreign Direct Investment (FDI) which reached 3.98 percentage points in 2019 due to the lack of security and political tension
• Another possible cause is the low diversification in economic sectors due to scarcity of resources. Looking at this visual, we can see the focus of employment shift mainly to the service industry which witnessed an increase by 65.10 percentage points while the agricultural and industrial sectors are left behind increasing by under 30 percentage points in 2019.
• The third and final possible cause is the over-dependence on food and fuel imports. Lebanon possesses the second highest food and energy imports in 2019.
What should be done?
Drawing upon decades of empirical literature on drivers and predictors of lack of growth, this project proves Okun’s law using visualizations for the case of Lebanon. According to International Labor Organization (ILO), not just growth, but quality of growth is the key anchor in the SDGs 2030 agenda. Sustainable economic growth will require societies to create the conditions that allow people to have quality jobs that stimulate the economy while not harming the environment.
1. Creating greater opportunities for women and men to secure decent employment and income. Closing the employment gap is at the heart of the decent work agenda, this can be through promoting voluntary private initiatives and corporate social responsibility.
2. Instating policies to enhance knowledge, skills and employability for men and women since gender remains a source of labor market inequalities and inadequately utilized human resources. Women continue to be employed in a narrower range of occupations than men and to be concentrated in lower-paid, insecure, and unprotected jobs.
3. Promoting employment through reconstruction and employment-intensive investment.
4. Increasing access to financial services to manage incomes, accumulate assets and make productive investments.
Findings and Recommendations
A shift in economic thinking and planning towards economic structural transformation is necessary for the Arab region to develop on SDG 8 (ESCWA, 2021). The post-pandemic SDG agenda must leverage the lessons learnt to reinforce national social safety nets and employment policies. This strengthens economic resilience and allows developing countries to absorb shocks. A continued lack of decent job opportunities, insufficient investments, and under-consumption slows down economic growth. The average growth rate GDP is increasing after the pandemic; however, it still did not reach pre-pandemic levels of growth and developing countries such as Lebanon are moving farther from the 7% growth rate set for 2030. Therefore, as labor productivity decreases driven by low productivity and unemployment rate rises, standards of living decreases and overall economic growth decreases.
Governments must join forces and formulate policies to promote better job opportunities through active labor market programs, corresponding to important SDGs: Economic Growth and Decent Work, as well as Partnerships to Achieve the Goals.
Sustainable economic growth will require societies to create the conditions that allow people to have quality jobs that stimulate the economy while not harming the environment. Job opportunities and decent working conditions are also required for the whole working age population. There needs to be increased access to financial services to manage incomes, accumulate assets and make productive investments. Increased commitments to trade, banking and agriculture infrastructure will also help increase productivity and reduce unemployment levels in the world’s most vulnerable regions.#SDG8 #SDG16
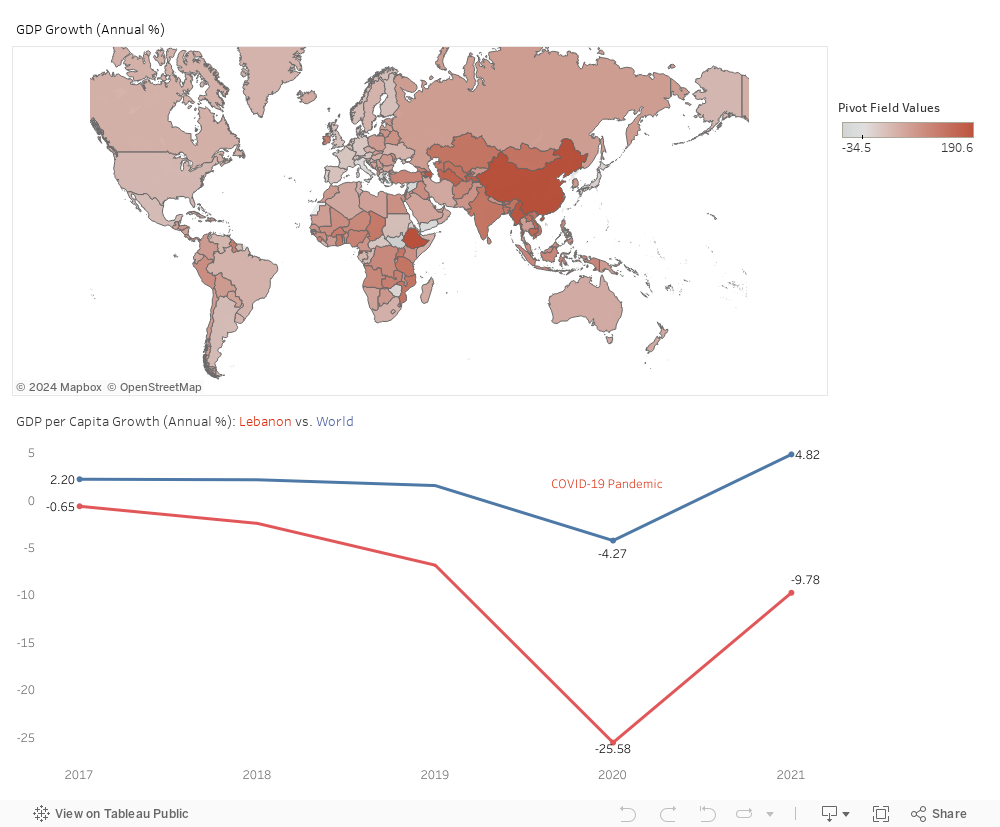
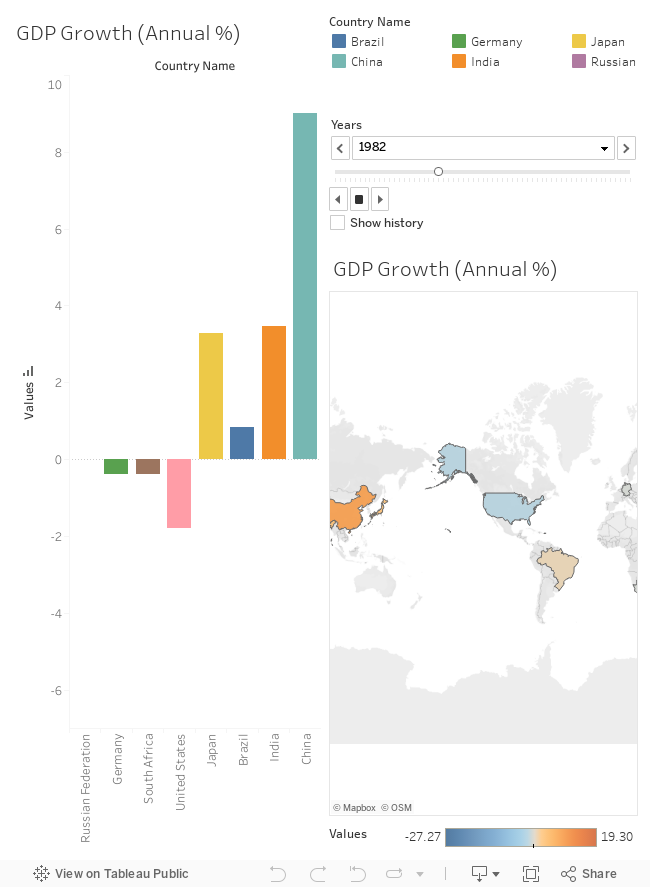
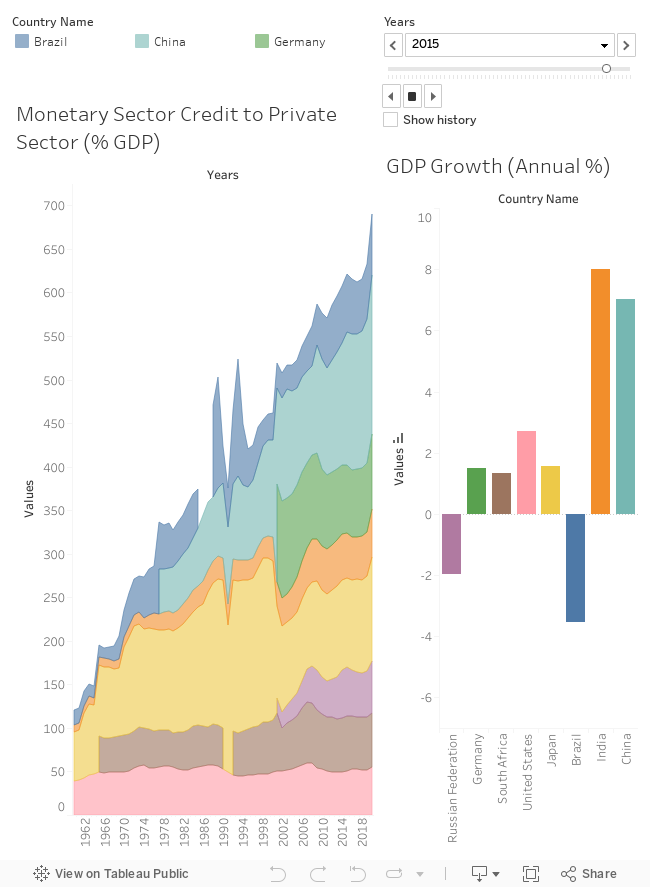
Not exclusively to BRICS (Brazil, Russia, India, China, and South Africa), the world economy suffered greatly in the years spanning the COVID pandemic. Even though the pandemic is a subject of the past, its consequences generate a ripple effect perceived until this day, especially in developing countries. #SDG8 #SDG8.1
This issue becomes evident when glancing over the BRICS’ GDP growth per annum alongside that of other economies. Ever since its emergence, the countries comprising the BRICS have shown sustainable growth in their GDP throughout the years. However, in 2019-2020, the BRICS experienced a substantial decrease in their GDP growth, with Brazil reaching a negative GDP growth.
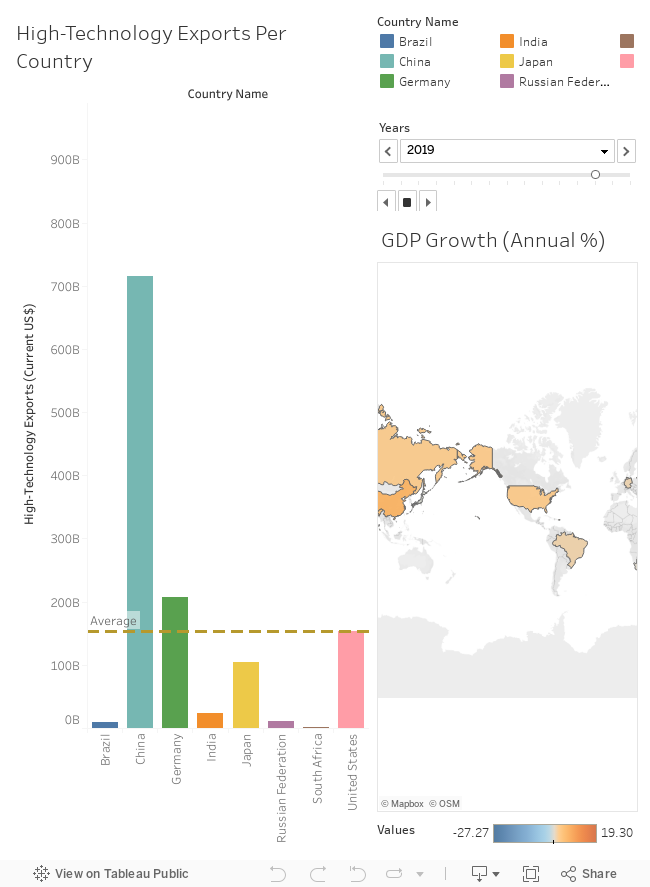
One can expect a decrease in GDP growth given the circumstances of the pandemic. Nonetheless, most countries in the BRICS managed to hold their ground away from the zero mark in GDP growth, while others were not so fortunate. However, what could possibly explain this discrepancy? One of the indicators of healthy GDP growth lies in the amount of export to import ratio, and this was the lens through which the analysis was drawn. The difference between Brazil and China, both developing countries, lies in the ‘what’ is exported. The fact that China exports high-technology products and services, which is not the case in Brazil, is a major contributor to this discrepancy. #SDG 8.0 #SDG81 #SDG8.2
A means to mitigate this predicament is to increase the incentive for developing countries to produce and sell high-technology services or products by means of long-term credit availability and fiscal incentives. In more detail, the promotion of long-term credit is crucial to medium and small-sized exporters as they make up most exporters in developing countries, and to the elimination of long, bureaucratic, and inefficient regulations that deter the entry of new exporters. Lastly, provide fiscal incentives to nurture innovation.
Supporting evidence is found in the fact that countries that provide the greatest credit for the private sector also experience the higher export of technology, and consequently, greater GDP growth per annum.
It is recommended that developing countries establish special economic zones (SEZ) close to industrial or port areas. Like in China, SEZ should offer fiscal incentives, and motivation to innovate, and remain close to the port and the manufacturing regions to speed up the export process with minimal bureaucracy.
While one might expect to see better development outcomes after countries discover natural resources, resource-rich countries tend to have higher rates of conflict and authoritarianism, and lower rates of economic stability and economic growth, compared to their non-resource-rich neighbors. This is what has become known as the Resource Curse. Countries like Venezuela in Latin America, Angola in Africa, and Saudi Arabia and the United Arab Emirates in the Middle East have all exhibited varying degrees of this problem. Countries suffering from the resource curse also have significantly higher rates of pollution, and those with higher GDP per capita rely less on renewable energy sources. Because those countries are also mostly authoritarian, taxes are not collected from the people and government expenditures are not monitored.
In Lebanon, the prospect of commercial gas fields has excited the people and has led the government to sign contractual agreements with drilling companies to start exploring and producing commercial gas. Many believe that this project would enrich and stabilize Lebanon, but the history of resource-rich countries predicts otherwise.
Problem Evidence
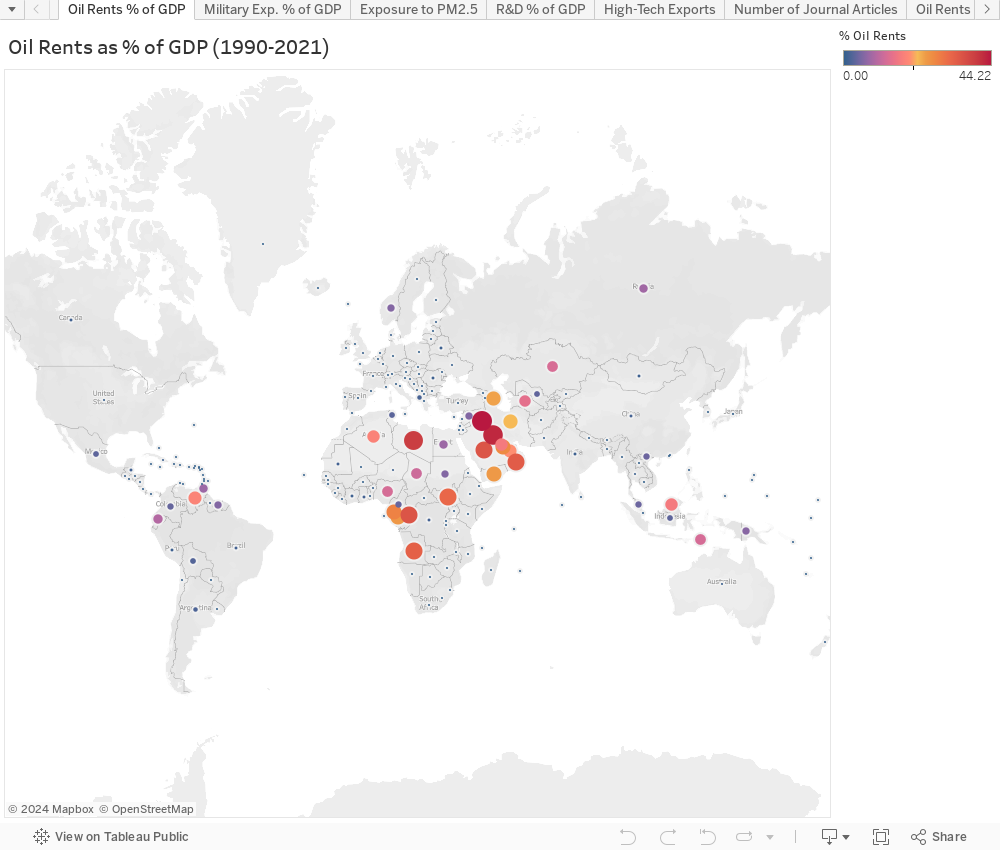
Economic Instability (related to SDG 8, 8.2): Below, we can see each country’s oil rents share of GDP, that is, the share of resource sales and exports out of total GDP. We can clearly observe that Gulf Countries and some resource-rich African countries like Libya, Angola, Democratic Republic of Congo and others, have oil rents account for 25 to 45% of their GDPon average for the past 30 years.
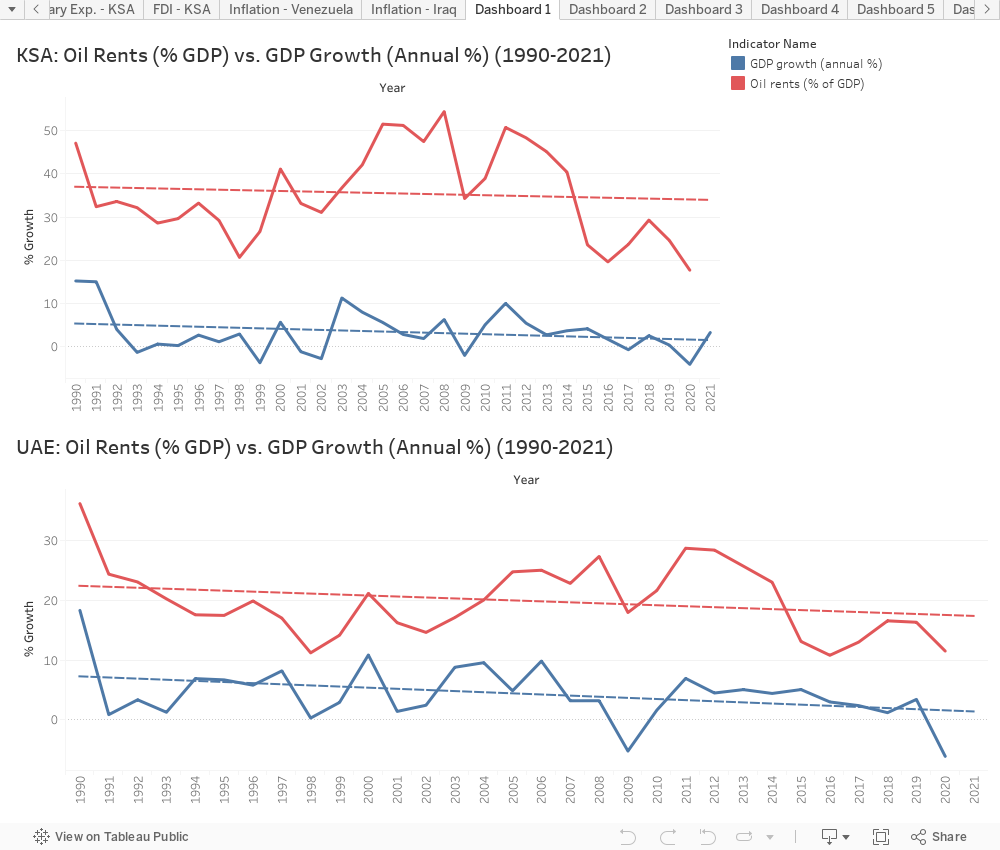
We can also see how Oil Rents move exactly in tandem with GDP Growth for Saudi Arabia and the UAE, which means that their economic growth is highly dependent on oil prices and sales volume, rendering it non-sustainable.
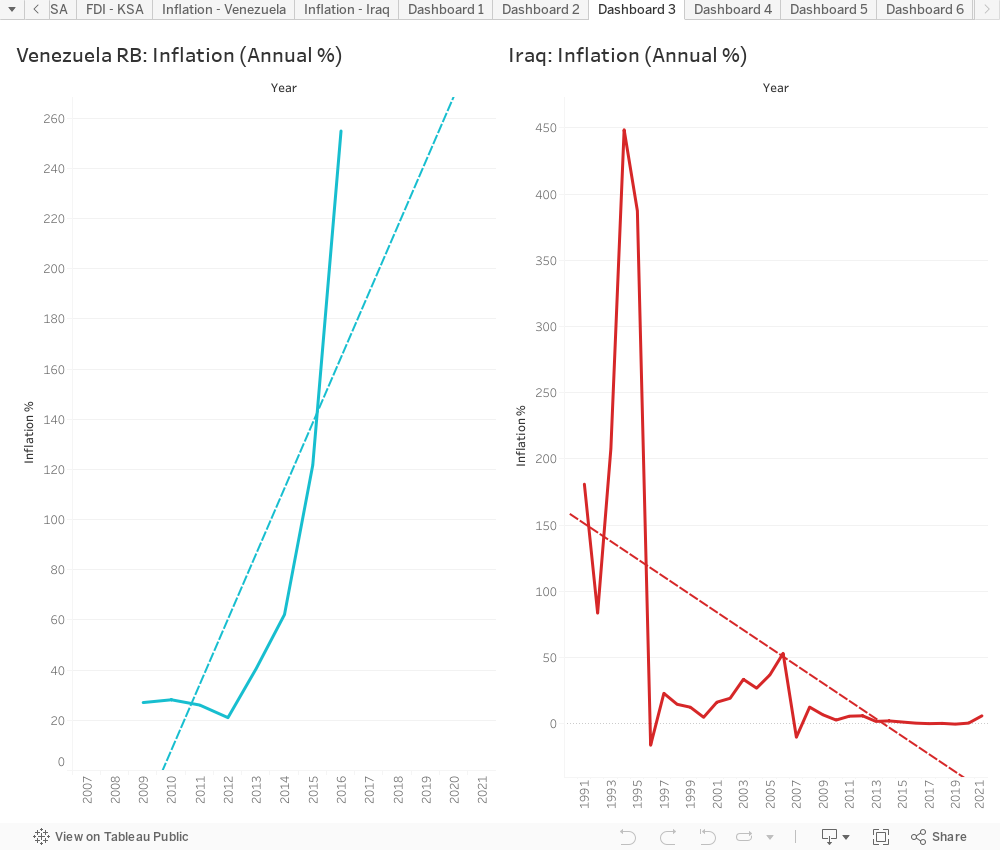
As for economic instability, severe inflationary periods have been recorded for these countries with the Gulf’s Oil Crisis in the 1970s through 1980s and the 1990 Oil Shock which impacted the Arab World greatly, and then Venezuela’s insane inflation rate which since 2016 has increased to 53,798,500%. These trends can be observed below for Saudi Arabia, the UAE, Iraq and Venezuela. The inflation rate is more volatile in these countries and the consumer price indices are in a steep upward trend.
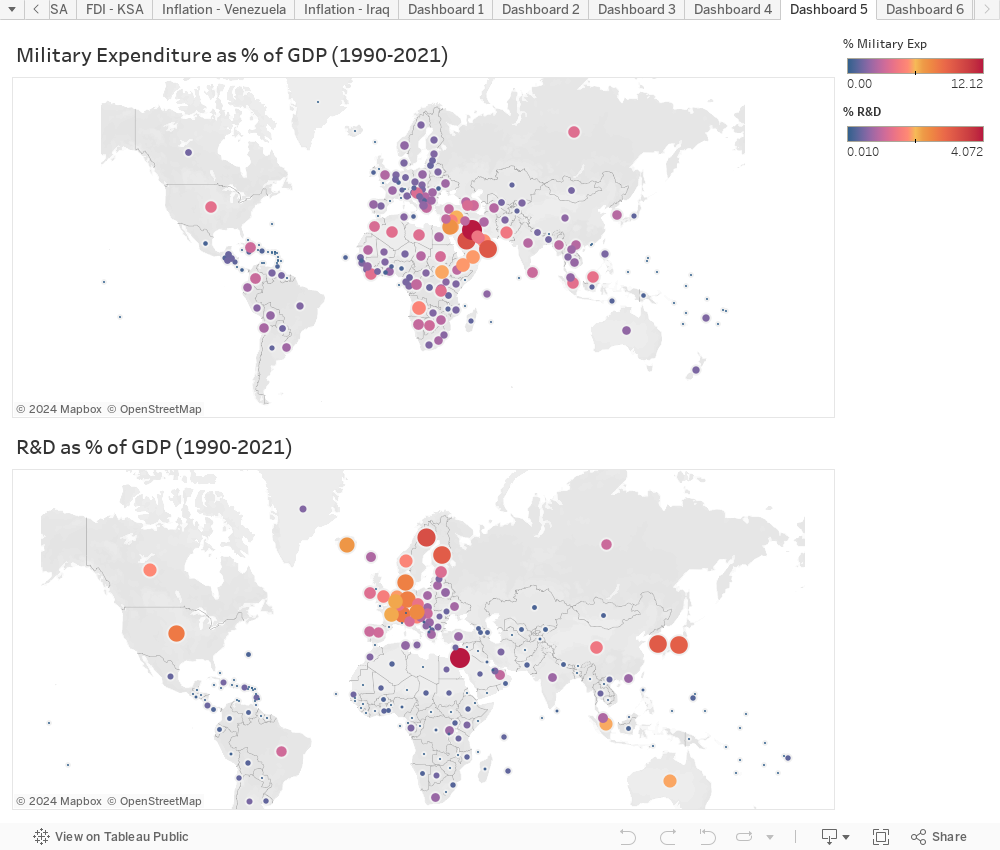
Conflict and Government Expenditures: We can see in the representation below how countries which were perceived to be most reliant on Oil Rents are also more likely to have a higher share of their GDP be dedicated to MilitaryExpenditure (SDG 16, 16.4). This indicates they are more prone to conflict, wars and social instability. Also, the lack of monitoring for governmental expenditures means that important sectors can be de-prioritized. For example, the research and development expenditures’ share of GDP is much lower in Arab countries than in Europe (SDG 9, 9.5, 16, 16.6).
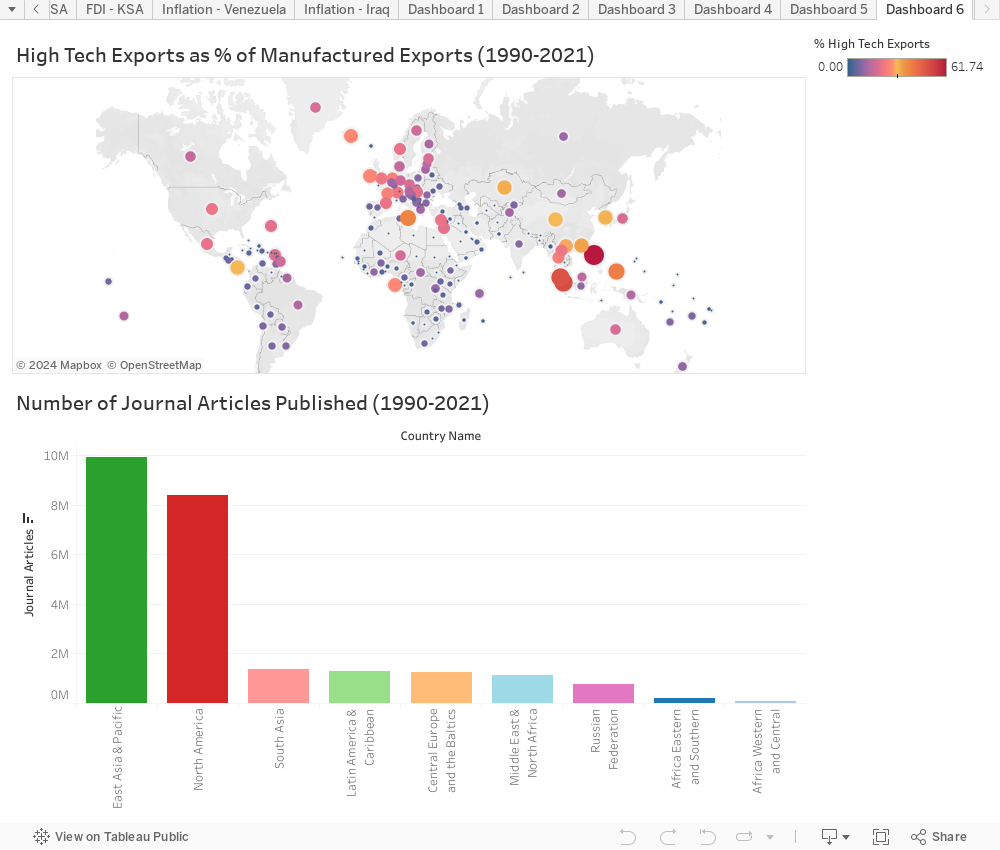
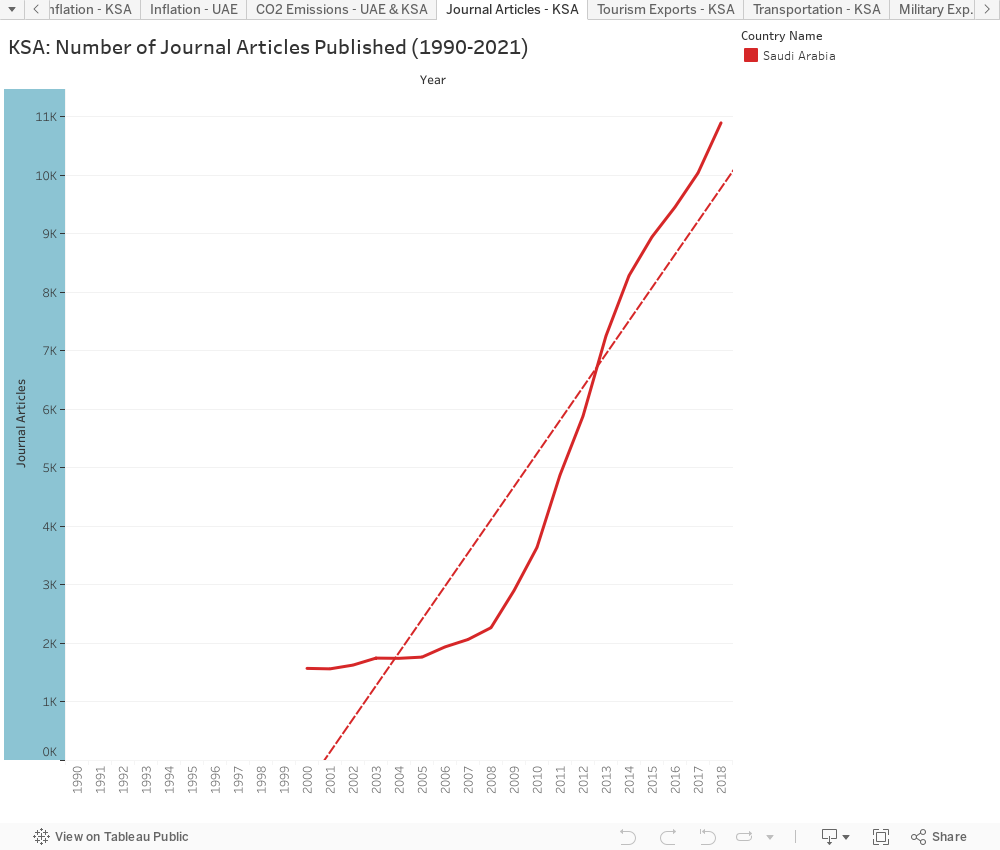
The number of journal articles produced by each area of the world clearly shows the Middle East and Africa’s lower priority for innovation and scientific or scholarly research. High technology exports also have a low share of GDP in comparison with European, North American and East Asian countries.
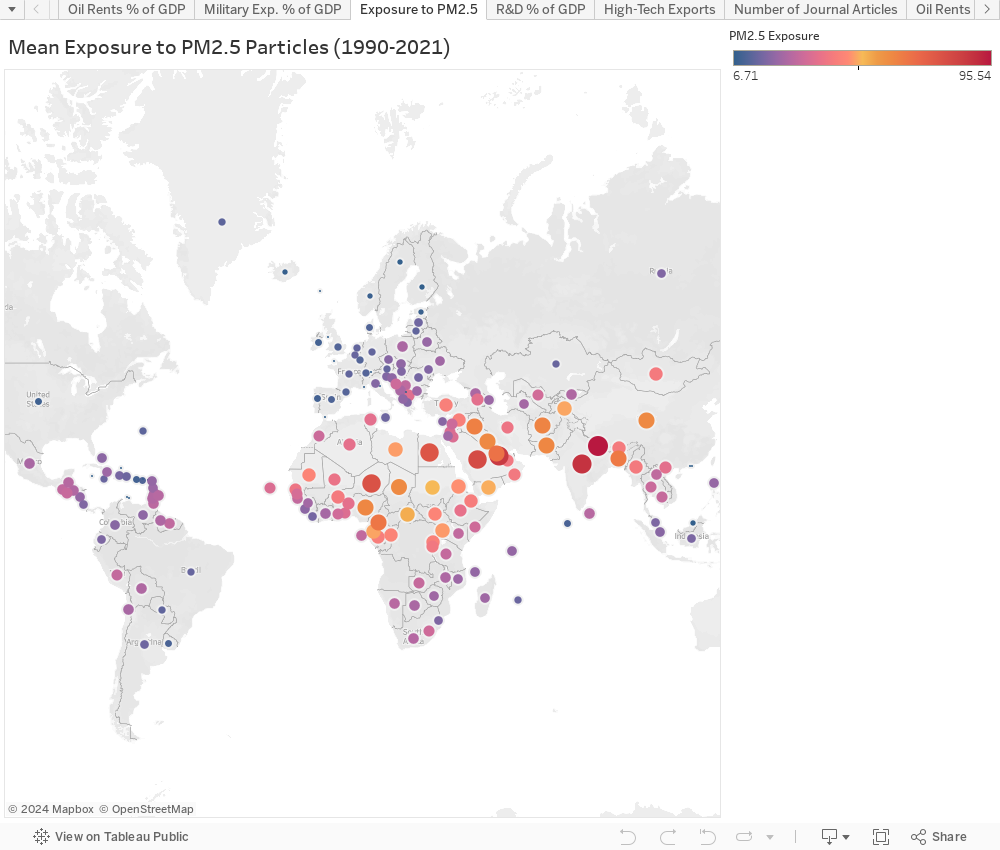
Pollution and Environmental Impact (related to SDGs 3, 7, 7.2, 8, 8.4): The mapchart below clearly shows the high exposure to PM2.5 molecules in resource-rich countries. Despite having lower population rates and less condensed cities, the Gulf Countries are amongst the most air polluted countries. Saudi Arabia uses only oil as an energy source and has a renewable energy sources rate close to 0% (out of total consumption). The UAE also uses only natural gas to power the country and no renewable energy sources.
Solutions and Reforms: Example of Saudi Arabia
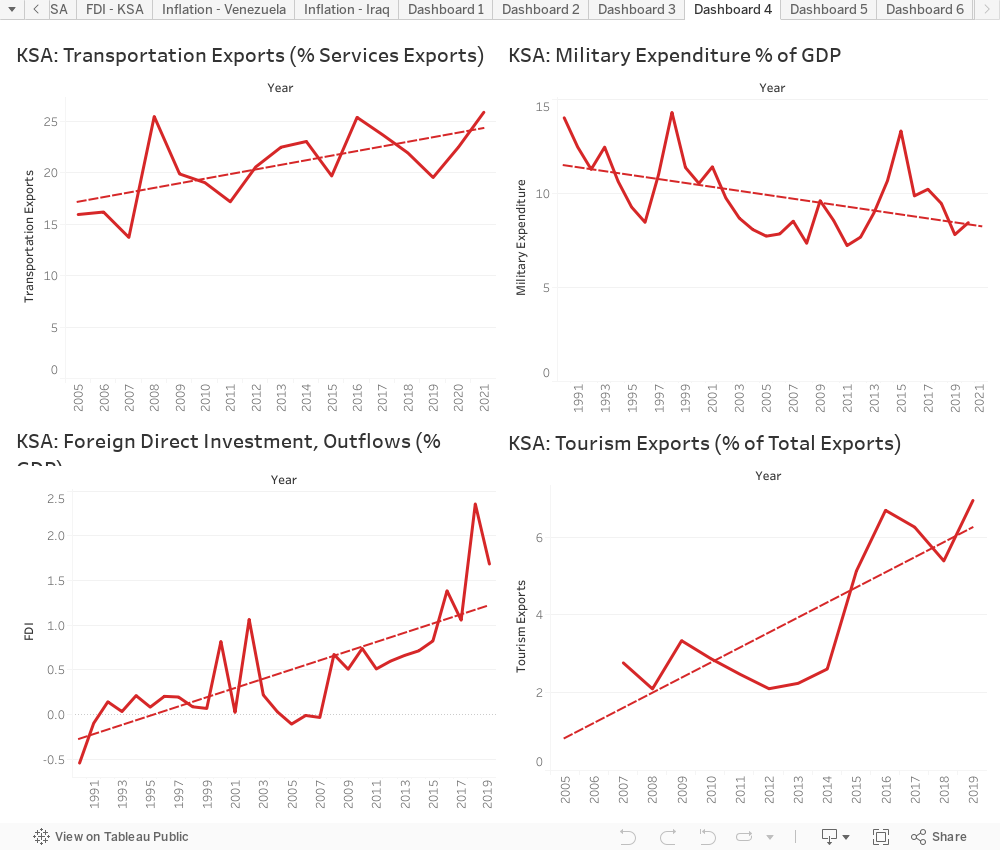
Eventually, Saudi Arabia took serious steps to diversify its economy and to become less reliant on its natural resources. It took counsel with the IMF during the early 2010s and then announced its Vision 2030 which aims for sustainable development and diversification of the economy. The data shows improvements on many levels. First of all, we can see that the GDP’s composition is shifting from being purely reliant on Oil Rents to including more activities done in the Transportation and Tourism (SDG 8, 8.9) sectors. We can also see that more Foreign Direct Investments are being made.The Military expenditures’ share of GDP is also regressing over time.
The number of journal articles published is also increasing rapidly with more and more Saudi Arabians focusing on scientific research and on new technologies (SDG 9, 9.5).
Recommendations for Lebanon
It is important to be aware of the consequences that a resource rich country may face by relying on its resource. Lebanon already has weak governance and is prone to economic instability and conflict, this is why it is especially important to learn about the reosurce curse and to keep encouraging the Lebanese people to be productive and to ensure that the governmental institutions are diversifying the economy, maintaining price stability, and producing energy from renewable resources even with natural gas being available as a resource; these concepts are especially relevant to the UN’s sustainable development goals which call for sustainable economic development, good governance, and environmental health. The data shows that proper public policy and budget controls can truly be impactful.