by nha59 | Nov 24, 2025 | Team Project
University isn’t supposed to feel like survival. But for many students, it does.
Ask around on any campus, AUB included, and you’ll hear the same quiet confessions: “I can’t focus anymore,” “I haven’t slept properly in weeks,” “Everything is due at once,” or simply, “I’m tired.” Not the casual kind of tired, but the deep-down kind that mixes pressure, deadlines, expectations, and anxiety all into one heavy load.
Our team wanted to understand this feeling, not through anecdotes alone but through data. And when we dug into two national student stress datasets, the story that emerged was stronger and clearer than any of us expected.
This dashboard is that story.
Why We Started This Project
Stress isn’t just “part of university life.” It shapes how students sleep, think, eat, learn, and show up. And when stress keeps rising semester after semester, it becomes more than a personal issue. It becomes a systemic one.
So we asked ourselves:
- What exactly is driving student stress?
- What does it look like in real numbers?
- And is there something we, as a university community, can actually do about it?
To answer that, we turned hundreds of student responses into an interactive visualization designed to show, clearly, simply, and honestly, what stress looks like across psychological, social, and academic dimensions.
The results were eye-opening.
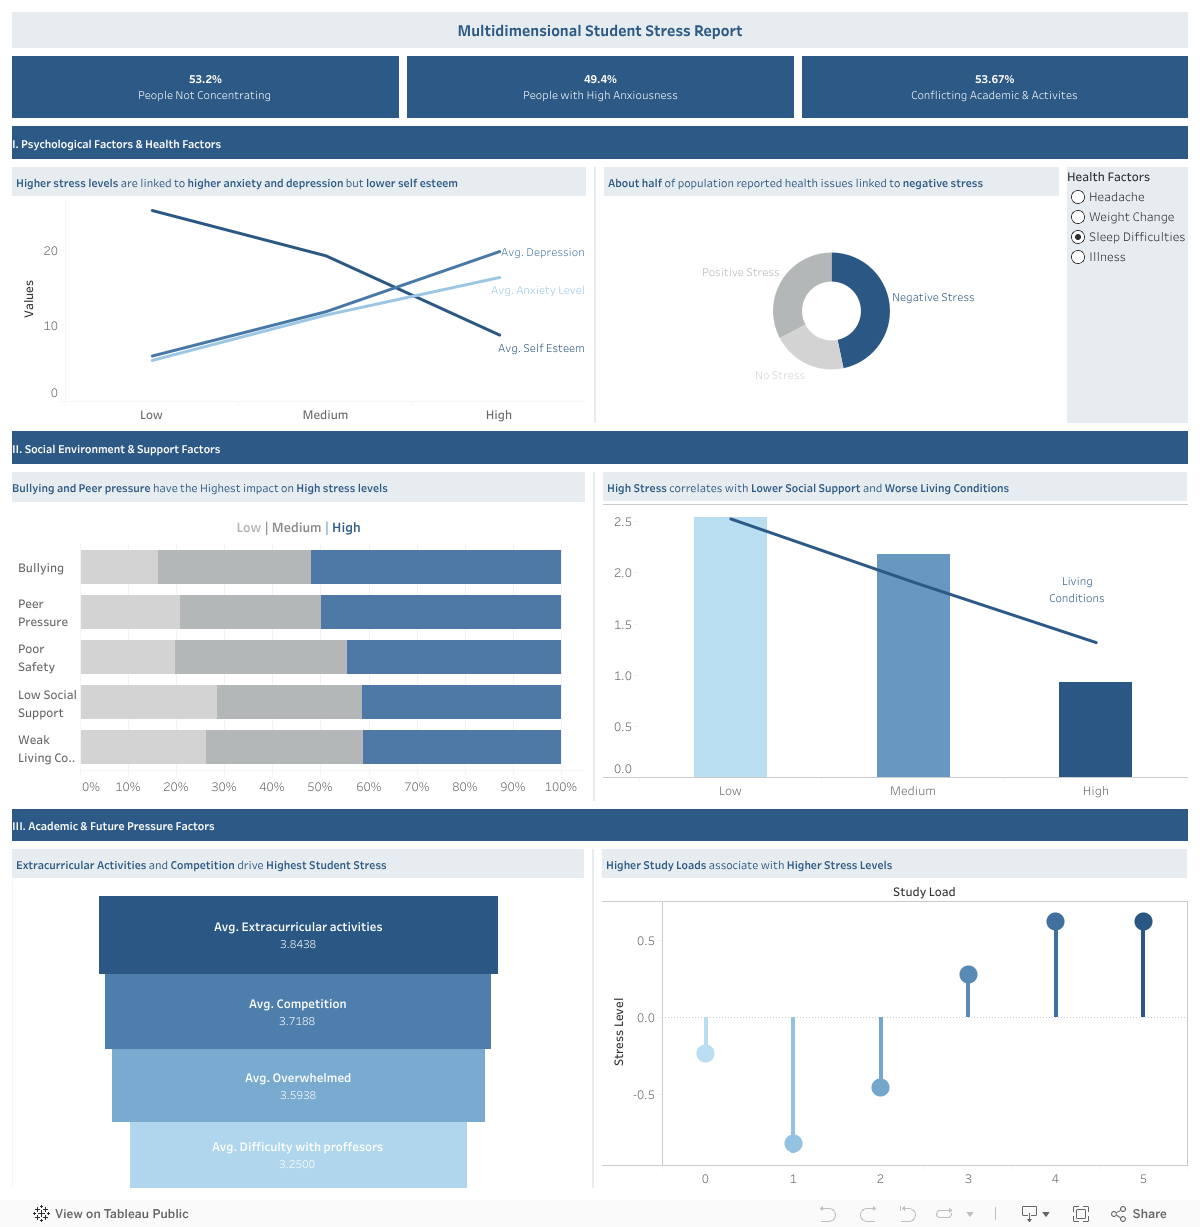
What the Data Reveals — A Human Story Hidden in Numbers
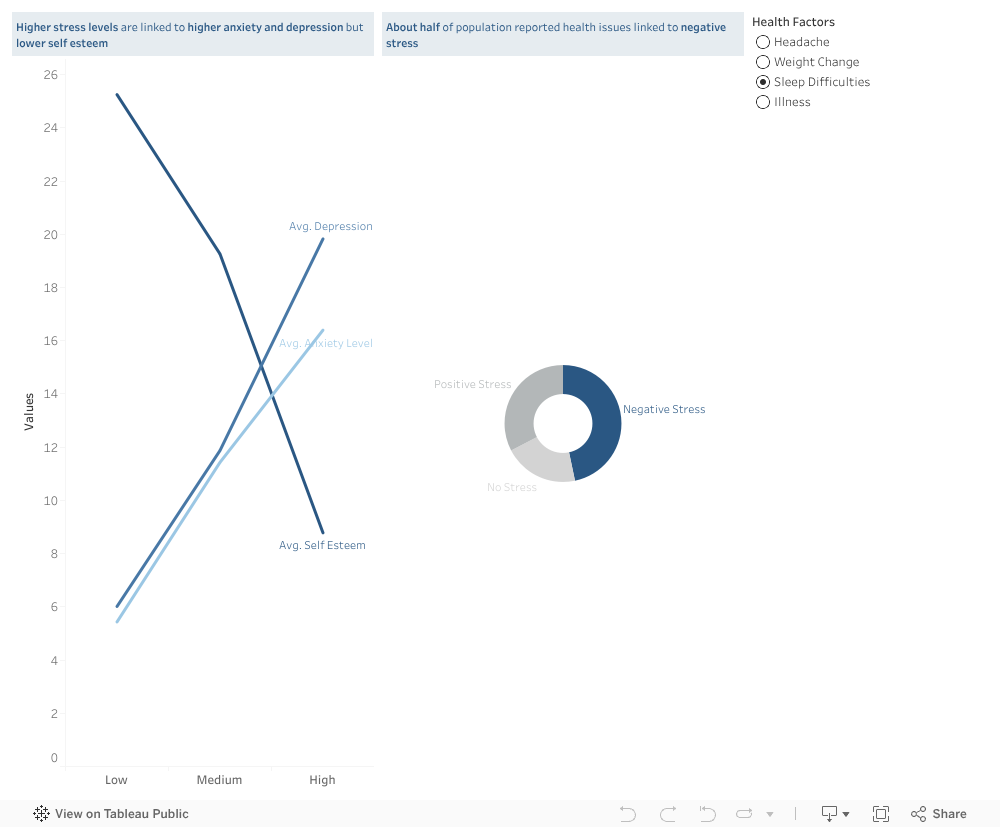
1. Stress is not just emotional — it affects how students think and function.
Half of the students in our dataset reported difficulty concentrating (53%), and nearly as many reported high anxiety (49%).
As stress rises, the dashboard shows a sharp rise in anxiety and depression, and a clear drop in self-esteem.
It isn’t just academic pressure — it’s identity-level pressure.
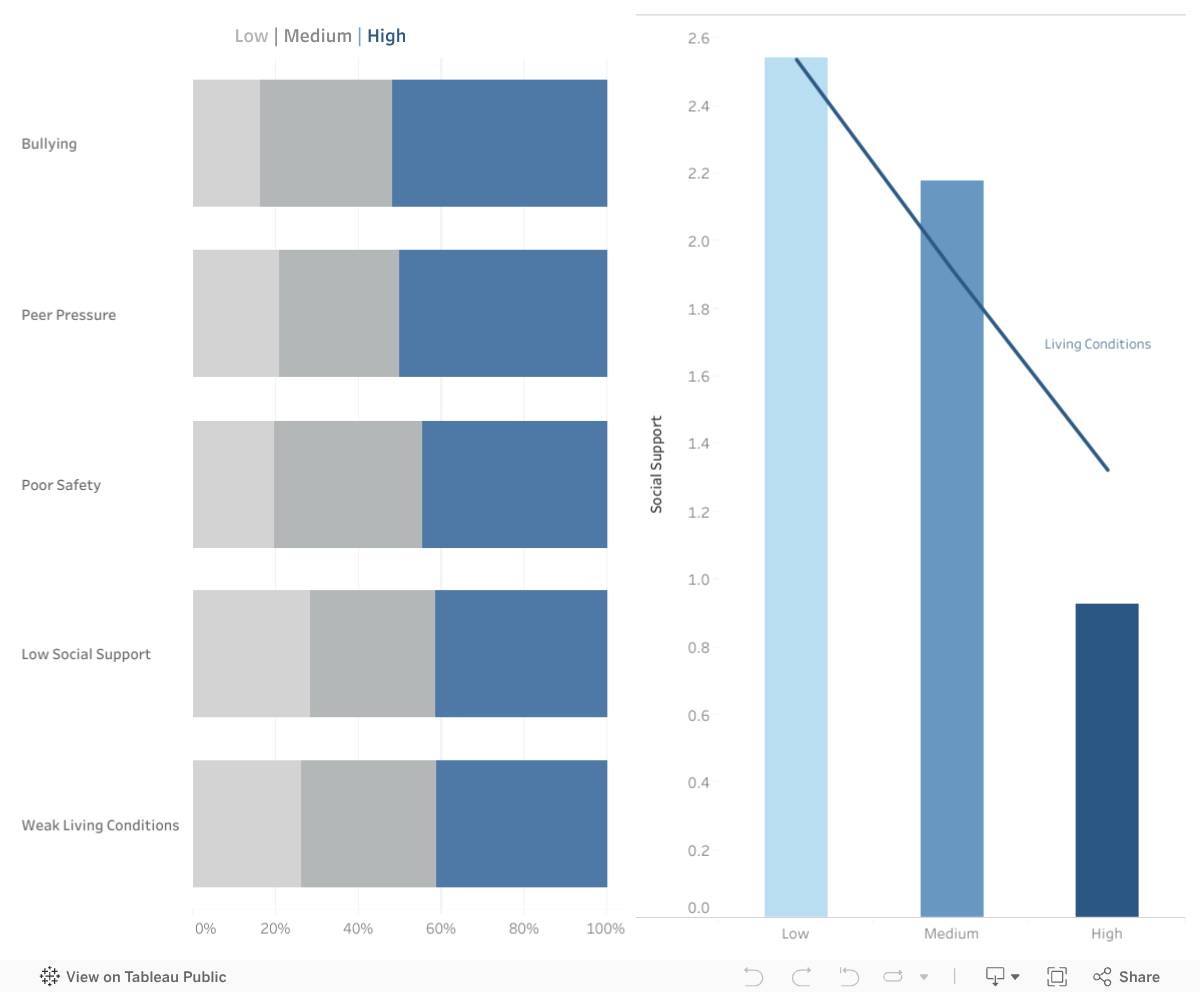
2. Social environment matters more than we think.
One of the most powerful patterns in the dashboard comes from the social and environmental factors:
- Bullying and peer pressure rise sharply with stress
- Low social support strongly correlates with high stress
- Poor living conditions amplify stress far more than expected
Stress doesn’t start in the classroom; it grows in the spaces between classes too — in dorm rooms, social circles, financial challenges, unspoken expectations, and the feeling of being alone when things get overwhelming.
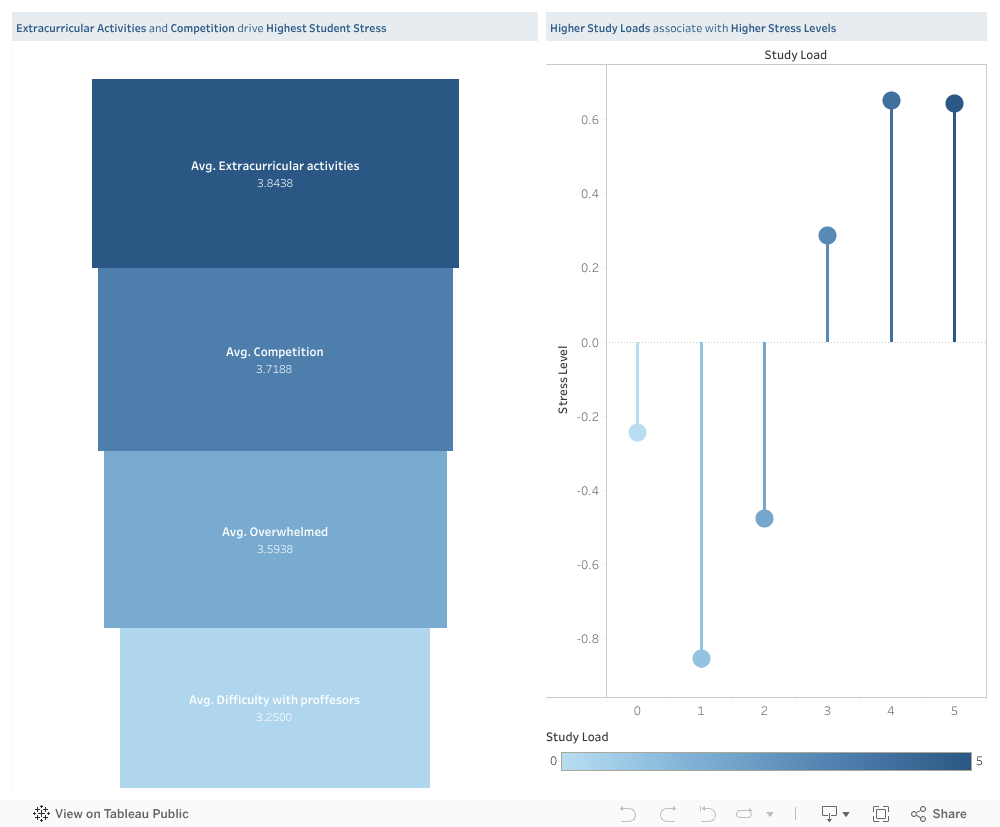
3. Academic load is a major trigger — and not just the amount of work.
The dashboard shows a clear pattern:
- More competition → higher stress
- More difficulty with professors → higher stress
- Feeling overwhelmed → higher stress
- Higher extracurricular activities → highest stress of all
But the real insight is this:
It’s not only how much work students have.
It’s when that work happens.
Deadlines pile up in the same week, tasks overlap, and students end up sacrificing sleep, health, and well-being trying to meet multiple high-stakes demands simultaneously.
This insight became the heart of our solution.
Our Solution: A Shared Academic Load Calendar for AUB
Imagine a semester where:
- Students know what’s coming weeks ahead
- Professors can see when other courses have major deadlines
- Overloaded weeks are immediately flagged
- Departments can plan more fairly
- Stress spikes become predictable — and preventable
Our proposed Shared Academic Load Calendar does exactly that.

It’s a simple idea with a big impact: one place where professors enter deadlines and workload estimates, and a shared, color-coded calendar shows the cumulative load across courses.
For students:
A clear view of their upcoming weeks, no more last-minute shock.
For professors:
A quick way to avoid piling large assessments on the same week as others.
For programs and departments:
A data-backed view of overloaded periods, enabling better planning.
Universities like Sydney, Dundalk Institute of Technology, and Kingston University have already implemented similar systems — and the evidence is clear:
It reduces clustering, improves fairness, and helps students breathe again.
Why This Matters
This project isn’t only about data or dashboards. It’s about the people behind the numbers — the students who push through heavy weeks, juggling stressors we never fully see.
If there’s one message our visualization makes undeniably clear, it’s this:
Student stress is not random, and it’s not inevitable.
It’s structural, and fortunately, structure can be changed.
Our goal is not just to reveal the problem but to spark a conversation about how we can create a healthier, more humane academic environment at AUB.
Because when workload becomes transparent, stress becomes manageable.
When professors coordinate, students gain clarity.
And when data reveals the bottlenecks, universities can fix them.
Explore the Interactive Dashboard
You can interact with the full dashboard here:
Take a minute to explore it — follow the lines, the trends, the colors.
Behind every point is a real student with a real story.
A Final Word
Academic pressure will always exist — but unnecessary pressure doesn’t have to.
If this dashboard can start a conversation…
If the proposed solution can inspire a change…
If one student feels less overwhelmed because their workload is finally balanced…
Then this project has done what it was meant to do.
We owe students more than “you’ll figure it out.”
We owe them structure, transparency, and space to thrive.
And meaningful change begins when we look at the data — and truly listen.

by ahd33 | Nov 23, 2025 | Uncategorized
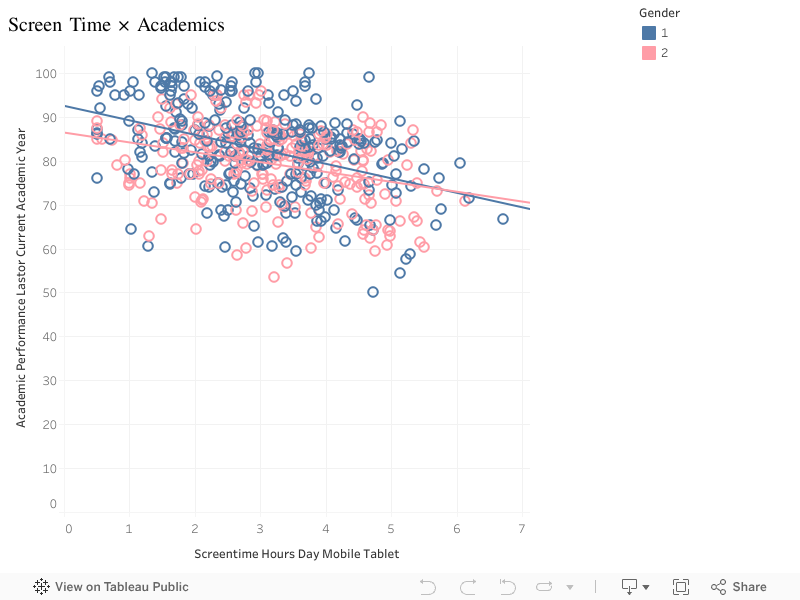
What if the hours children spend scrolling every day are quietly shaping how anxious they feel — and even how well they perform in school?
Using a cross-sectional dataset of Lebanese students aged 8–14, this analysis explores the relationship between daily screen time, anxiety, gender, outdoor play, and academic performance.
1. How Much Screen Time Do Children Get?
Most students spend 2–4 hours/day on mobile or tablet devices, but a noticeable group reaches 5–7 hours. This suggests a segment exposed to high digital consumption.
2. Anxiety Levels Are Widely Spread
Anxiety scores range from 10 to 100, with most students clustering around 40–55. A significant minority shows severe anxiety.
3. More Screen Time = More Anxiety
A clear positive correlation emerges:
As screen time increases, anxiety rises across both boys and girls.
This relationship remains strong even when controlling for age.
4. Gender Differences Are Small but Present: Girls show slightly higher anxiety and slightly higher screen time. But the trend lines for both genders are almost identical — meaning screen time, not gender, is the main driver.
5. Anxiety Reduces Academic Performance: Students with higher anxiety tend to have lower academic scores, with a noticeable decline past anxiety scores of 60.
6. Screen Time Reduces Academic Performance (Slightly): More screen time is associated with lower grades, although the effect is weaker compared to anxiety.
7. Outdoor Play Offers a Small Protective Effect: More outdoor playing hours slightly reduce anxiety, suggesting a helpful intervention.
Conclusion
Across the dataset, a consistent pattern emerges:
More screen time → higher anxiety → weaker academic performance.
Encouraging even small reductions in daily screen use — or adding more outdoor time — can help protect children’s mental well-being.

by acs12 | Nov 21, 2025 | Dashboard
When I think back to my early years in school, the lessons were simple. A chalkboard, a few markers, and a teacher doing their best while the electricity flickered in the background. A class would finally settle, a discussion would gain momentum, and the lights would cut without warning. We’d sit in the dim room, the fans would suddenly stop, and we were left waiting for the power to return, trying to remember where the lesson left off. Those interruptions were part of the experience, so common that no one questioned them.
As the years passed, classrooms began to modernize. Projectors arrived. Computer labs appeared. And eventually, interactive dashboards took their place at the front of the room. These dashboards became a source of excitement; they felt like a step into the future. Teachers redesigned lessons around them, students leaned closer to the glowing screens, and the whole school seemed to believe that this was the solution we had been waiting for. Finally, technology was here to fix what had long been broken.
But the interruptions stayed. The dashboards froze mid lesson, the Wi-Fi collapsed at the wrong moment, the electricity cut just as the new tools were beginning to make a difference.
The technology advanced, yet the experience stayed strangely familiar. The same pause, the same silence, the same loss of rhythm. It became clear that the issue had never truly been the tools themselves, it was whether they could stay on long enough to be useful.
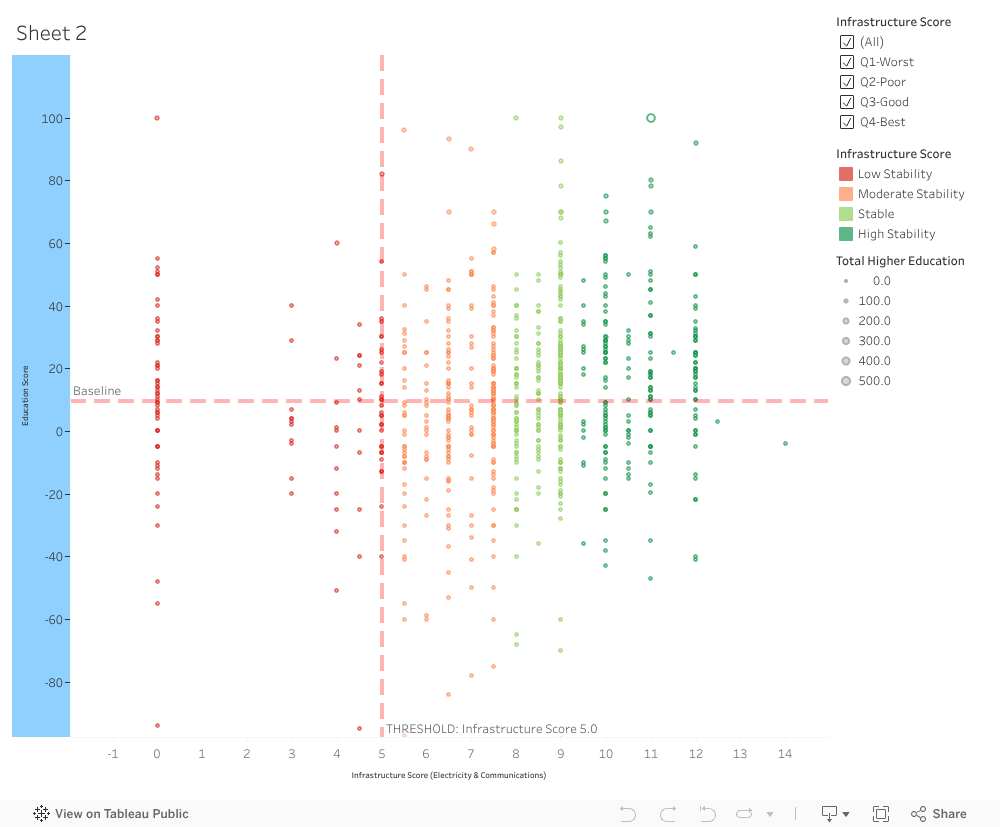
That memory followed me when analyzing towns across Lebanon, I saw the same pattern we lived in classrooms: places that seemed equipped still struggled, while others managed with far less. At first glance, the landscape looked scattered and contradictory.
But something shifted when the focus switched from the presence of infrastructure to its stability. Suddenly, the picture made sense. Towns where electricity stayed on, even modestly longer, began to show noticeably stronger educational outcomes. Where the internet didn’t collapse, lessons actually reached their end. Where systems held together, learning had the space to take shape.
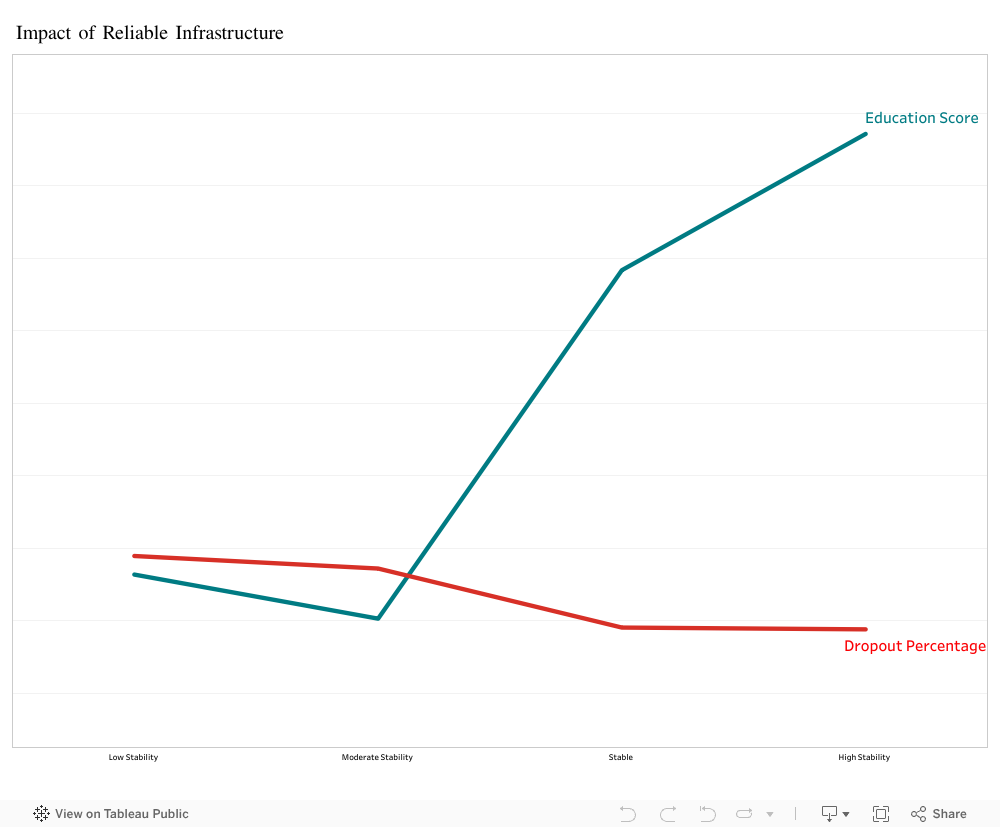
We can see how dramatically education improves the moment infrastructure stops stalling. The rise is immediate. The difference is visible. And beyond a certain point, adding more tools doesn’t change much, what matters is that the existing ones work reliably.
It reminded me of all the classrooms I’d sat in. From chalkboards to dashboards to online lessons, the tools changed, yet the experiences rose and fell with the stability behind them. Two schools could have the same equipment and the same ambitions, but if one lost power twice a day, the outcomes were never going to match.
That is why the solution is not about installing more dashboards or building more facilities. It’s about making sure the systems already in place function consistently. When electricity stays on and connections hold, students engage differently, teachers teach differently, and the promise of modern tools finally becomes real.
Education doesn’t move forward just because technology arrives. It moves forward when technology stays alive long enough to matter.
And when I look back at the classrooms I grew up in, and the classrooms students sit in today, the story feels unchanged in one important way: progress has never been limited by how much we have, it has been limited by how reliably it works.

by mwa47 | Nov 18, 2025 | Visualization
The Pain Point of Lebanese Students in Rural Areas
Across Lebanon, thousands of students finish high school each year with the hope of continuing their education. But for many, the journey to higher education is shaped by something they cannot control: where they live. While universities play a critical role in expanding economic opportunities, boosting mobility, and stabilizing communities, access to higher education is not equal across regions.
To understand this imbalance more clearly, I mapped the distribution of universities across all Lebanese governorates. The picture that emerges reveals a structural challenge that often goes unnoticed.
A Landscape Centered Around Beirut
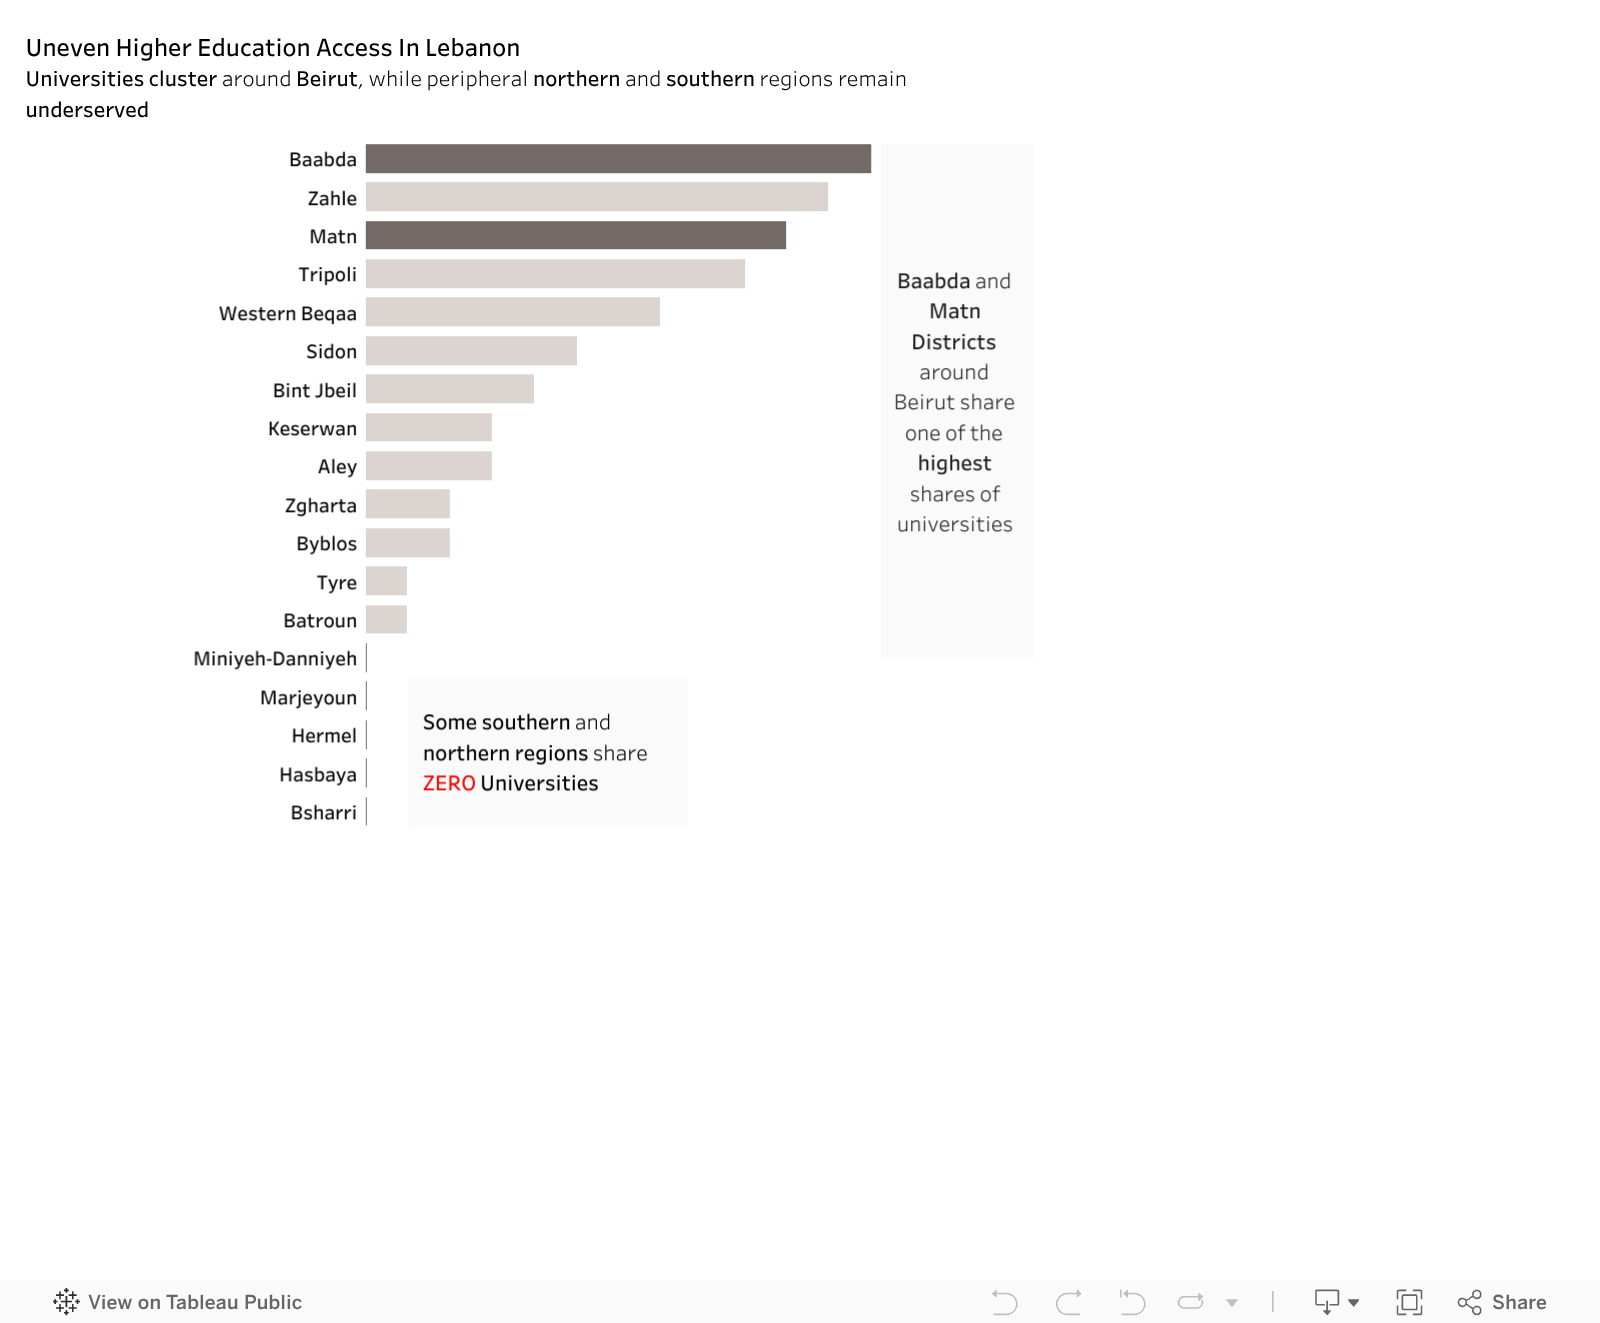
The visualization below illustrates how universities are clustered around Beirut and its surrounding districts.
Baabda, Zahle, and Matn stand out with the highest shares of institutions, forming a dense academic hub that benefits students living nearby.
These areas offer abundant choices, shorter commutes, and reduced financial burdens — all of which make higher education more accessible and attainable.
Regions Left Behind
However, as we move farther from the center, the educational landscape changes dramatically.
A number of northern and southern districts show extremely low—or even zero—shares of universities. Districts like Minieh-Danniyeh, Hermel, Bsharri, and Hasbaya have no universities at all.
For students living in these areas, pursuing higher education often means:
-
Long daily commutes
-
Relocation to other districts, which adds significant cost
-
Or, in many cases, giving up on the idea altogether
This geographic barrier creates a hidden form of inequality. Two students with the same abilities and aspirations may face completely different realities simply because of their district of residence.
Why This Matters
Educational access is more than a convenience — it shapes economic mobility, future job opportunities, and community development. When entire districts lack higher education institutions, the impact extends beyond individual students:
-
Local economies miss out on the vitality that universities bring
-
Youth migration toward central districts increases
-
The development gap between regions widens
These patterns highlight the importance of understanding the current distribution of universities across Lebanon, not to criticize, but to identify areas where investment could have the greatest impact.
Moving Towards More Inclusive Access
The story told by the data is clear: Higher education opportunities remain centralized, leaving many peripheral regions underserved. While Lebanon faces numerous challenges, expanding access to education is one opportunity that can create long-term, positive change.
By recognizing where academic infrastructure is lacking, policymakers, NGOs, and educational institutions can work toward:
-
Supporting underserved districts
-
Encouraging balanced regional development
-
Ensuring that more Lebanese students, regardless of location, can access higher education
Ultimately, the goal is simple:
A country where students’ futures are shaped by their talents — not by their distance from Beirut.

by sja49 | Nov 18, 2025 | Uncategorized
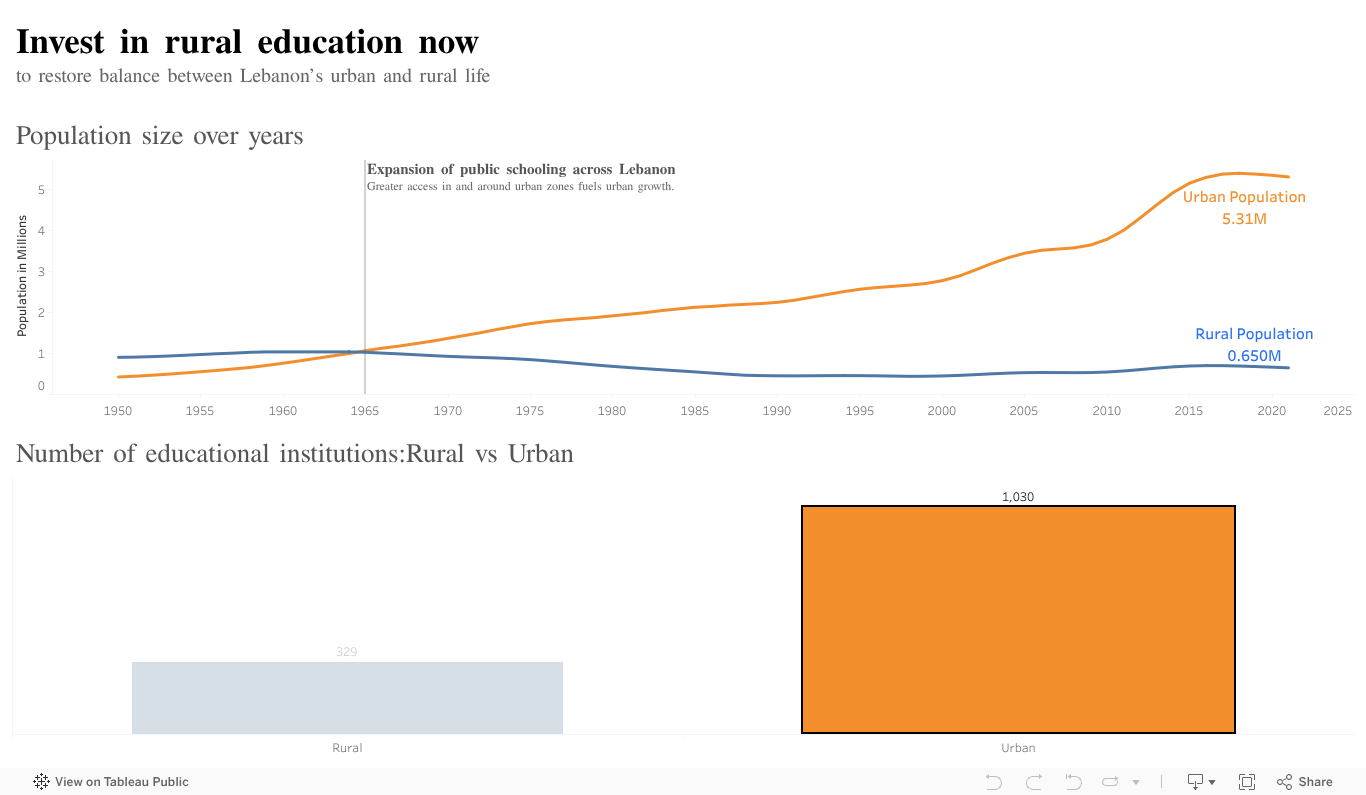
Before 1965, Lebanon looked very different; cities and villages grew side by side, both full of life, people, and stability. Urban and rural areas each had approximately 1.04 million people.
After 1965, Lebanon began facing one of the most dramatic population shifts in its modern history. Every year, cities grew more populated, while rural villages became quieter. Today, about 5.31 million people reside in cities, with only over 0.65 million live in rural areas. This change is just too significant to be accidental.
This raised an important question: what pushes people to relocate to cities? As we analyzed the data, one element emerged repeatedly: Education. Schools and universities are primarily concentrated in urban regions. When education becomes centralized, so does opportunity, and families follow along.
Cities continued to receive more people than they could fairly support, until traffic, exorbitant rents, overcrowded hospitals and schools, and job competitiveness became daily issues. Meanwhile, rural villages lost young people, businesses collapsed, agriculture stagnated, and cultural traditions disappeared. If nothing changes, this gap will increase much further, making it incredibly difficult reversing it later.
The outcome, however, can be very different. If rural communities provide strong and accessible education, families will no longer feel compelled to relocate.
Building new educational institutions outside of large cities, boosting the quality of existing rural schools, and increasing access through transportation and online learning can all help to transform rural areas into places of opportunity. Progress can be validated by tracking enrollment, graduation rates, and attendance trends.
When rural education becomes strong and accessible, the map of Lebanon changes: cities grow at an appropriate pace, while villages regain life rather than fading. This is why Lebanon’s 2026 strategy should prioritize rural education. Investing in rural education now means committing to a future in which both cities and villages prosper, and every child has the opportunity to excel without having to leave home.