In the spirit of collaboration, the incredible individuals behind this project:
Anthony Aramouny
Ghassan Shammas
Malak Wehbe
Mohammad Abdul Rahman
Rawad Abi Zeid
Zeinab Mortada
Prices Variation Rational
Commodities price variation in Lebanon has been the center of many socio-economic activities and concerns in the past 2 decades. In fact, notwithstanding the underlying concept of inflation (or deflation), the issue has a deep social stability construct: Food security for the poor and the poorer. No matter what the GDP is per capita, it is essential to understand that when commodities prices vary a substrate of the Lebanese society feels the impact much stronger than others: those below the line of poverty.
The Problem
Relying on the data published by www.humdata.org on the yearly prices of goods in Lebanon, it is clear that the consumer encounters prices variation, within the same period of time between the different regions in Lebanon. This is clear in the visuals published below.
We believe that the problem resides in the following issues:
Lebanon lacks sufficient personnel involved in the prices control at the economy of economy and trade.
It has Limited reach on price controls and prices ceiling.
It Lacks specialized domestic food security experts.
It lacks total agricultural programming to supplement the market with commodities in crisis.
It lacks cheap national transport routes for bulk products such as railways. The cost of transport may exceed 30% of the final cost of a commodity.
Details
It is necessary to divide the time series into 3 periods:
From 2012 to October 2019 i.e. precrisis period
From October 2019 until end of 2021 (crisis period with subsidized goods)
2022 until now, post crisis and post subsidies.
The banking and financial crisis in Lebanon imposed mainly two constraints on the food security issue: i) the strong volatility of the exchange rate against a fixed low official rate of LB1500/$, ii) a subsequent spiraling inflation rate that was strongly reflected on the prices of goods in the country.
Meanwhile, during the first 2 years of the crisis, the government had subsidies on fuel and its derivatives, wheat and bread and some other commodities. The subsidies were lifted during 2021, and the prices were” floating”. For a short period of time, the prices oscillated without any rational and later stabilized due to the rapid dollarization of the retail market: The Lebanese Pound became almost obsolete, superseded by the US$ as a cash for retail transactions. It is to be noted that the salary of the public sector is still indexed to the “old” Lebanese pound exchange rate and hence the public servant are actually those who suffer the most the impact of price variation in Lebanon. Explore Our Interactive Dashboard below: For a more in-depth look at our project, we invite you to explore our interactive dashboard. It’s designed to provide you with detailed analytics, and visual insights into our work.
We value your thoughts and feedback! If you have any questions, comments, or insights, please feel free to share them in the comment section below.
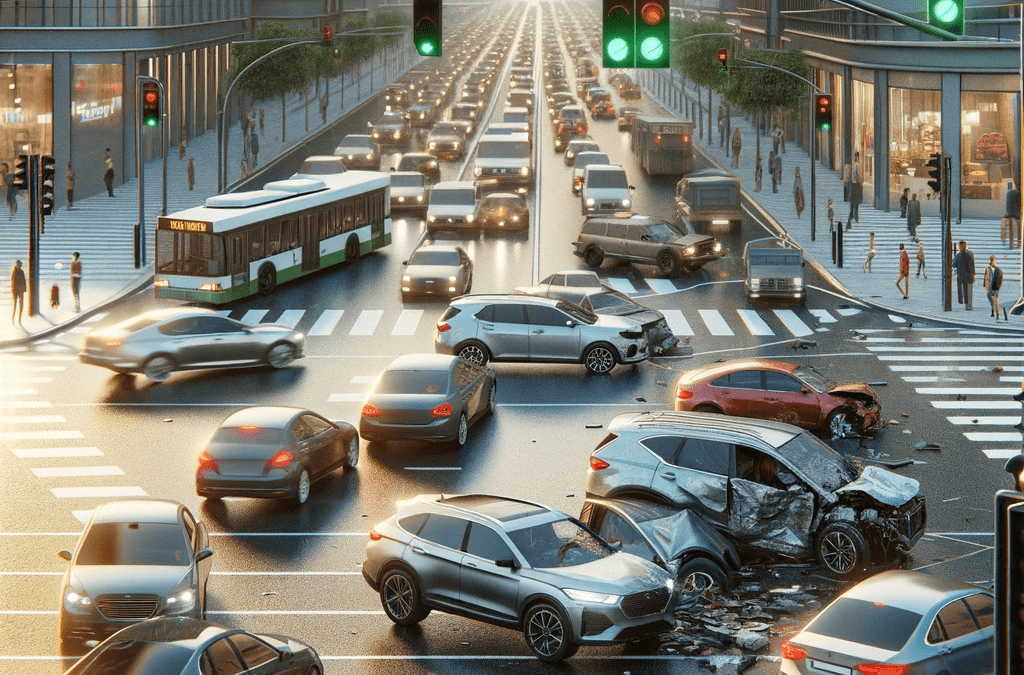
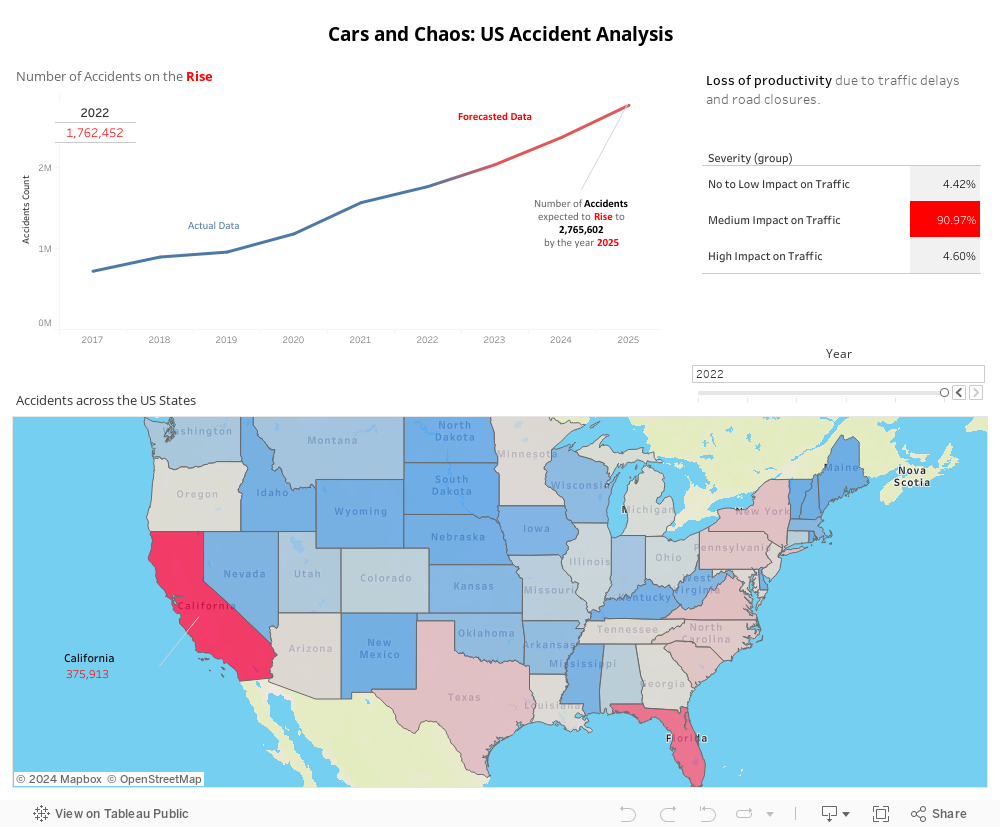
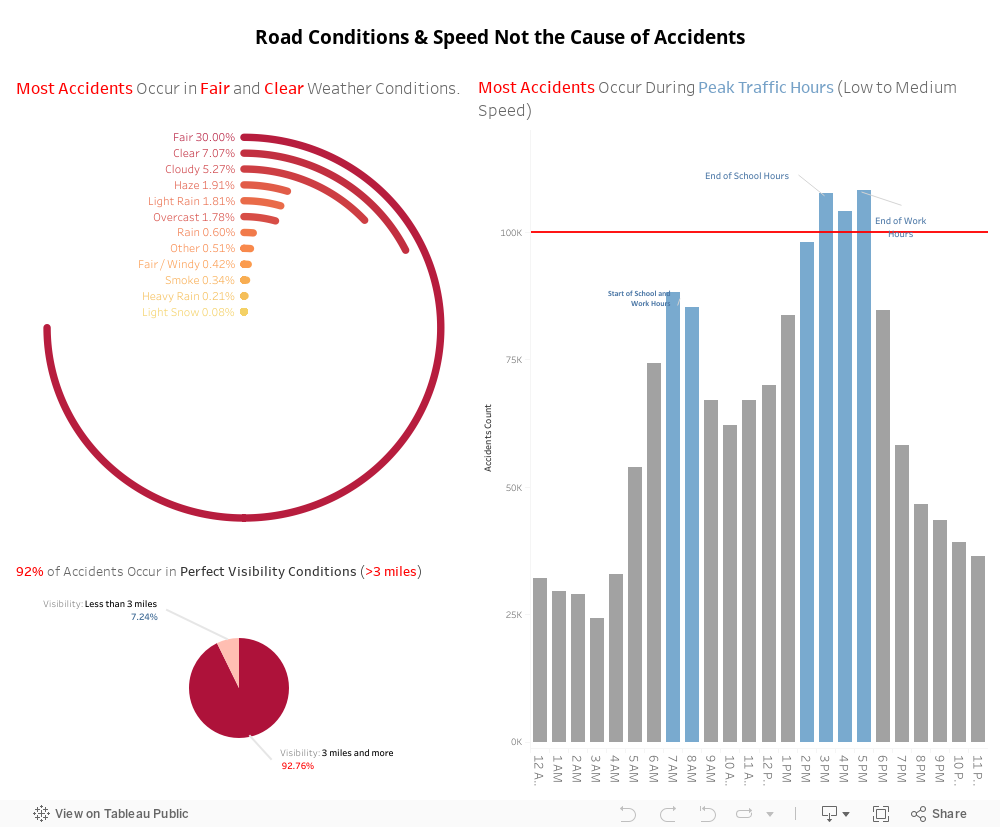
The rise in traffic accidents in the United States poses a critical threat to public safety and disrupts the efficiency of road networks. This trend not only jeopardizes lives but also undermines the reliability of the transportation system, leading to unpredictable and dangerous road conditions. Additionally, these frequent incidents have significant economic implications, straining resources and impacting the broader economy. In 2019, the National Highway Traffic Safety Administration (NHTSA) estimated the economic cost of motor vehicle crashes at $340 billion, nearly 2% of the U.S. GDP. Beyond immediate costs, these accidents strain emergency services and disrupt the transportation of goods, affecting productivity. The current state of road safety in the U.S. presents a significant challenge, with 1.7 million traffic accidents recorded in 2022, with the majority recorded in California. This alarming figure is not just a standalone concern; it is projected to escalate to an estimated 2.7 million by 2025. Such an increase not only signifies a growing risk to public safety but also hints at underlying issues in traffic management and driver behavior. The most telling evidence of this problem is its direct impact on traffic flow. Approximately 80% of these accidents significantly disrupt traffic, leading to delays, increased travel times, and economic costs associated with lost productivity.
Factors Behind US Traffic Incidents
When addressing the challenge of road accidents, a critical first step is identifying the root cause, which literature suggests can be attributed to either Road Conditions or Driver Behavior. Analyzing the data reveals a notable trend – a significant proportion of accidents occur in optimal weather conditions, free from rain or snow that could compromise traction. Equally, visibility does not emerge as a primary factor, with over 90% of accidents transpiring when visibility extends beyond 3 miles. Intriguingly, the majority of accidents unfold during peak traffic hours, indicating a prevalence of low to medium-speed collisions. Importantly, the data suggests that road design is not a predominant issue in these accidents. This underscores the imperative of delving into driver behavior as a key focus for addressing and mitigating the high frequency of road accidents.
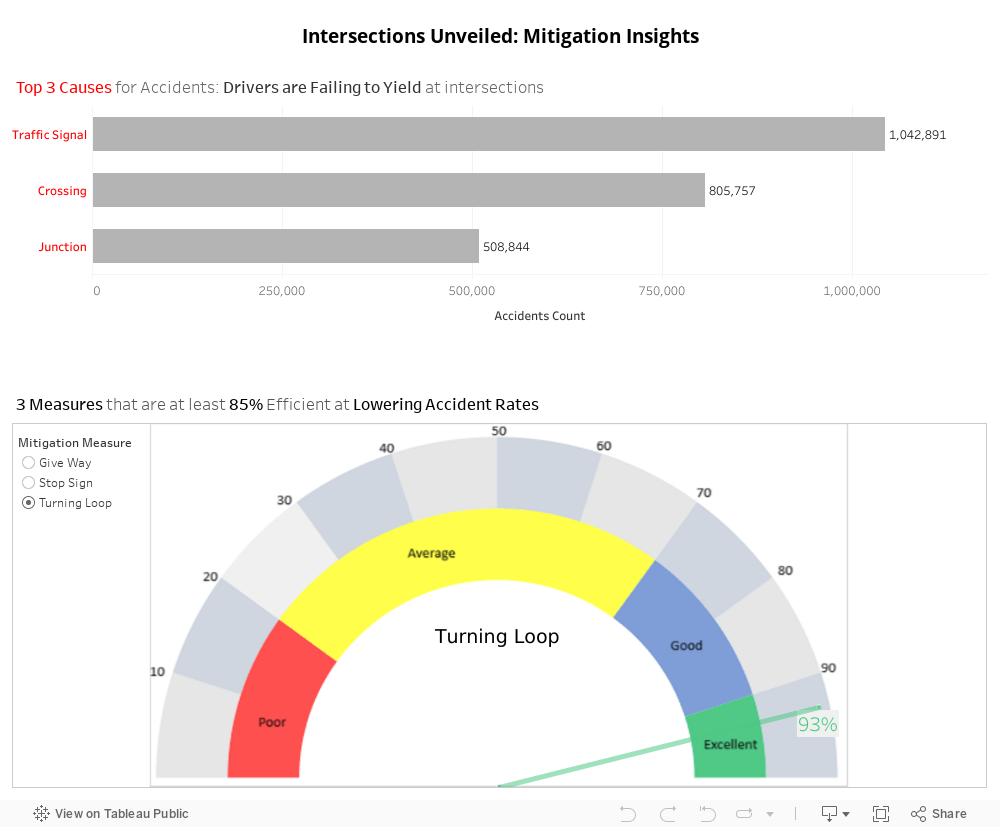
The majority of accidents unfold at key intersections—stop lights, junctions, and crossings—marked as conflict points. These areas pose heightened risk as drivers executing left or right turns must seamlessly merge with oncoming traffic while yielding to vehicles with the right of way. To address this challenge, various mitigation measures can be implemented. Introducing turning loops, employing stop signs, and incorporating give-way protocols are among the strategies aimed at enhancing the safety of these critical points. These measures are designed to streamline traffic flow, clarify right-of-way assignments, and ultimately contribute to a reduction in accidents at these high-risk locations by reducing the need for decision-making by the driver.
Recommended Mitigation Measures
To address the escalating issue of car accidents, particularly those stemming from complex driver decision-making at intersections, a targeted approach is recommended. This approach involves implementing specific traffic management solutions designed to simplify the decision-making process for drivers, thereby reducing the likelihood of accidents. The key elements of this strategy are as follows:
1. Turning Loops:
Purpose: Turning loops, also known as dedicated turning lanes, provide a designated space for vehicles to make turns without disrupting the flow of through traffic.
Implementation: These loops are often marked by dedicated lanes with clear signage, allowing turning vehicles to enter and exit the flow of traffic more safely.
Efficiency: Turning loops have demonstrated a high efficiency rate of 94%, making them a highly effective solution for managing turning movements at intersections.
2. Stop Signs:
Purpose: Stop signs are effective in controlling the movement of vehicles at intersections, ensuring that drivers come to a complete stop and yield to oncoming traffic before proceeding.
Implementation: Placing stop signs at appropriate points within an intersection helps regulate traffic and minimizes the risk of collisions, especially in situations where the right of way needs clarification.
Efficiency: Stop signs exhibit a commendable efficiency rate of 90%, proving to be a reliable means of directing traffic and minimizing conflicts.
3. Give Way Protocols:
Purpose: Give way markings and rules dictate which vehicle has the right of way, helping to prevent conflicts between turning and oncoming traffic.
Implementation: Clearly marked give-way lines and signs indicate where drivers must yield, promoting smoother merging and reducing the likelihood of accidents caused by confusion regarding right-of-way rules.
Efficiency: Give-way protocols have demonstrated an efficiency rate of 86%, contributing significantly to the orderliness and safety of intersections.
In addition to the above insights derived from the analysis of the data at hand, we sought the opinion of technical experts. The work was presented to a group of transportation engineers at Dar Al-Handasah for technical validation on the proposed mitigation measures. The engineers (Marwan Younes, Elie Beyrouthy, Rami Tawk, Elena Abi Aad, Lea Braidy, Tarek Tawouk) have worked on road design projects in Europe, USA, Africa, Arabian Gulf Countries and many more. The team confirmed that, when implemented in compliance with existing codes and standards, these measures would indeed reduce the number of accidents and lead to a safer road network with minimal infrastructure and road layout changes making them cost effective.
These measures collectively represent a cost-effective approach to traffic management. Their implementation, involving relatively simple infrastructure changes like signage and road markings, is less costly compared to more extensive road modifications. The practicality of these solutions lies in their simplicity and effectiveness, making them easily adaptable to various traffic scenarios and beneficial for drivers, pedestrians, and the broader community by creating safer, more efficient road environments.
Car accidents remain a significant concern across the globe, negatively affecting many lives daily, which shows the need for continuous efforts in ensuring road safety. Annually, the toll of car accidents in France highlights a critical need for detailed analysis and proactive measures that would help tackle this issue and mitigate the risks that citizens, whether drivers, passengers, or pedestrians, face daily. France has 55% more deaths per inhabitant than Germany in 2019. Specifically, France experienced 52 deaths per million inhabitants due to traffic accidents, compared to Germany’s 34.
The proposed solutions will target an audience in charge such as government agencies related to transportation and safety sectors, road safety advocacy groups, and urban planners and infrastructure developers. Government agencies can leverage our findings to inform policy and safety measures. The urban planners and infrastructure developers will be provided with data-driven directions to design safer roads and intersections, focusing on the weak points of where accidents are most likely to occur. Lastly, road safety advocacy groups will be able to utilize our insights to focus on effectively enhancing their campaigns.
Geographic Patterns of Accidents in France:
This data paints a detailed picture of where accidents are most frequent within France. Certain regions, perhaps due to higher traffic volumes or challenging driving conditions, show elevated accident rates. This geographical analysis is pivotal in directing safety measures to where they are needed most.
Trends:
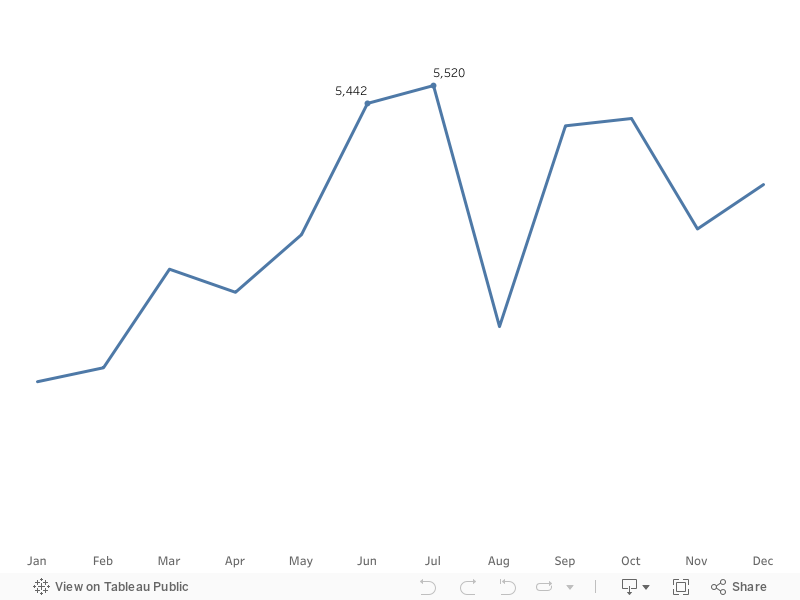
Seasonal Trends:
Road safety is a critical issue that affects communities across France. In 2019, these incidents inflicted injuries and claimed lives which raised serious concerns about the factors contributing to their occurrence. From the severity of injuries sustained by different road users to the risks associated with specific driving maneuvers, the data displays a concerning picture. Moreover, the difference in outcomes for those wearing seatbelts and helmets versus those who do not bring to light the vital role of safety measures. This section will explore the problem of traffic accidents in France, using visual evidence to illustrate the scope and impact of this pressing issue.
We saw more car crashes in the summer, especially in June and July. This is probably because lots of people are traveling for their summer breaks, and there are many visitors who don’t know the roads well. Summer is also a time for big parties and festivals where people might drink alcohol, which can lead to more accidents. Roads get really busy, and sometimes safety rules are forgotten, which makes it more likely for accidents to happen.
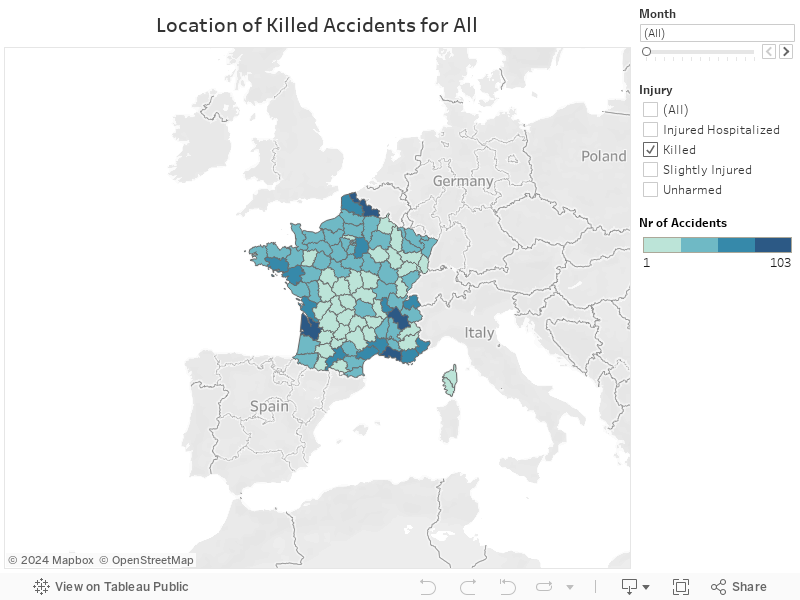
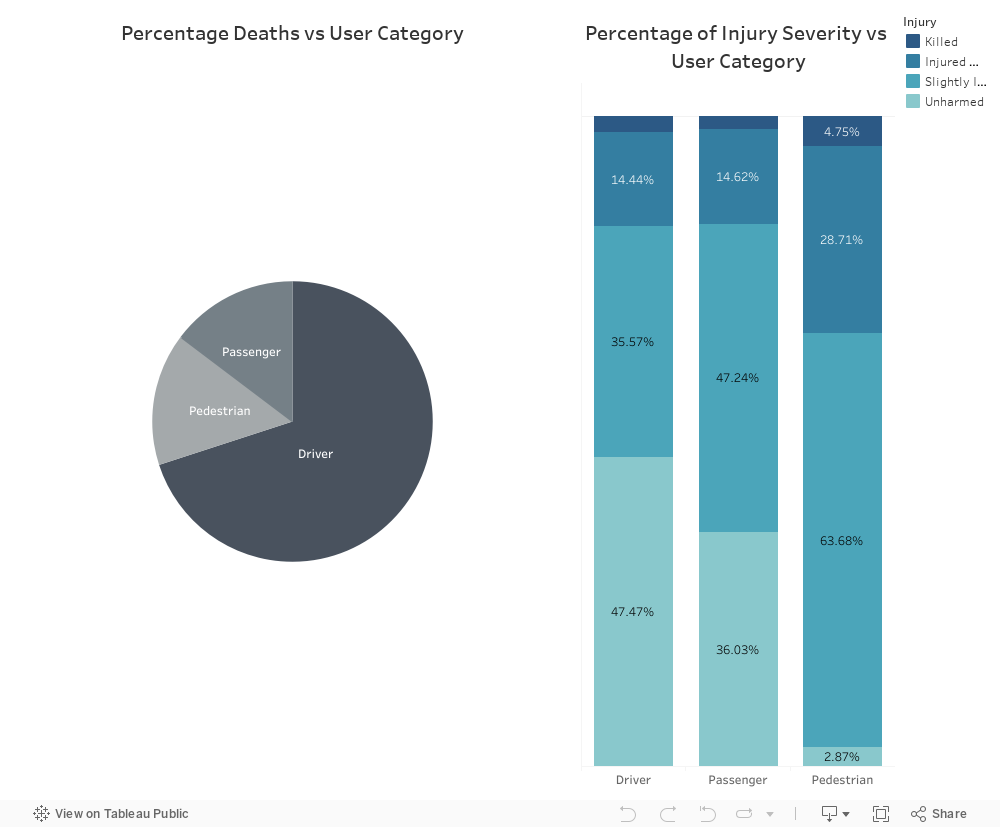
Fatal Outcomes by Road User Type:
In 2019, the landscape of traffic accidents in France presented a cruel picture, particularly in terms of injury severity. As our visual analysis reveals, drivers constituted most of the affected individuals, accounting for 70% of deaths, while passengers and pedestrians accounted for 15%. The data indicates that drivers are most often killed underscoring the considerable risk associated with driving. Pedestrians, though fewer, face a considerable rate of serious rate of deaths and injuries per accident, due to the lack of protective barriers during accidents. This information underscores the need for robust safety measures and targeted interventions to protect all road users.
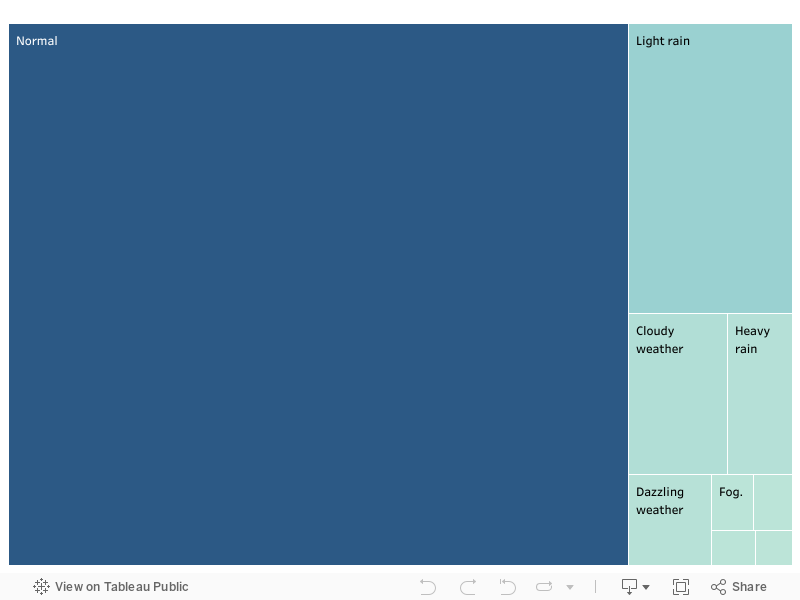
Weather Conditions:
It is well known that weather can have a major impact on road situations. It is something logical where accident occurrences are challenging to control, especially in extreme weather conditions. Since the majority of accidents happen in normal conditions (due to normal weather being more probable than other conditions) it is an advantage to us as we can control other conditions.
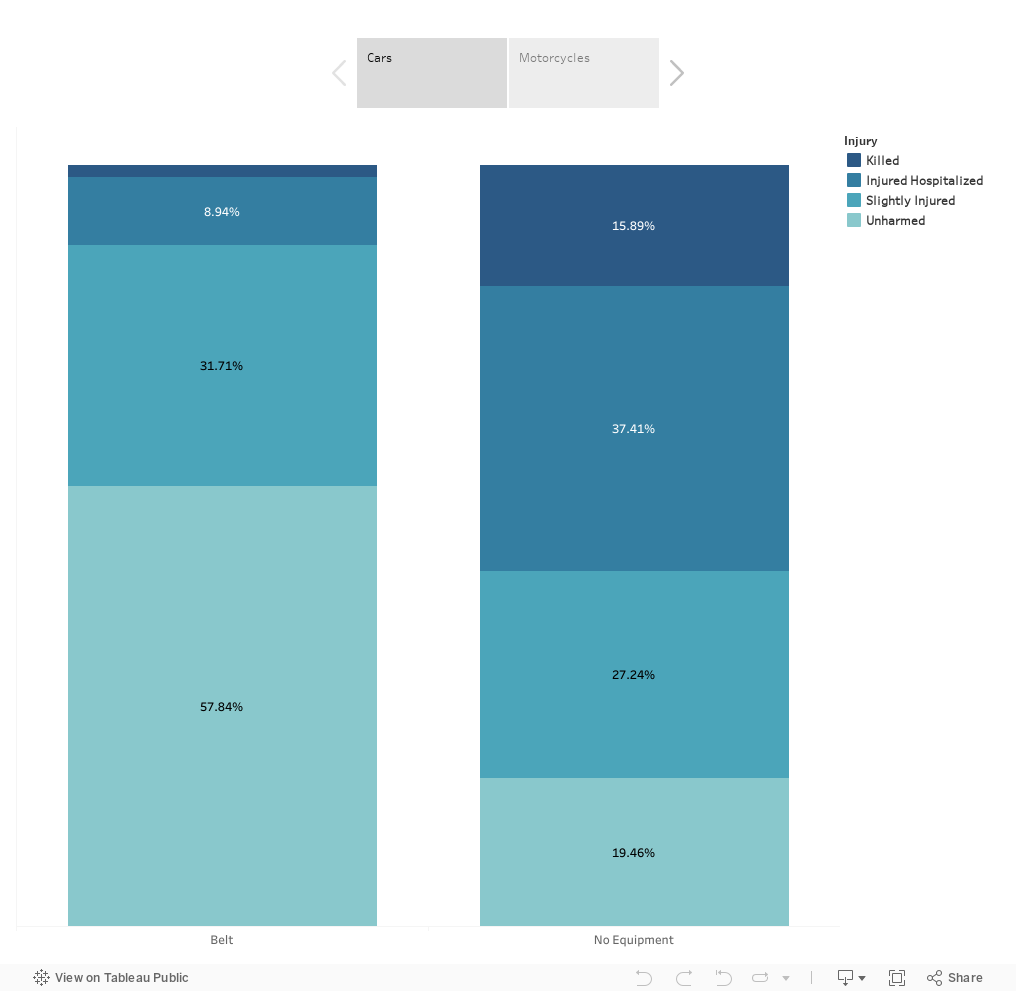
The Life-Saving Role of Safety Equipment:
The analysis starkly shows the difference safety equipment can make. In France, the use of seat belts and helmets is shown to drastically reduce the severity of injuries in accidents. This serves as a powerful reminder of the importance of wearing safety gear.
Seat Belts Save Lives: According to the World Health Organization, the use of safety belts by front-seat passengers reduces the risk of fatal injuries by 45 to 50 percent. For back-seat occupants, the risk of death and serious injuries is reduced by 25 percent. In France, since 1973, wearing seat belts in the front seat is mandatory. Compliance with this law varies between 60 to 90% depending on the road type. If seat belts were not worn by front seat occupants, there would be a 55% increase in fatalities. Conversely, if seat belts were consistently used by all occupants in a vehicle, fatalities could be reduced by an additional 30%.
Helmets for Bikers: Motorcycle helmets are 67% effective in preventing brain injuries. Riders without helmets are more than three times as likely to suffer a brain injury compared to those who wear helmets.
Rules and Wearing Safety Gear:
Police Enforcement: Police play a key role in ensuring compliance with safety gear regulations. Through traffic stops, checkpoints, and regular patrolling, they check if drivers and riders are wearing seat belts and helmets, as required by law. This enforcement encourages consistent use of safety gear.
Awareness and Penalties: Alongside enforcement, awareness campaigns about the importance of safety gear and the penalties for non-compliance further encourage adherence to these rules. Understanding the life-saving benefits of seat belts and helmets motivates more people to use them.
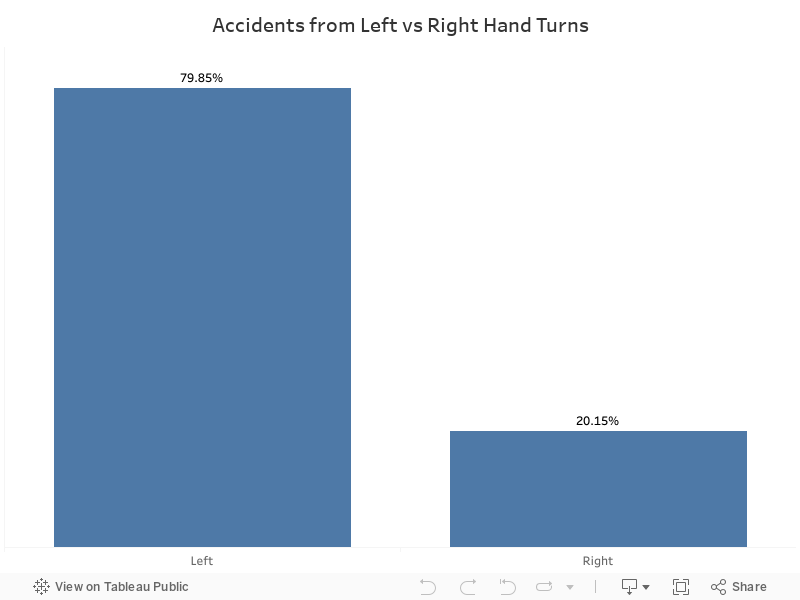
Left vs. Right Hand Turns:
Left-hand turns appear to be particularly hazardous, leading to more accidents compared to right-hand turns. This finding could influence traffic management policies and the design of intersections to enhance driver safety.
Left Turns Are Riskier: In France, during 2019, car accidents often happened more during left-hand turns than right-hand turns. This is because left turns are usually trickier. Here’s why:
More Traffic to Watch: When you turn left, you have to look out for cars coming both ways. This means you have to check more places before you turn.
Harder to See: Sometimes it’s harder to see if it’s safe to turn left. Cars coming straight towards you can be hard to judge, especially if they’re moving fast.
Crossing Paths: Turning left means crossing the path of oncoming cars. This is riskier than turning right, where you don’t cross traffic.
Timing is Tough: You need good timing to turn left safely. If you turn too soon or too late, it can cause an accident.
To wrap this up, let us take a closer look at the lessons we learned from looking at car crashes in France for 2019. From what we’ve seen, it appears that doing some simple things can help keep us safe on the roads.
To begin with, seatbelts are amazing. They keep so many people from getting hurt if there’s a crash. It’s like having a superhero’s shield right in your car. And then there’s the weather. Driving can be difficult in the rain, snow, or even too much sun, which may result in accidents. We must be extra careful when the weather is bad.
We also observed that driving behavior, such as speeding or lack of focus, can have a significant impact. We all share the road, so we all need to drive like we care about the person in the next car or walking across the street.
Now, what do we do with all this? We talk about it, at school, at work, and at home. We make sure everyone knows how important it is to drive safely, wear seatbelts, and watch the road. We make sure the police are watching out for drivers who cause a risk to others, and we call on local communities to install improved streetlights and signage.
But there’s more we can do, too. We’ve got three big solutions:
Better Roads: We need roads that are easy to drive on, with clear signs and safe spots to walk and cross.
Stronger Traffic Laws: Rules that make sense and that everyone knows, ensuring that no one is speeding or messing around.
Awareness Campaigns: Let’s use entertaining and memorable methods to educate people about traffic safety.
Let’s make this report start a conversation that keeps going. Every time we get into a car or cross the street, let’s remember what we learned. If we all do our part, with better roads, clear rules, and good tips on staying safe, we can make our roads places where everyone gets to where they’re going, no trouble.
Team members: Mahmoud Jachi, Ali Korkomaz, Mehdi Atris, Taima Kelani, Hussein Dakroub, Mohamad Ayoub
In an era marked by a rapid exchange of information and digital connectivity, our attention spans have undergone a notable transformation. From an average of 150 seconds in 2004 to a mere 47 seconds in 2020, the ability to sustain focus has become a precious commodity. This shift carries far reaching implications, impacting not just our productivity but various facets of our lives. The ramifications of this decline are many such as decreased productivity, wasted time, disruptions to sleep, effects on mental health, and potential impacts on career opportunities.
In this blog, our focus will be directed towards concentration levels of university students in Lebanon. We will unfold the primary reason behind this decline and recommend a significant solution to address these challenges
Increase of social media users:
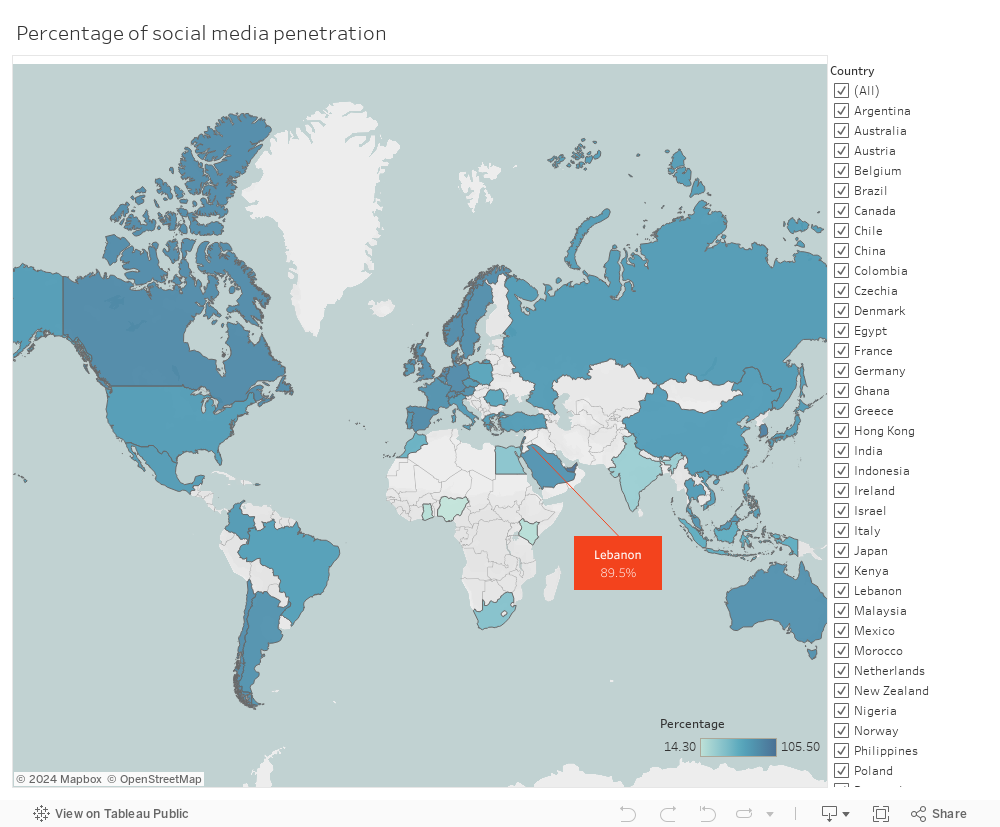
In a society dominated by social media and a tendency to immediately check notifications upon waking up, we’re confronted with a plethora of mental health challenges. Based on data from Statista, the percentage of social media users from total population has been gradually increasing since 2017 reaching over 4.59 billion users as of 2023, which accounts for 57% of the entire world’s populationusing various social media applications such as Instagram, Facebook, WhatsApp, Twitter, Snapchat, TikTok, YouTube, Reddit, and Discord. Social media penetration, which represents the percentage of social media users per population, seems to be at a high in Lebanon with a value of 89.5% in 2023. This means that the majority of the Lebanese population is using social media. Such a high penetration rate implies that social media has become a significant part of daily life for a large portion of the Lebanese population
Repercussions of social media: High distraction rate
Given the increase in the use of social media apps, and the high social media penetration in Lebanon, we surveyed 280 responses to study the effect of social media on university students in Lebanon.
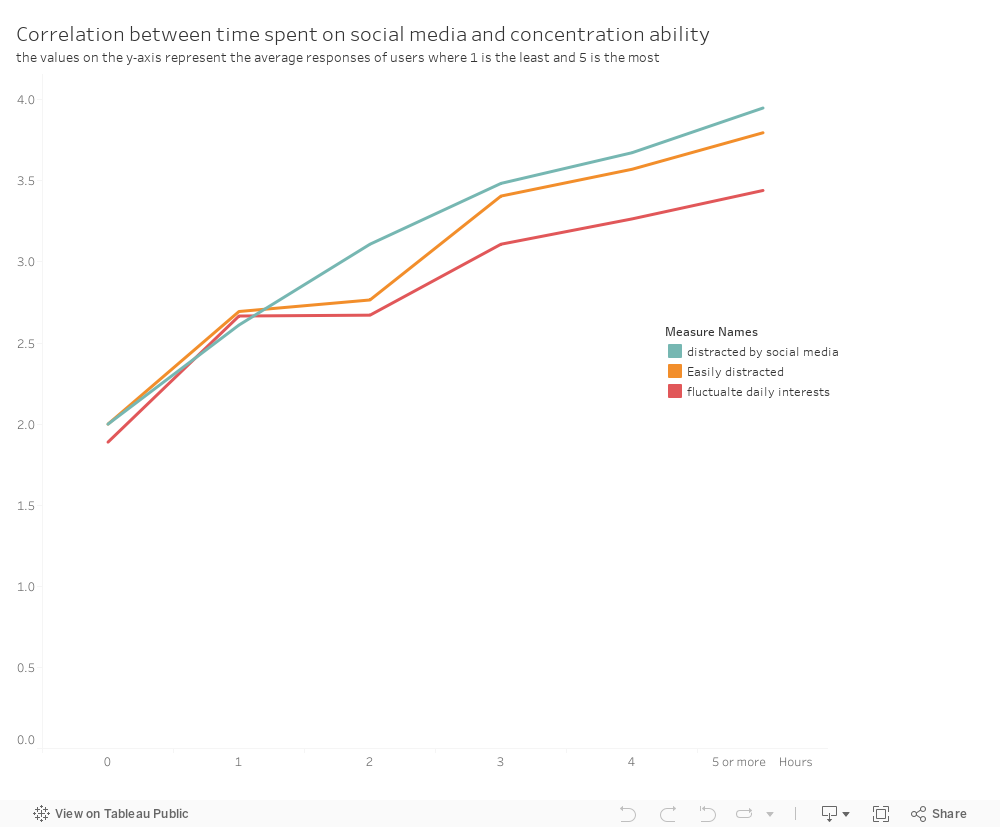
The survey line chart visualization represents the answers of 3 main questions which are in respect to the number of hours spent on social media:
How often do you get distracted by Social media when you are busy doing something?
How easily distracted are you?
How frequently does your interest in daily activities fluctuate?
The above graph showed a positive correlation between between the amount of time students spend on social media and their likelihood of getting distracted. Those who dedicate more hours to social media tend to encounter increased levels of distraction. This heightened distraction, in turn, leads to fluctuations in their interest levels in various daily activities which includes studying.
Remedies: Pomodoro technique
The Pomodoro technique is a technique involving taking intervals of time to study and rewarding yourself at the end of these intervals (25 minutes, 50 minutes). During the 25 minutes, individuals commit to completing their tasks and maximize their concentration by silencing/ turning off notifications, closing unnecessary tabs, and creating a study-friendly environment.
Rewards for completing a Pomodoro session come in the form of leisure time which is often spent on social media. This technique represents a form of delayed gratification that through routine makes it easier to focus on the task at hand. The technique is supported by the science of evolutionary biology which states that the human brain states in a state of alertness to avoid looming threats. Hence deactivating and reactivating the brain helps restart your body’s internal focus timer.
Pomodoro effectiveness
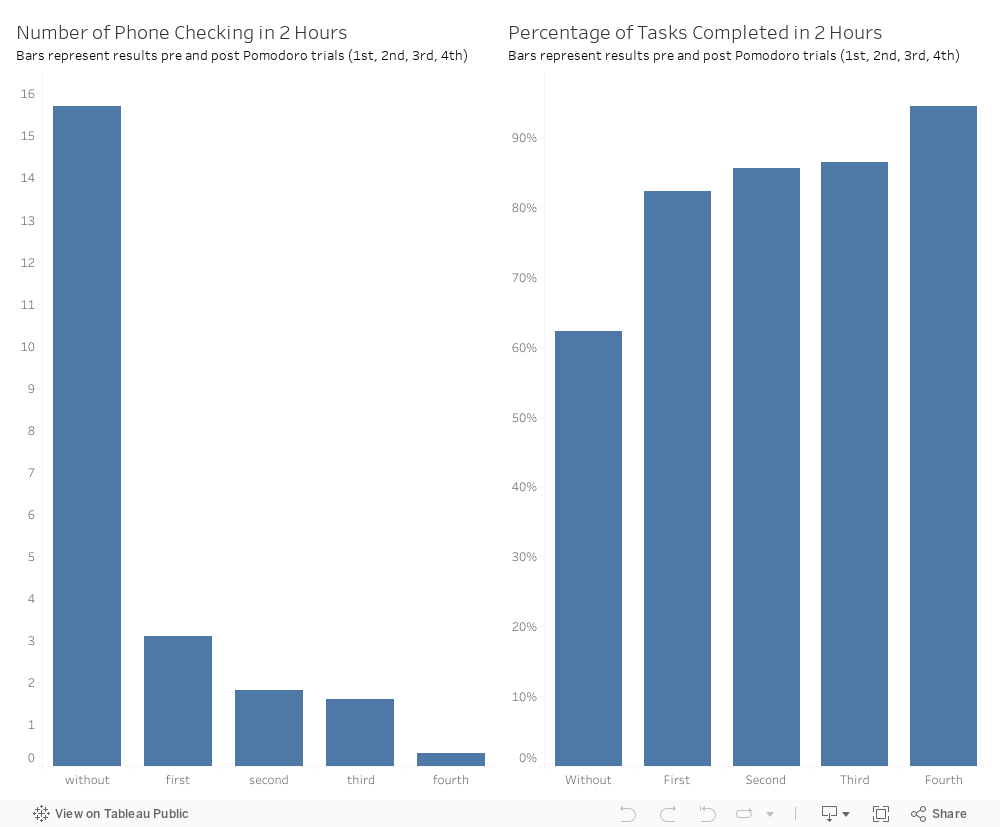
To prove the effectiveness of this technique, we conducted an experiment on a group of university students were we tracked the number of phone checking in 2 hours before and after using Pomodoro as well as the percentage of tasks they completed.
As we can tell by the bar graphs above , the number of times the students touched their phones without Pomodoro was significantly higher compared to using Pomodoro technique trials. Moreover, the percentage of tasks completed in 2 hours significantly increased after using Pomodoro technique in comparison to without it.
Our Solution: Pomodoro Prime App
A potential remedy for the problems caused by rising social media usage and shortening attention spans is our app’s creative features which utilizes the Pomodoro Technique. The apps features involve tabs to be chosen depending on what type of Pomodoro session a student would like to perform:
Create an individual focus session with customized time intervals in which you can then periodically take breaks in between
Join a Pomodoro session and connect with others studying with predefined time intervals that have periodic breaks in between.
In between these study sessions, there’s an option efficient break in which breaks that are commonly spent on YouTube mindlessly scrolling is now substitutable with options for stretching and meditation exercises during study sessions that will improve focus and calmness for better performance in the next sessions.
Contributors:
Lara Baltaji, Hadi Knaiber, Batoul Ramadan, Abdallah Yahfoufi, Nour Azakir, Herbert Pritzki, Shadi Youssef
Background about the Lebanese Crisis:
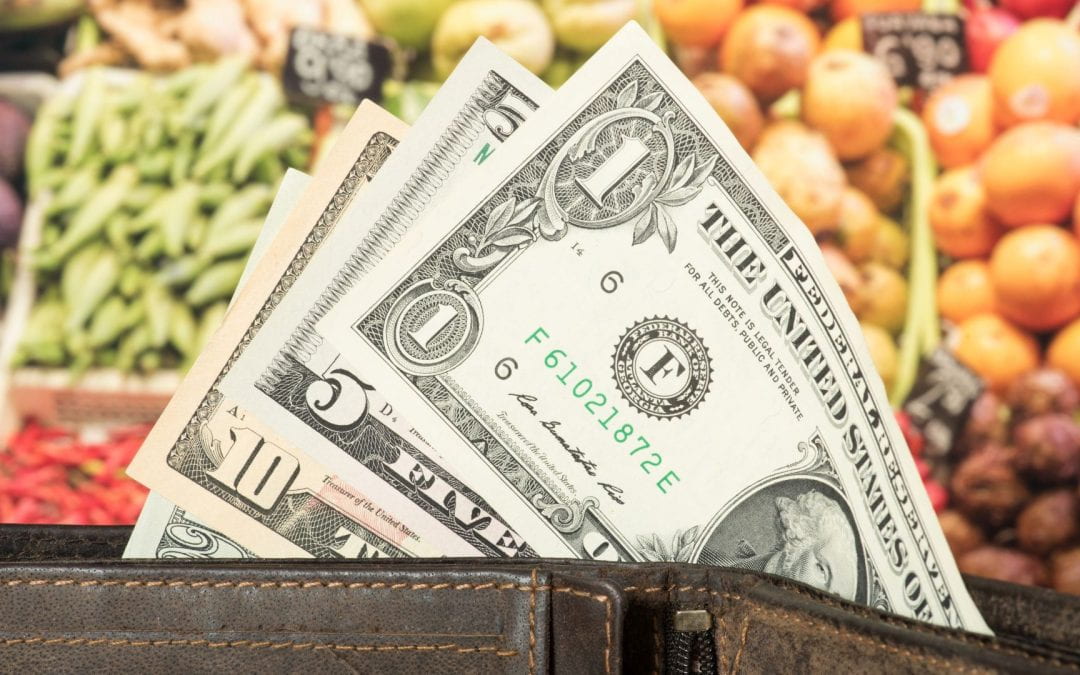
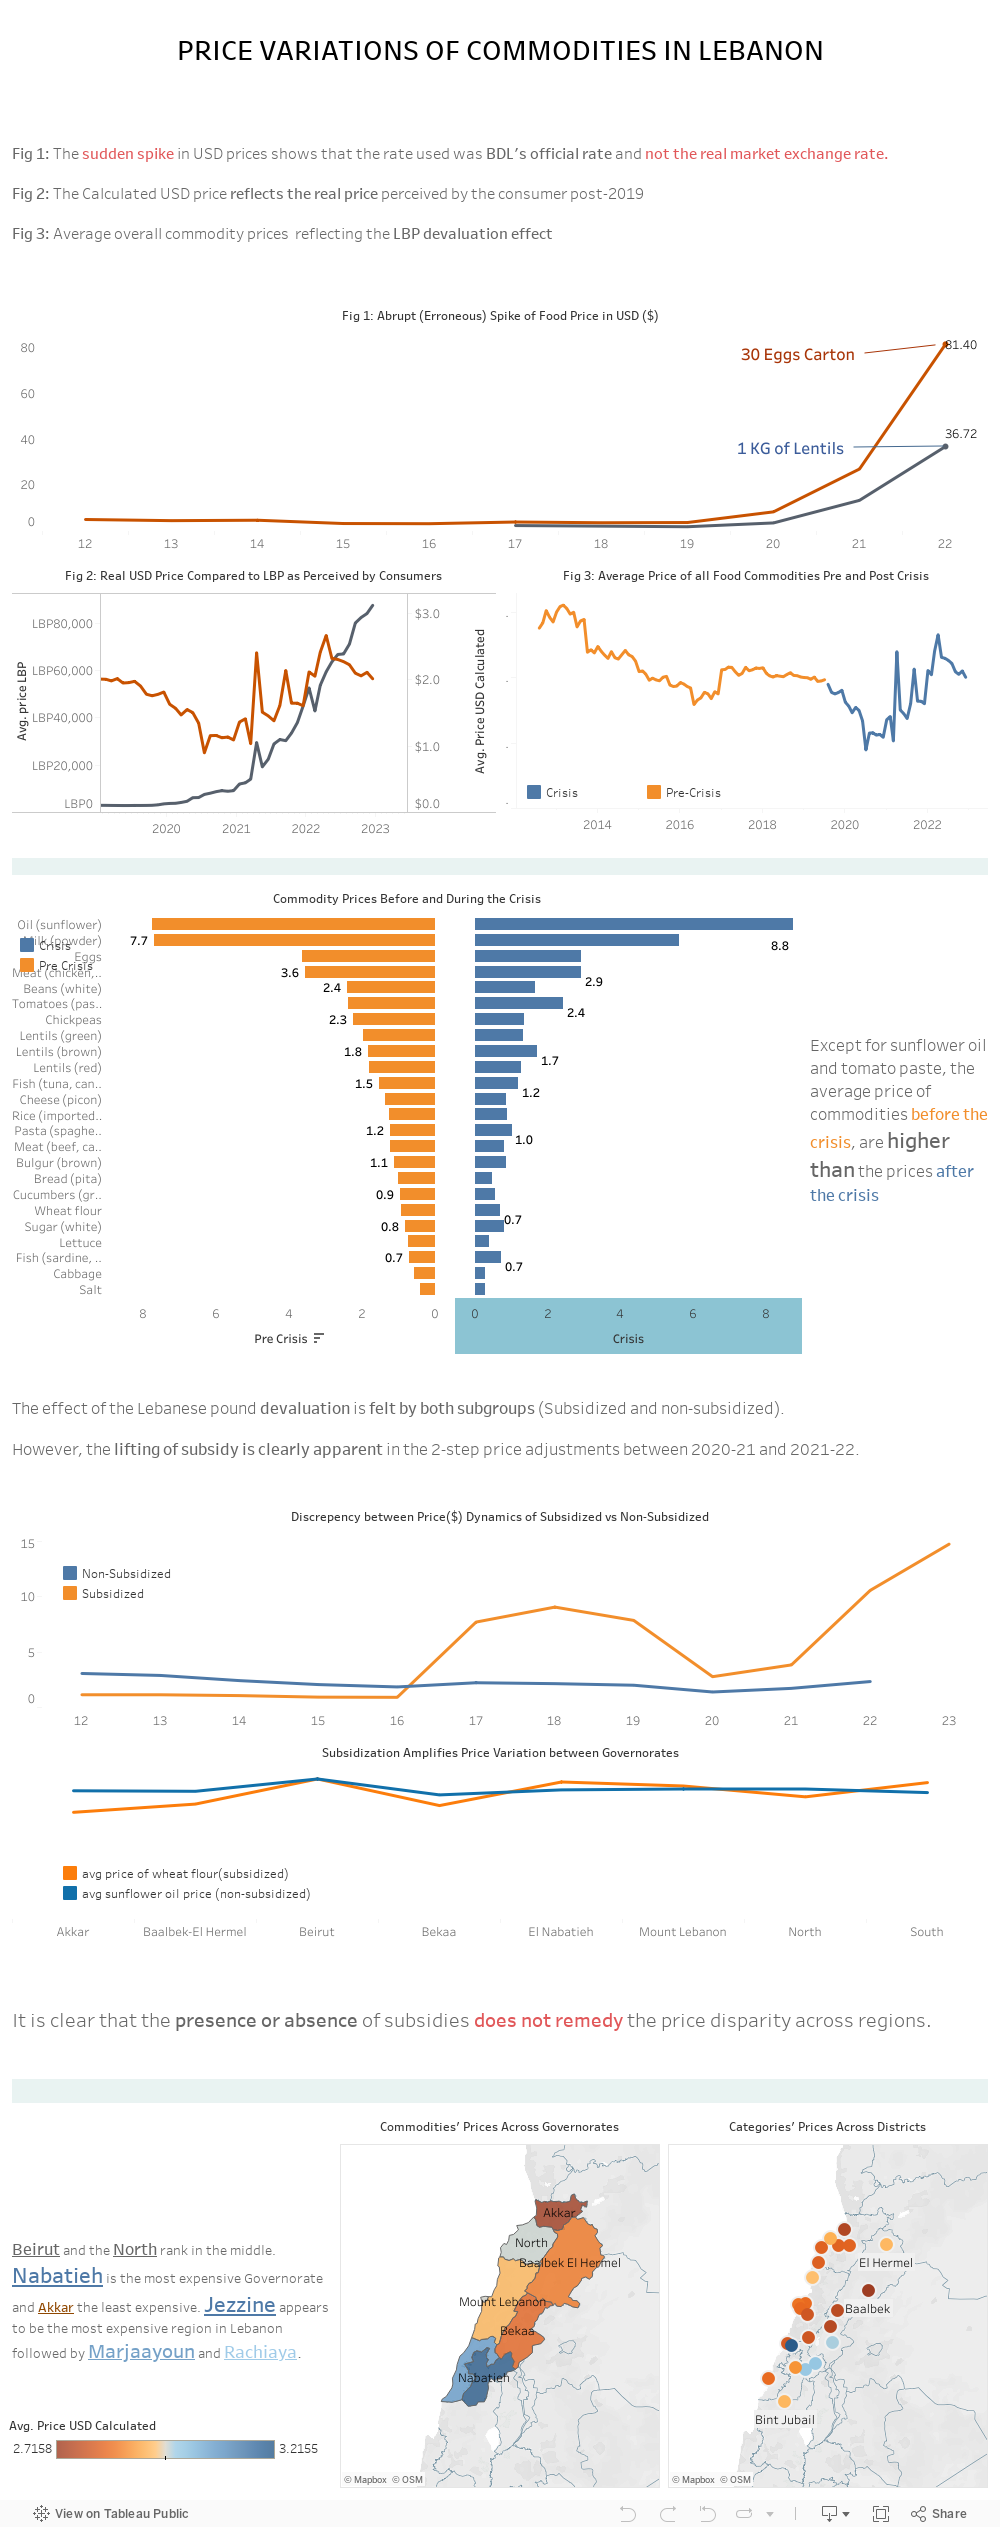
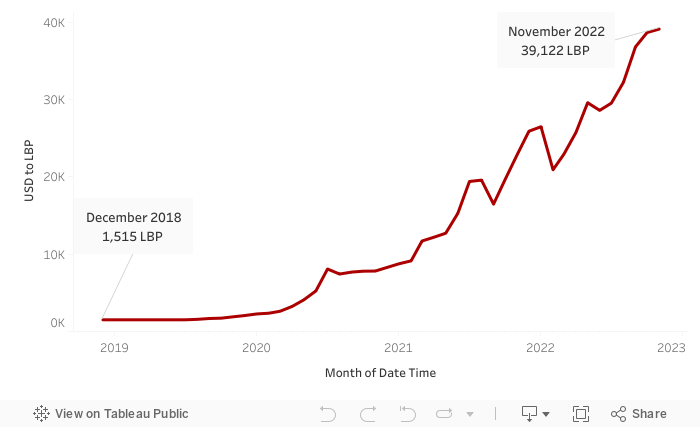
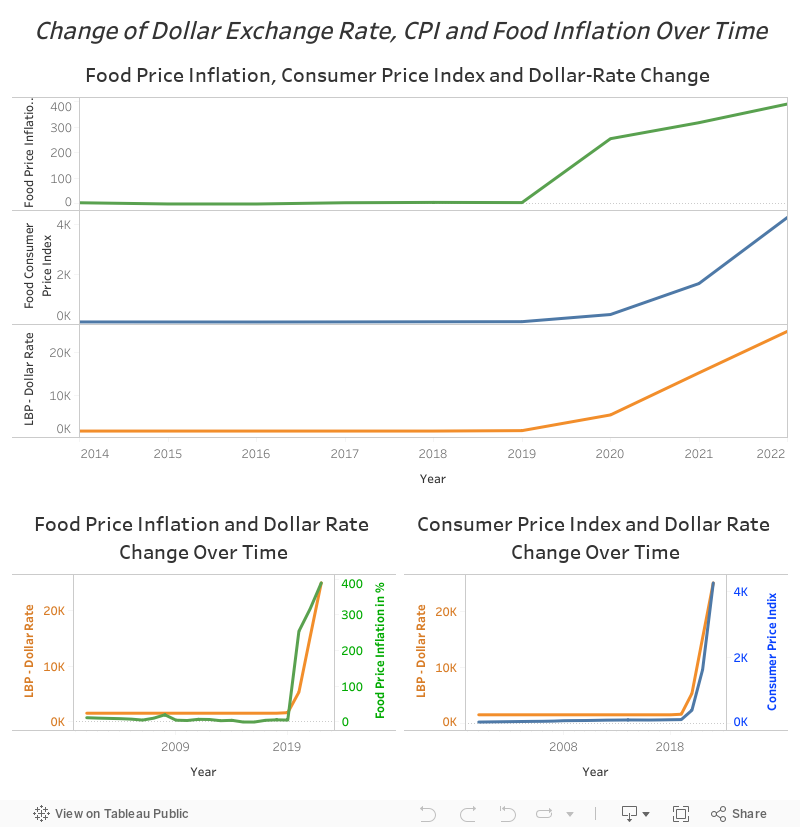
For nearly three years now, Lebanon has been facing the most devastating financial crisis in the modern era. The crisis started in October 2019 and aggravated by the economic effects of the COVID-19 pandemic and by the massive Port explosion on August 4, 2020. As a result, the black market dollar exchange of the Lebanese Lira increased from 1515 L.L. (before the crisis) to around 40,000 L.L(today) marking an almost 2500% increase.
You can find below a visual that shows the change of the official LBP/Dollar exchange rate over time until this November 2022.
This huge increase came with countless economic impacts on inflation, unemployment and poverty. Lebanon’s severe crisis which was blamed on the government’s corruption and failure has led to massive impacts on the Lebanese currency causing extreme poverty, unemployment, medicine shortage, electricity shortage, fuel shortage, malnutrition and much more. You can find below a visual that shows the change of the Food Inflation and the Food Consumer Price Index with the LBP/Dollar Exchange Rate over time until this March 2022.
The huge inflation was directly reflected on the prices of basic food commodities in Lebanon ever since the start of the economic crisis in 2019. What is meant by basic food commodities is the minimum raw agricultural or animal products sufficient to satisfy the nutrition needs of an average household which comprise of:
Cereals and Tubers (rice, wheat, corn, starch)
Meat, Fish, Eggs and Seafood
Dairy (milk, cheese, labne)
Oil and Fats
Vegetables and Fruits
Sugar and Salt
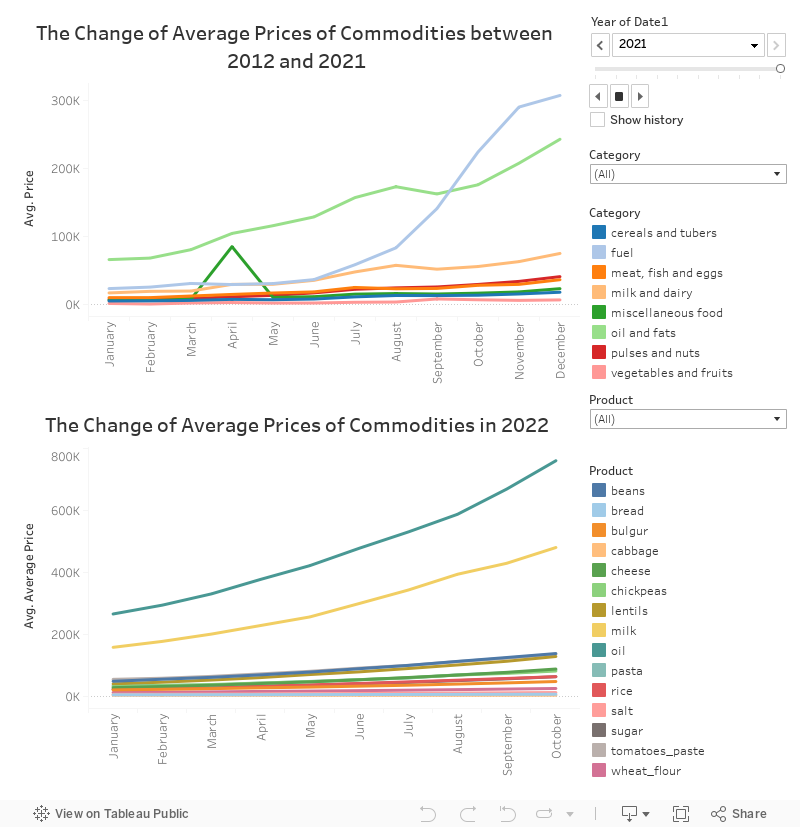
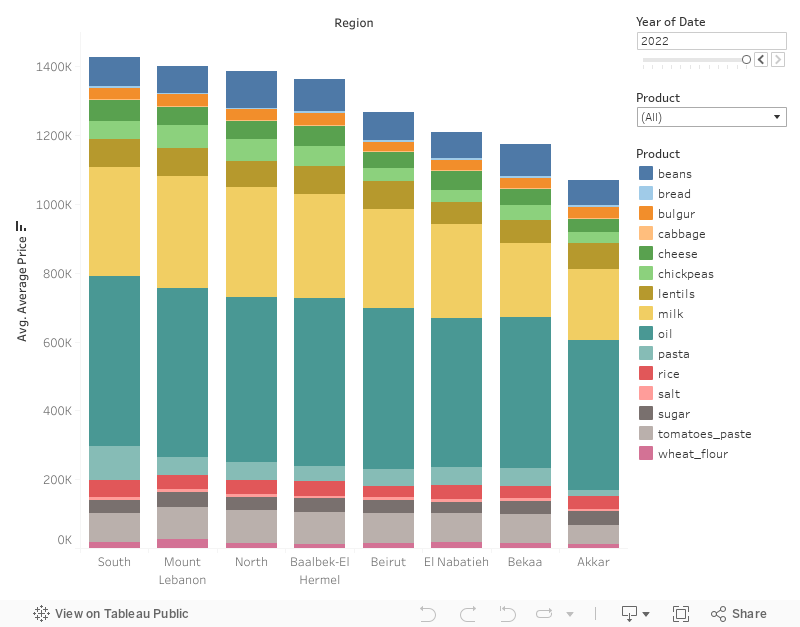
The slope of increase before 2021, however, was quite subtle due to the fact that food commodities were subsidised by the government back then. As the Central Bank started to run out of resources to keep the subsidies, the government lifted them in March 2021. That is when the increase in prices of basic food commodities started to follow a much steeper slope. The below interactive visual shows the change in average prices of food commodities in Lebanon over the years.
Problem:
According to the World Bank, food price fluctuations between Lebanese markets are caused by the Lebanese government’s “deliberately inadequate policy responses”. Due to the inadequate policy responses by the Lebanese government and due to the fact that Lebanon follows a free market economy, the problem of increased food prices started to worsen as not only are prices increasing, but now they are further inconsistent between markets in the different Lebanese regions . This adds an additional overwhelming problem to the many hardships Lebanese people are facing today.
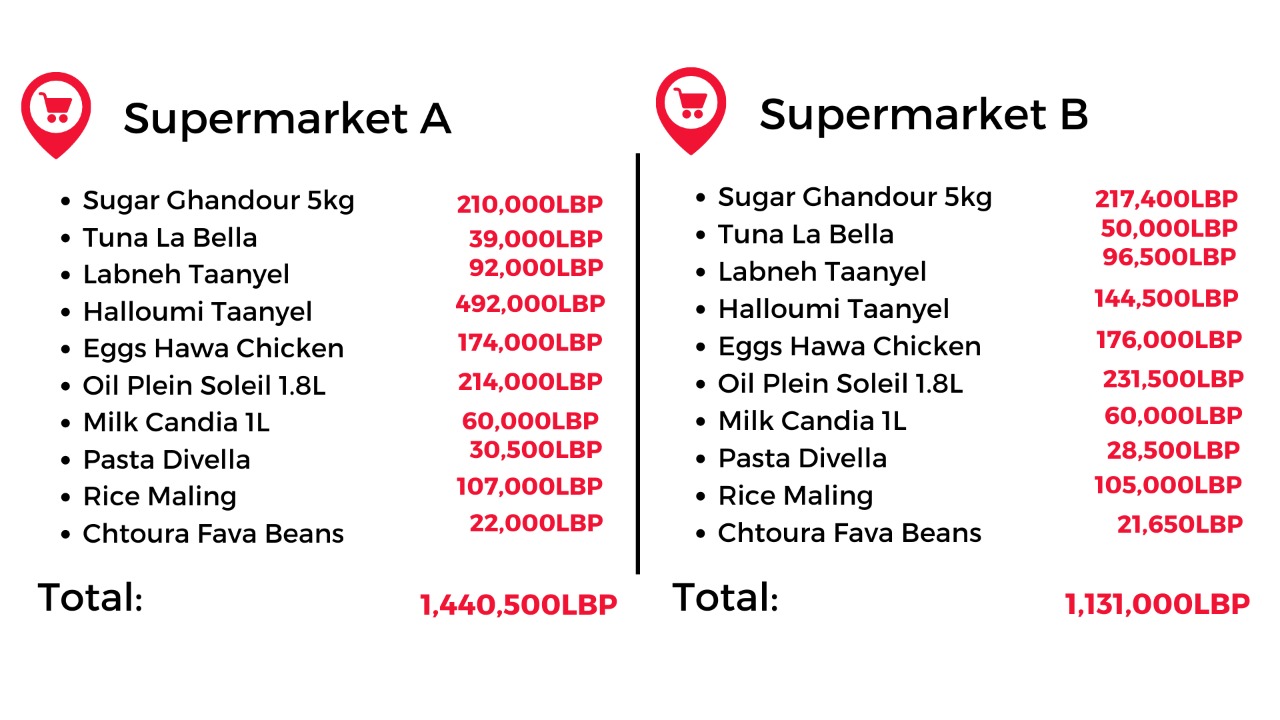
In order to provide evidence for this issue, we decided to visit two supermarkets in Beirut and observe the differences in food prices. The variation in prices of the same food products was absolutely surprising. The below figure shows the price receipts of the two supermarkets.
Our next step was to explore two datasets issued by World Bank and World Food Programme Price Database. Our data explorations go hand in hand with our observed hypothesis which reveals that “there exist extreme and unexplained variations in food prices around markets in different Lebanese regions”.
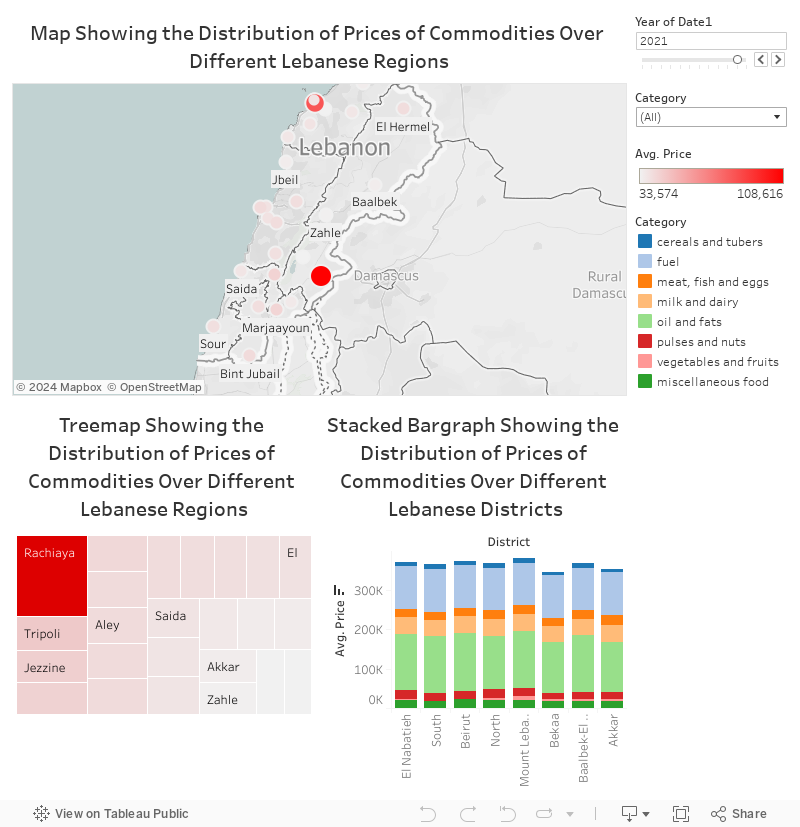
The variation in prices of different food commodities has been an existing situation for many years now in Lebanon. This situation has exacerbated ever since the beginning of the economic crisis in 2019 as the price control responses have become inadequate. The following dashboard shows a comparison of prices of the different food categories between the different Lebanese districts over the years until 2021
The following bar graph shows a comparison of prices of specific food products between the different Lebanese districts over the years until 2022
Below we present the percentage difference of some food products between different Lebanese districts in 2022 (until October):
The average price of a one kilogram bag of wheat flour in Mount Lebanon was 28,000 LBP whereas in Baabak-El Hermel 10,000 LBP, recording a 95% difference.
The average price of a 160 gram Akkawi cheese in the South was 60,000 LBP whereas in Akkar 40,000 LBP, recording a 40% difference for cheese.
The average price of a can of powdered milk (2.5 kg) in Mount Lebanon was 325,000 LBP whereas in Akkar 210,000 LBP, recording a 40% difference for milk.
The average price of a 3.6 Litre gallon of olive oil in the South was 500,000 LBP whereas in El Nabatieh 430,000 LBP, recording a 15% difference for oil.
And the list of unexplained price variations between districts just keeps growing and growing.
Finally, in order to further prove our hypothesis, we conducted interviews with random Lebanese residents walking on Beirut’s seaside. When asked whether they were noticing price variations between supermarkets, most interviewees agreed that there exist obvious price variations of basic food commodities between different supermarkets. They added that this variation is not related to the location of the markets, for in many cases they have noticed that even markets lying walking steps away from one another vary in food prices. This means that the price variations cannot be explained by the products’ cost of transportation. It is only explained by the fact that there exists no governmental supervision.
Proposed Solution:
In Lebanon, there are laws that protect consumers from monopoly and from overpricing. However, as with many other laws, the government is unable to strongly implement these laws and monitor the prices of the supermarkets especially in the areas that are far from Beirut. For that, we propose a website, which can later be developed into a mobile application. The website shows the official prices of basic food products in the Lebanese market which are regularly updated by the Ministry of Economy whenever a significant change in the LBP exchange rate occurs. It also displays the prices of these same products in different Lebanese supermarkets. This way, Lebanese consumers will be able to check the prices of products before they go shopping, and thus can tell which supermarkets are following the official prices specified by the ministry and which supermarkets are overpriced.
We are working on involving Lebanese consumers in our website. As we all know, the Ministry of Economy has a limited number of employees. Thus they will not be able to monitor the prices in all the Lebanese shops. A better way for monitoring prices in different supermarkets would be to include consumers in the process by giving them the chance to report prices directly on our website. This means that consumers will act as data collectors, and thus can contribute to the success of this project. Now, the ministry will be able to track the overpriced supermarkets and take the necessary measures.
We also hope to develop the website idea into a mobile application, which is a proposition heavily backed by the Ministry of Economy.
Solution Validation:
The application concept we came up with to tackle the problem needed to be validated in order to be put into action. We needed means to check if our ideology could in fact lead to a change in the real world or it is only a theory on a piece of paper.
Therefore, we decided to take the view points of two parties:
The Lebanese citizens which are the potential future users of our application in order to check if they are actually willing to use it and if it could lead to a change in their lives and to the country in general
The General Director of the Lebanese Ministry of Economy and Trade, Dr. Mohamad Abou Haidar to assess the practicality and the feasibility of the concept by a professional in the field.
In the streets of Beirut, we went down asking random people about the issue and the proposed solution. All in all, people supported the idea and many claimed that they would be using the application without any doubt and believed that it would make a positive change in the pricing system in Lebanon.
On 25 November 2022, our team visited the director general of the Lebanese Ministry of Economy and Trade, Dr. Mohamad Abou Haidar. We interviewed Dr. Abou Haidar about how practical it is to do such an application and how much it could lead to change and the interview was recorded. Dr. Abou Haidar claimed that this application would lead to a significant change in several aspects. First, this application will help fight corruption in terms of pricings because it will be directly synced to the ministry, so any abnormal pricings will be directly reported to the ministry and the issue will be transferred to the responsible authorities that are able to take any legal action. The ministry also is trying to work on implementing online services that protect consumers’ rights along with the UNDP and other organizations. So, this application will be aligned with the goal of the ministry, since it is online-based. In addition to that, it will play a role in controlling the pricings in the market since it substitutes the need for the huge number of employees and the human resources needed that, no matter how many, cannot roam around the entire supermarkets and stores in all the Lebanese regions. He also said that the complaints of the people will reach the ministry in a more efficient and effective way, because they are via the application and therefore, the ministry can know about the concerns and the issues in a much faster way. Finally, Dr. Mohamad summarized the idea by being a “win-win situation” for both the ministry and the consumers. This is because it will fulfil the needs of the consumers by knowing the exact pricings of the items in any supermarket with a press of a button, will ensure that the rights of the consumers are protected, and will lead to the right selection of the place to be visited. It will also help the ministry in terms of protecting consumers’ rights, censorship and supervision.
Conclusion:
The concept website was presented to the General Director of the Lebanese Ministry of Economy and again, the solution was validated and approved by the ministry by providing us the full support in order to create this website as soon as possible in order to help the people followed by the country in general.
Ending with a future perspective, we believe that this problem is crucial to be solved in the very near future because of the damage it is causing in several aspects ranging from economic, financial to social. We, the people and the ministry have bets that our application concept could be a positive game changer in this issue. Solving this problem marks one of the battles against corruption, and is an attempt to make this country perfect, again.
Contributors: Bashar Salha, Mohamad Kheir El Daouk, Rani Abu Dehn, Raoul El Khazen, Rima Wehbe.
Road Safety: Background Information
The World Health Organization estimates that around 1.3 million people die and that 30 to 50 million are injured each year due to road crashes. Despite having road safety laws instituted in almost every country, road accidents are still the leading cause of death for young people aged 5-29 years old.
In Lebanon, this problem is felt by most because of the chaotic nature of our roads. Anyone who has experienced being a passenger or a driver in Lebanon is aware of the bumpy roads, the absent traffic lights, the disregard for speed limits and safety regulations, the lack of protection for walking pedestrians, the dark tunnels and the unlit autoroutes in the night. According to the World Bank, the traffic and roads situation in Lebanon is now “amongst the worst globally” whereby it has become much more dangerous than it previously was following the start of the economic crisis in 2019.
We believe that the deteriorating status of Lebanon’s economic and social development will continue to aggravate the issue of unsafe roads and unsafe driving. So, our aim for this study is to firstly showcase to the fullest extent the details of this problem through the use of primary and secondary data sources and secondly to design an impactful solution which can be validated by relevant stakeholders.
Problem Clarification
Below is our linked interactive dashboard which showcases the details of the problem visually.
Our overall findings and comments can be summarized as follows:
1. The youth is most prone to having accidents and dying in these accidents. This is from the fact that people who are aged from 15 till 29 constituted the largest share of deaths from accidents.
2. On a geographical level, we observed that the accidents are majorly happening in the caza of Mount Lebanon and Beirut. Moreover, the bulk of the deaths are happening in the district of Baabda and Metn.
3. Collisions involving pedestrians are the most dangerous.
4. On average, people make accidents in the spring and summer breaks. From a time perspective, these accidents are evident to increase in the evening, especially on weekends.
5. On average, for 86% of all accidents, the driver is at fault. In 13% of the crashes, the pedastrian is at fault. Also, the major reason behind accidents is overspeeding, then we have reasons related to drivers and pedastirans not following road safety regulation.
The comparison between the years of 2014 and 2015 shows the impact of instituting a new law and enforcing it. As shown in the introductory dashboard, Law 243, released in April 2015, greatly influenced the traffic situation and decreased the numbers of accidents and casualties to about half the previous values.
Proposed Solution(s)
We propose four short-term solutions that can be implemented in a close period of time and two long-term solutions which require governmental and organizational cooperation and attention.
Our Short-Term Solutions:
1. Design and launch awareness campaigns for the young people who are 15 years old or more and will be eligible to drive, especially for the 15—29 age bracket. These awareness campaigns must be designed specifically to grab the attention of the young adults and to make them sensitive to the dangers of road crashes.
2. Place reflective signs on highways, dark mountain roads and tunnels. These reflective signs are cost efficient yet effective in guiding the driver in dark places.
3. Make the traffic lights solar powered. Since Lebanon has a limited budged, these traffic lights must be placed by according to priority. For instance, we must first set them on roundabouts and intersections. These places are more prone to traffic and illegal driving and overtaking.
4. Restructure the current penalty system for road violations. These penalties must follow the current economic and foreign exchange rate conditions in order to represent an actual threat to illegal drivers.
Our Long-Term Solutions:
1. Obliging citizens with theoretical studies and technical training related to cars. This is achieved by creating a driving school which ensures that drivers are equipped which adequate driving skills and safety knowledge.
2. Creating and modifying laws to penalize people who violate road safety measures. These laws can start by a point-based driving license, where drivers will lose points every time, they violate the law. After losing all these points, the authority is ought to retract the driving license.
Final Remarks
It is imperative that we combat this problem and that we share our findings with relevant stakeholders such as the youth, the ISF and the concerned NGOs in order to encourage this community to stay committed in their effort to rectify the Lebanese traffic issue. Hence, we have decided to email ISF representative General Imad Osman with a link to our dashboard which we will also send back to KunHadi representative Ms. Lina Gebrane who sat with us to validate our ideas.
Finally, we wish to stress on the importance of small actions that we as pedestrians and drivers can take to make our experience on the road less chaotic and stressful, being alert today means being alive tomorrow.