As our planet grapples with the consequences of climate change, this blog post delves into the complex relationship between human activities and our environment. Specifically, we’ll explore the dynamics of carbon dioxide (CO2) emissions, shedding light on the countries responsible for the highest emissions and examining their consequences on both land and water ecosystems.
The Global Landscape: Top 5 CO2 Emitters
When fossil fuels such as coal, oil, and natural gas are burned for energy, they release large quantities of CO2 into the atmosphere. The excessive release of CO2 and other greenhouse gases enhances the heat-trapping effect, causing a gradual warming of the planet known as global warming. This warming, in turn, leads to a wide array of climate change impacts, including disruptions to ecosystems.
Our journey begins with a visual exploration of the top five countries contributing significantly to global CO2 emissions. China, the United States, India, Russia and Japan respectively account for the highest amounts of CO2 emissions.
The bar graph on the right displays the total amount of CO2 emissions released by those five countries in 2020, along with their percentage contribution to greenhouse gas emissions. Clearly, CO2 emissions constitute a significant share of overall greenhouse gas outputs, with notable contributions observed particularly in China and Japan.
Subsequently, the line graph traces the trajectory of CO2 emissions in those five countries, where the data reveals a significant upward trend in CO2 emissions in China. Meanwhile, the remaining countries exhibit a relatively consistent pattern in the evolution of their CO2 emissions.
Power Generation: Coal vs. Renewables
The two line graphs contrast the production of electricity from coal sources against the consumption of renewable energy. While electricity production from coal sources is following a constant trend, the nations are not doing much when it comes to renewable energy, where India is the country that uses the most renewable energy.
The Toll on Wildlife: Threatened Species
The first bar graph examines the status of threatened mammal and fish species in the top five CO2-emitting countries in 2018. The second bar graph unveils a different narrative; the bottom five countries contribute less to global emissions. While this correlation warrants further exploration, it prompts us to consider whether lower emissions may indeed be associated with a lower number of threatened species.
In response, the following recommendations are proposed to guide collaborative efforts towards a sustainable and resilient future:
Global Collaboration: Nations, particularly the top emitters, must commit to CO2 emissions reduction and participate in international initiatives to address climate change.
Renewable Energy Acceleration: All countries, especially those heavily reliant on coal, should prioritize and accelerate efforts to increase the share of renewable energy in their energy portfolios. Investment in research, development, and implementation of sustainable energy technologies is paramount.
Conservation Initiatives: Nations with high emissions must implement robust conservation programs to mitigate the impacts on threatened species. Conversely, lower emitters should continue efforts to maintain a positive outlook for their wildlife.
Aforestation and Reforestation: Invest in afforestation (planting trees in areas that were not forested) and reforestation (replanting trees in deforested areas) projects to absorb CO2 from the atmosphere.
Carbon Capture and Storage (CCS): Develop and implement technologies that capture and store CO2 emissions from industrial processes and power plants, preventing them from entering the atmosphere.
Public Awareness and Education: Increase public awareness about the impact of individual and collective behaviors on CO2 emissions. Education campaigns can encourage more sustainable choices in daily life.
By combining these recommendations and tailoring them to specific regional contexts,the governments, industries, and individuals can contribute to a significant reduction in CO2 emissions, fostering a more sustainable and resilient planet.
Earth is our home, our planet is home to every lifeform we know, these come in all shapes and sizes, from the most unfamiliar one to the one that you see every day. Sometimes we don’t act always good for each others and we considered each others as predators and prey. But we share the same roof, the same air, the same planet and we depend on each other for food and sustainability especially because in the most cases we share our habitats in close proximity.
To survive we should maintain our plant rich in biodiversity. As we have needs as humans, the nature has it owns and we must be careful not to harm any animal nor plants because this will affect us directly. Why?
It will be clear by the life chain representation: Plants (Flora) -> Animals (Fauna) -> Humans
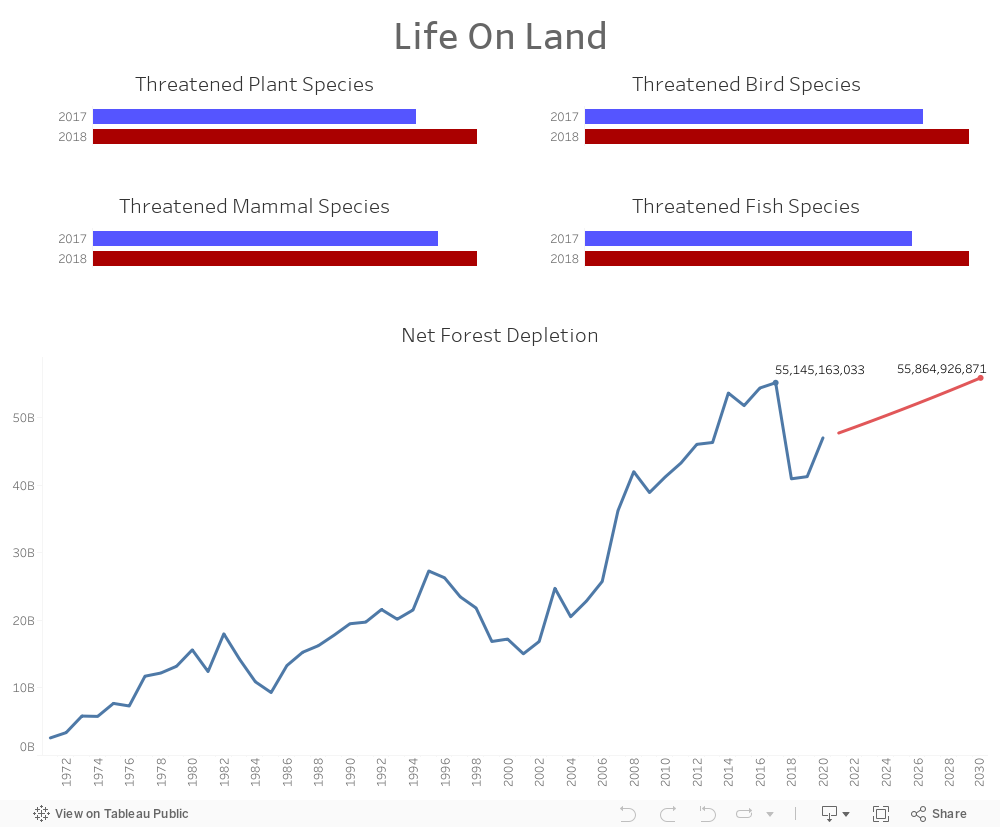
Unfortunately, more than 200 species go extinct, If we don’t act species like the Asian elephant, Siberians tiger will continue to vanish until they are gone. The First 4 Graphs in the Dashboard reflect the dangerous situation for both flora and fauna , the number of threatened species is increasing hugely from 2017 to 2018 for Birds (More than 2,000 new species), Plants(More than 2,000 new species), Mammals(More than 400 new species) and Fish(more than 1,000 new species).
Biodiversity start in the distant and points towards the future
Well I guess Frans Lanting quote is sufficient to understand the importance of biodiversity for our future existence.
We might ask ourselves what is the main reason, and I’d like to take this opportunity to think what humans did for animals and plants habitat? Protecting wildlife habitats? Of Course NOOOOOOOOO
let’s define first the net forest depletion : unit resource rents times the excess of roundwood harvest over natural growth. By examining the Net Forest Depletion graph in the dashboard this Indicator increased significantly in the world from 1971 (2,603,842,725) to reach its peak in 2019 (55,145,163,033). In addition the forecasted part confirm that we will reach a higher number in 2030, so the situation will get only worsened.
Let’s not forget that the number of threatened species in increasing hugely yearly and Approx. more than 200 new species are threatened each year and this damage is caused mainly by the unsustainable humans activities like forest depletion which they constitute the habitats for all animals and plants.
It’s never too late, Let’s build safe habitats for threatened animals (Zoo),adapt the afforestation and recycling and concerning the role of government in protecting the life on land it could be by imposing strict rules for causing any damage for animals and plants, also by reducing environmental pollution especially in the water and air.
We only have this one planet; we got to figure out how to live in it without destroying it.
Think twice before approaching to an animal and especially to a dog, why?
Well.. After reading this you will consider counting to 10 before getting close to a specific breeds of dogs unless you’re ready to get a bite.
Let’s explore the resulted visuals and info we generated using a dataset that includes information on over 9,000 animal bites which occurred in the USA.
We saw that dogs are the most likely to bite human, let’s explore some data about dogs.
One advice, stay away from brown and black PitBul, and don’t play with a black Labrador. You might get a bite and even on your head.