
Life on Land
Earth is our home, our planet is home to every lifeform we know, these come in all shapes and sizes, from the most unfamiliar one to the one that you see every day. Sometimes we don’t act always good for each others and we considered each others as predators and prey. But we share the same roof, the same air, the same planet and we depend on each other for food and sustainability especially because in the most cases we share our habitats in close proximity.
To survive we should maintain our plant rich in biodiversity. As we have needs as humans, the nature has it owns and we must be careful not to harm any animal nor plants because this will affect us directly. Why?
It will be clear by the life chain representation: Plants (Flora) -> Animals (Fauna) -> Humans
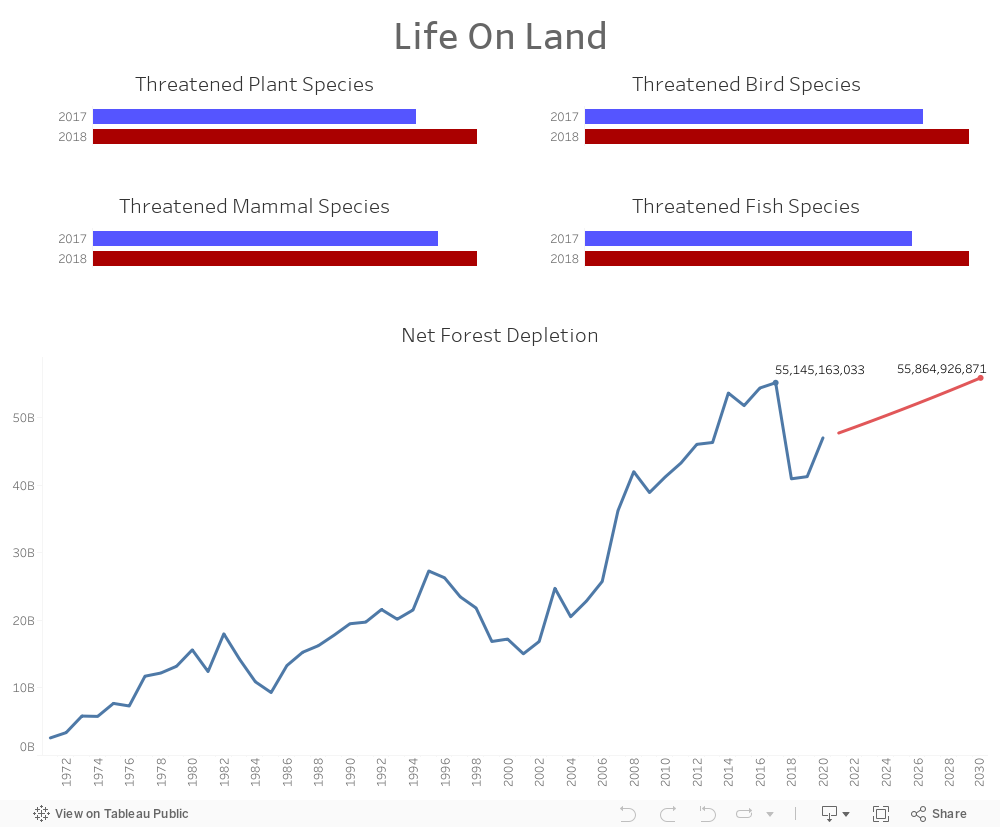
Unfortunately, more than 200 species go extinct, If we don’t act species like the Asian elephant, Siberians tiger will continue to vanish until they are gone. The First 4 Graphs in the Dashboard reflect the dangerous situation for both flora and fauna , the number of threatened species is increasing hugely from 2017 to 2018 for Birds (More than 2,000 new species), Plants(More than 2,000 new species), Mammals(More than 400 new species) and Fish(more than 1,000 new species).
Biodiversity start in the distant and points towards the future
Well I guess Frans Lanting quote is sufficient to understand the importance of biodiversity for our future existence.
We might ask ourselves what is the main reason, and I’d like to take this opportunity to think what humans did for animals and plants habitat? Protecting wildlife habitats? Of Course NOOOOOOOOO
let’s define first the net forest depletion : unit resource rents times the excess of roundwood harvest over natural growth. By examining the Net Forest Depletion graph in the dashboard this Indicator increased significantly in the world from 1971 (2,603,842,725) to reach its peak in 2019 (55,145,163,033). In addition the forecasted part confirm that we will reach a higher number in 2030, so the situation will get only worsened.
Let’s not forget that the number of threatened species in increasing hugely yearly and Approx. more than 200 new species are threatened each year and this damage is caused mainly by the unsustainable humans activities like forest depletion which they constitute the habitats for all animals and plants.
It’s never too late, Let’s build safe habitats for threatened animals (Zoo),adapt the afforestation and recycling and concerning the role of government in protecting the life on land it could be by imposing strict rules for causing any damage for animals and plants, also by reducing environmental pollution especially in the water and air.
We only have this one planet; we got to figure out how to live in it without destroying it.
Thank You
0 Comments