“I had to work twelve-hour shifts, for seven days weekly in order to keep up with my son’s medication prices, which keep increasing every week. Only to later find out that, when I had the money, I could not find the drug. ” This was the story of Wafic, one more individual affected by the drug shortage and inflation. In this case, Wafic was looking for a drug to treat his schizophrenic son; however, he was unsuccessful, and similar cases to Wafic’s occur daily. Wafic and the many others who are affected by these circumstances are the inspiration to improve the pharmaceutical sector in Lebanon.
The team had the opportunity to discuss, although briefly, the current situation regarding the pharmaceutical sector in Lebanon with Mr. Karim Jbara, who is the head of medical imports in the country. During the sit-down, it was emphasized that Lebanon’s medical drug shortage issue stems from the currently unreliable subsidy system which is permeated with inefficiencies and compromises in the wrong instances. Hence, the team brainstormed on how to tackle issue by issue and proposed to implement a reform in the subsidy system, to target instead of medical drugs, the patients themselves. This ensures funding is reaching the right people, at the proper time, and improving the country’s overall access to medical drugs.
The shortage of drugs is a symptom caused by the current, unreliable, and inefficient subsidy system in effect until today. How so? At first, the decrease in funding, from $85 to 25 Million dollars dedicated to the import of medical drugs exacerbated the already-fragile system. Moreover, the dedication of 77% of the current budget to oncology drugs leaves little to subsidize other ailments such as hypertension, diabetes, psychiatric disorders, and other chronic diseases. What is the issue with prioritizing oncology drugs? Well, even though cancer is life-threatening and very much deserving of attention, it does not justify the neglect of chronic diseases. The reason is, chronic diseases might not seem fatal at first, but over the long run, without one’s due diligence, they develop into risky scenarios. For example, schizophrenic patients are likelier to become aggressive, and diabetics patients risk losing their vision or limbs. Hence, this allocation cannot be built as such, and there must be a better way to reach these people effectively, without compromising oncology spending. Lastly, the fact that biosimilar drugs at the same dosage, are subsidized at different price points and from different countries shows a lack of commitment to partition resources appropriately. It is not unheard of to renegotiate with partner countries during times of crisis, and at this point, the populace needs fewer brand options but richer diversity in treatment options.
The inefficiencies mentioned above are legitimate concerns, yet the aspect creating shortages is the unreliability of funding. Meaning that subsidies are not granted every month. Hence, pharmacies sell drugs in LBP, and at the limit stipulated by the Ministry of Health and must replenish periodically. However, there is no incentive to replace this medication in case it’s not subsidized, as it would be imported at its original price in dollars. This a loss for the pharmacies as even if allowed to be sold in dollars, prices are out of reach for locals. Even worse, Black-Market dealers exploit this shortage to profit over a greater margin, than that stipulated by the MOH.
After the team resumed the meeting with Mr. Jbara and brainstormed about the issue, it came to our attention that most of these inefficiencies and their consequences can be addressed by shifting focus to subsidizing patients instead of drugs. What justifies this idea is that funding on its own is not enough. For example, the USA is the greatest spender in healthcare but not necessarily the country with the best health indicators (e.g., life expectancy). Hence, the team proposed an app and database linking the patient, the MOH, and an international institution willing to grant funds aimed to subsidize people. Accordingly, importers and pharmacies will have a stable market to import to and sell. The government won’t need to stipulate prices monthly, and the populace, at any socioeconomic level, will be able to find and afford the medications desired.
Team: Ibrahim Al Jaifi, Zahraa Jassar, Rami Haidar, Ali Hachem, Rim Zeaiter, Fatima Ayoub
“ We don’t go to school; we work in the daytime to support our families and spend the rest of our day playing in the streets.”
Said Omar and Yazan, two inspiring kids in Burj Al Barajneh, a refugee camp in the suburbs of Beirut. Under 10 years old, both already carrying the responsibility of working to provide for their families instead of being enrolled in education.
According to ILO, it is estimated that 160million children are involved in child labor, 79 million of which are in Hazardous Work that is likely to harm children’s health, safety or morals. All these children, including young Omar and Yazan, are at an age when they are supposed to be provided for, educated and protected. Having to spend most of their time working in jobs that are unsafe and exhausting, their chances of leading healthy and thriving lives diminish with each dollar they earn.
Child Labor in Lebanon
The emergence of the Lebanese economic crisis in 2019 brought with it an increase in percentage of families with children engaged in child labor from 29% to 38% between 2019 and 2021 according to IRC.
GDP, as an indicator of the economic performance of a country, noticed a 65% decrease from $52B to $18B during the period of 2019 to 2021. With this drastic drop in GDP, the unemployment rate rose from 11% to 15% while the CPI more than doubled, leaving thousands of families under the poverty line with no sources of income.
With these dramatic and sudden changes in the economic situation, 3 out of 5 children in Lebanon dropped-out of school and most of the rest switched to public education. Education has become less of a priority for both the government and families.
From a social perspective, 44% of parents who have taken part in a study by the World Vision Organization believed that involving their children in paid labor enhances their life skills and assures a source of income for their households. Meanwhile, the responsible government agencies have no clear and applicable laws in place to prohibit children’s exploitation or ensure they are enrolled in education.
Implications:
Child labor has destructive impacts on the health of the child, exposing millions of children to physical, mental and emotional abuse. As a result, their mental and intellectual development face significant disruptions. Considering the increasing crime rates in the country and the exposure of children to illegal work activities, the forecasted 30% increase in crime rate in 2025 would involve criminal acts by juveniles.
Proposed Solution
Mr. Aws Al Kadasi, senior research analyst at Merci Corps, commented on the topic during an interview for this project:
“According to the UNICEF, one in 5 children in the least developed countries are engaged in child labor. A problem that was aggravated by COVID-19 and global economic decline that it takes a walk in Beirut to believe these numbers. Children require different systems of protection that starts with parents and extends to every office, business, institution, organization and agency, local and international, governmental or otherwise. Everyone, who is not a child, is responsible”
Both 8 and 16 Sustainable Development Goals highlights the need for international efforts to tackle the issue of child labor:
Target 8.7: Take immediate and effective measures to eradicate forced labor, end modern slavery and human trafficking and secure the prohibition and elimination of the worst forms of child labor, including recruitment and use of child soldiers, and by 2025 end child labor in all its forms.
Target 16.2: End abuse, exploitation, trafficking and all forms of violence against and torture of children.
Inspired by these goals as well as social responsibility towards the community, our project team designed an initiative to capitalize on the work of international aid organizations and local organizations and projects working to fight child labor and illiteracy.
Future4Kids (F4K) initiative aims to establish a cooperative relationship between NGOs that provides cash assistance to families and campaigns against child labor. F4K initiative will work on partnering with cash aid organizations and NGOs working in child education. Receiving cash assistance would be conditionally linked to the enrollment of beneficiaries’ children in education with families being required to show evidence of child enrollment in education periodically.
The initiative platform will allow these two parties to join efforts to encourage families to enroll their children in education. F4K platform will also allow for receiving public donations for child education campaigns carried out by our partners.
Presented by: Loma Komeiha, Hassan Hodroj, Amar Abbani, Ahmad Abdel Malak, Yasmina Moghnieh, Fatima Baydoun
Zomato is India’s largest food delivery, dining and restaurant discovery service platform. Zomato grants customers the ability to order food online, track orders, benefit from offers and discounts, book a table, and discover top cuisines, restaurants, and dishes in their area. Arguably Zomato’s most distinguishing feature, the app allows users to access restaurant details by looking up menus, ratings, reviews, contact details, and map directions. Customers who have visited restaurants found on the app are also able to send in pictures from their experience in order to help other customers make an informed decision. On the opposite end, restaurants listed on Zomato are provided with industry-specific marketing tools in order to attract and retain customers. The app also regularly runs promotional campaigns for restaurants listed exclusively on Zomato, providing increased visibility. (Zomato, n.d.)
While Zomato sounds like any foodie and restauranteur’s dream on paper, in practice, it is very different. Many of the aforementioned services are available only in India, Zomato’s main country of operation. Zomato segments its operations into three geographical ones: India, the United Arab Emirates (UAE), and the Rest of the World (ROW) (Australia, New Zealand, Philippines, Lebanon, Turkey, Poland, Qatar, Ireland…) (Business Insider India, 2021). As of November 2022, Zomato was operational in its full capacity only in India and the UAE (Financial Express, 2022) after it gradually began halting its full operations in the 22 ROW countries it operated in, with Lebanon being the last international market it exited in November 2021(Business Insider India, 2021), though it has been confirmed that the app will surrender its delivery services in the UAE to Kuwaiti delivery app Talabat at the end of November 2022. Zomato’s CEO explained this move by claiming that the business has the capacity to grow at a much faster pace than its currently at, diverting its attention to more local ventures and businesses (Financial Express, 2022). It is important to note that users in the ROW are still able to access restaurant details through the app, providing some form of business for Zomato in these countries. However, even in this regard, the app has some shortcomings: Very few restaurants are listed in most countries (even before Zomato’s halt of full operations), average prices and ratings of restaurants on the app are skewed, there is little variety in the cuisines offered, and table booking is not available everywhere.
The below visualizations provide a sense of the distribution of restaurants on Zomato as well as their characteristics in order to better understand the outlined problems:
Given its current stance on its international presence, Zomato can still make use of its distinguishing feature and maintain its position as a restaurant aggregator, albeit without food delivery services, through:
Increasing the number of and diversify the restaurants available in the countries it operates in, especially in major cities. Starting with smaller restaurants first might be a cautious step, especially in countries where Zomato might be facing competition from other apps in its category.
Diversifying the price ranges of restaurants in different countries found on the app to cover varying tastes and budgets.
Increasing the number of restaurants that offer table booking, not only in India and the UAE, but also in the ROW countries where Zomato once offered this feature (UK and Philippines, for example), especially as a surge in the number of people dining-in has been seen in our post-COVID world (Franzreb, 2022).
Creating partnerships with local delivery service apps in ROW countries that Zomato can link its users to if they would like to place an online delivery order after viewing restaurant information on Zomato – similar to how Zomato currently redirects users who wish to place an online order in the UAE to Talabat per their partnership agreement.
Authors: Tala Abdul Samad, Nour Al Bidewe, Basman Hariri, Sara Sadaka, Aziz Saliby, Jean-Pierre Sakr
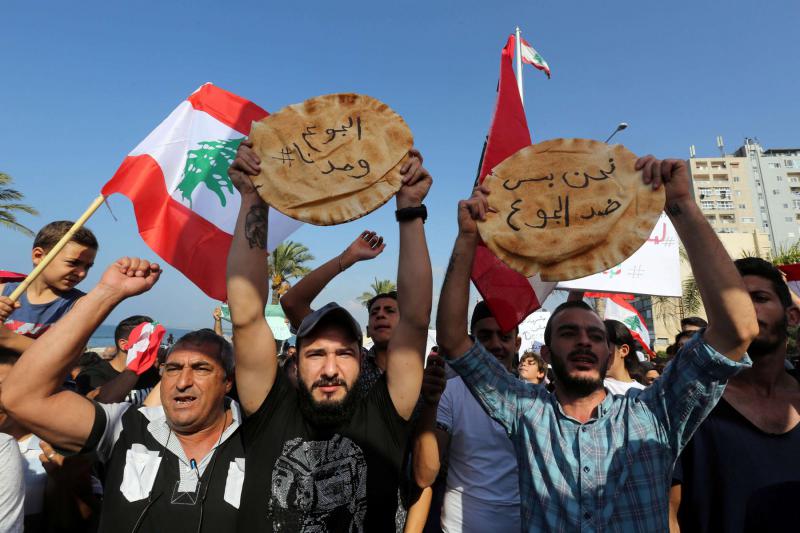
Over the past two years, Lebanon has been witnessing compounded crises such as brain drain, poverty, unemployment, and inequality. On October 3rd, we wanted to listen to the factors that affected the Lebanese the most. Borhan, a 60-year-old man living in Beirut, was one of the people we met. We captured a video with him to show the suffering of the Lebanese since the start of the crisis where he comprehensively described the severe living conditions. As we all know, 2019 was a year of transformation for Lebanon, beginning with the October 17th revolution in 2019, following the global pandemic in 2020, and the rise of inflation. Borhan expressed the feelings of most Lebanese, where he identified the problems that we are facing as residents. Many people mentioned that specific sectors have been hit the most, therefore we would like to perform exploratory data analysis and surveys using different datasets to be able to identify inequalities. We are also interested in using a data-driven approach to identify gaps and inequalities that exist in the education, income, and health sectors.
As a result, we have exploited the World Bank’s World Development Indicatorsand we have identified several indicators which we have used as proxies to measure multidimensional poverty in Lebanon. We chose to have a topic related to the multidimensional poverty index in Lebanon compared to the Arab region. Since the multidimensional poverty index is calculated using three different dimensions, namely education, living conditions, and health, we decided to divide the three different dimensions among us.
Living Conditions:
Housing is a significant indicator of the multidimensional poverty (MDP), and based on ESCWA calculations, the main indicators to assume whether housing is counted as depreciation for a household or not are ‘Overcrowding rate’ – the percentage of the population living in an overcrowded household – ‘Housing type’ i.e. houses, apartments, row houses, townhouses and duplexes, ‘Sanitation quality’ – availability of handwashing facilities, toilet cleanliness.
Historical data related to housing utilities in Lebanon was gathered from theCentral Administration of Statistics (CAS), which contains significant indicators to measure MDP such as water, electricity, gas, actual rent, furnishings, household equipment and routine household, and others. Data is shown monthly from December 2007 till September 2022.
This data reported many indicators highlighting the increase in poverty on multiple sides. It is worth reporting that the consumer price index (CPI) Housing Utilities in Lebanon records the highest score this September 2022 (363.3) compared to October 2021 (215.9).
Looking at the nutrition level, food inflation was detected as the cost is more skewed to the right for the year 2021-2022; rising food prices reduce the purchasing power of food consumers. Another devaluation could be mentioned in the transportation sector, as the transportation sub-index of the CPI basket in Lebanon increased by 2339 points in September of 2022 (3,725), compared to August 2021 (1,386); the cost of transportation is significantly increasing, resulting in a limitation to access in the transportation sector.
It is worth mentioning that the CPI in Lebanon has more than doubled over the past year, peaking this September 2022 at a score of 1,611.4 against 714.8 in October 2021, and a higher CPI indicates higher inflation. This eventually leads to adjustments in the cost of living and income, which tends to worsen inequality or poverty as it hits income and savings harder for poorer or middle-income households than for wealthy households.
Healthcare System:
As stated by Joao Martins, MSF Head of Mission in Lebanon, “The crisis in Lebanon has been driven by years of corruption and now we are seeing that this can contribute to the destruction of an entire health system just as effectively as war or a natural disaster”. As a result, it is important to conduct a deep dive analysis on the healthcare system in Lebanon which is a dimension that measures multidimensional poverty.
First we will look at the current health expenditure (%of GDP) which takes into account the public and private health expenditure. By comparing Lebanon to the Arab World, we can notice that the current health expenditure is higher along the mid 2000 with Lebanon having 11% in 2000 while the Arab World having 4%. After that, Lebanon witnessed a decrease and the Arab World an increase reaching a value of 9% and 5%, respectively. The decrease in the expenditure in Lebanon has negatively affected the healthcare system as medication and vaccines are becoming scarce. Looking more closely, we can see in the next graph that the access to immunization has tremendously decreased in Lebanon. On average the access to vaccines (such as DPT, HepB3, and measles) has decreased from 83% (2000) to 67% (2021).
On another hand, we evaluated the demand for private insurance in Lebanon. As we can see, the demand has decreased from 70% (2000) to 45% (2021). This decrease is due to all private insurance companies converting their payment method to fresh U.S. dollars and since the NSSF benefits have diminished due to the economic crisis, most Lebanese people are now left with no proper access to health assistance.
Education:
We also conducted a survey on school and university students to analyze access to online education during the COVID-19 pandemic which was also identified as the new normal.
You can be part of our project by filling this online survey. Your answers are highly valuable to the development of our dashboard since the larger the sample size, the more accurate our results would be.
At a later stage, we would like to present our results to our target audience which are UN agencies, local NGOs, and Lebanese ministries. We got a total of 135 responses from all over Lebanon where the survey was populated via social media platforms. The majority of the respondents were university students or graduates. Most of them were unemployed or employed in a full time position.
We asked the respondents about their evaluation to their online experience; the answers rated their experience as poor or fair. On a scale from 1 being a very bad experience and 5 being a very good experience, most of the respondents rated the effectiveness of online learning as 3. In addition, we asked about the preferred type of education; the majority answered the traditional physical method as the most preferred following the hybrid method as second preferred. These answers make us conclude that the online learning experience was not that good in Lebanon. This might be due to the lack of training from the government and the teachers.
To further explore the facilities that were available to ease the online learning experience, we asked the people about their access to devices, electricity and internet. For the devices, the majority had access to devices that were mainly Mobile phones or laptops. Most of the respondents have access to electricity but not all the time while almost all the respondents have access to internet but the variance changed between access all the time and access but not all the time. Most of the respondents reflected that they couldn’t focus and they weren’t serious about their studies during online learning. Furthermore, on a scale from 1 being not at all to 5 being for sure, we asked the people about their willingness to retake the online experience. The answers varied between 1 and 2 mainly.
Finally, we asked the people about the disadvantages of online learning. Some of the responses include poor network, electricity cuttage, procrastination, weak communication, lack of motivation to study, more distraction, professors are not equipped with the resources, challenging experience for both students and professors. From this survey, we can conclude that Lebanon wasn’t prepared well for such a situation, especially its basic infrastructure which includes bad electricity and network services.
By Razan Tayba, Zeinab Nassar, Jalal Abboud, Dana Najjar, Ali Sabra
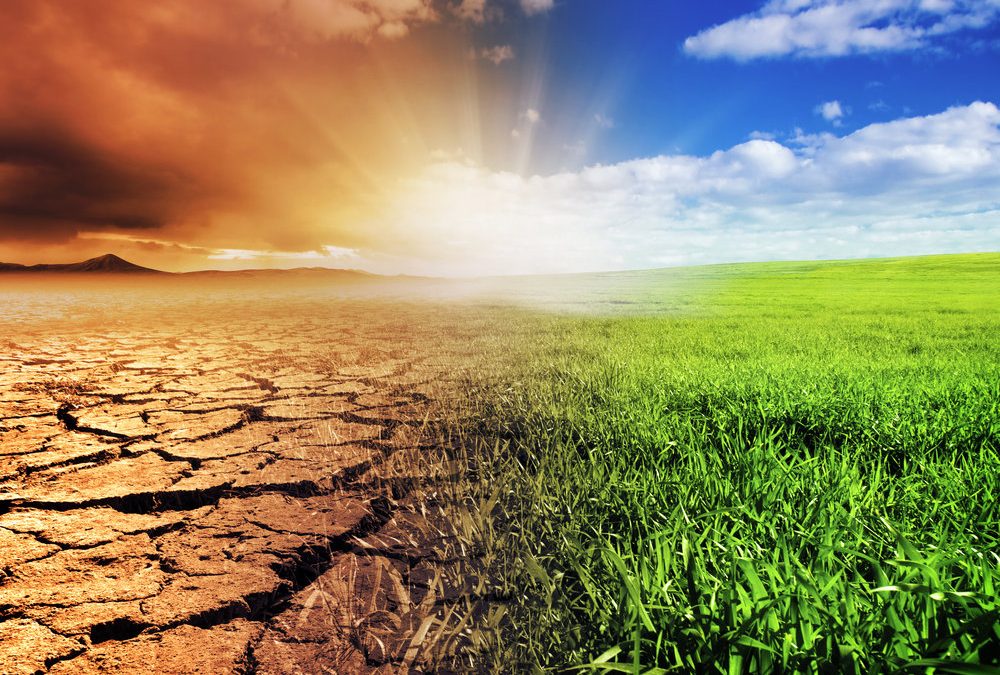
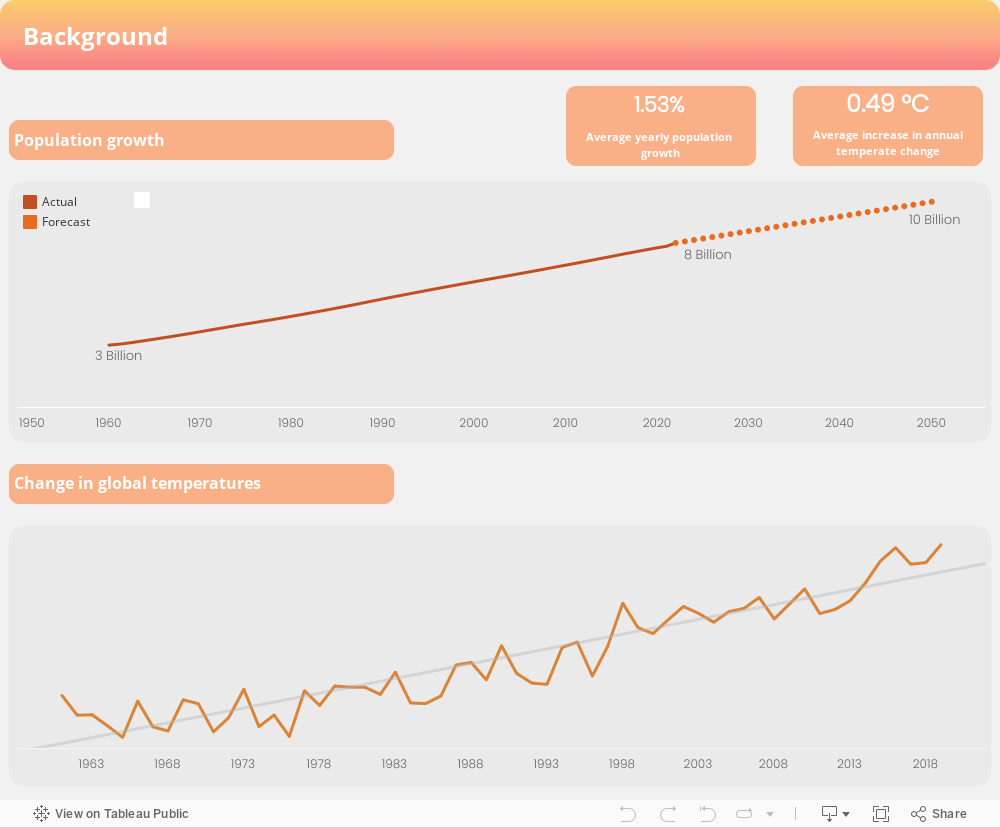
The world’s population has significantly expanded over the ages, on November 15, 2022, it was announced that the world population officially hit the 8 billion mark. Population growth is not expected to slow down. In fact, the UN projects that by 2050, there may be 10 billion people on the planet (Guterres, 2022).
With population growth, comes an increased demand for food, energy, and water. The deployment of new technologies and economic expansion have been able to meet this need during the past 70 years. However, meeting the growing global demand comes at a high cost: increased production levels lead to increased emissions of greenhouse gases. Greenhouse gases trap heat from the sun within the Earth’s atmosphere, contributing to global warming (Bednarski).
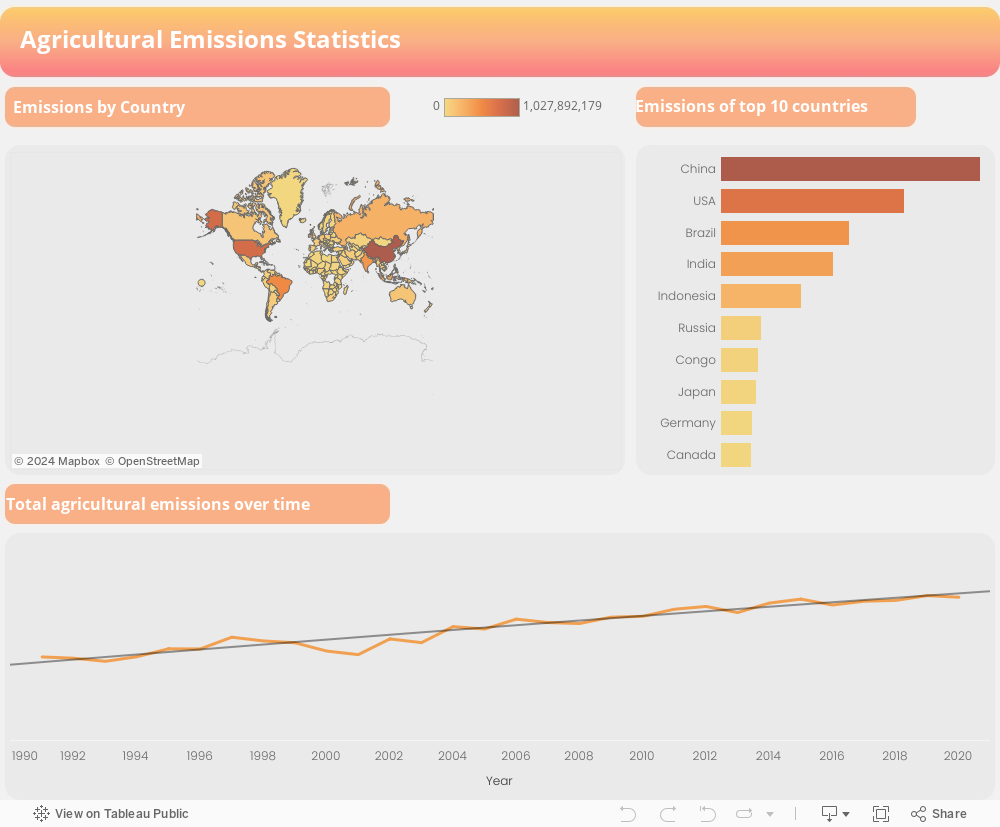
The annual maximum temperature on Earth is increasing drastically, and part of this increase is directly tied to greenhouse gas emissions from agricultural production and livestock. The agriculture industry is known to account for between 25 and 30 percent of the world’s total greenhouse gas emissions. Different types of emissions from agriculture include nitrous oxide (N2O), methane (CH4), and carbon dioxide (CO2) (Stephen, 2014).
The main question is “How can we ensure that we continue to meet the global need for food while reducing emissions so that our food production is sustainable? In other words, how can we change how we consume or produce food to preserve the planet for future generations?
What can be done?
In order to reduce greenhouse gas emissions, the general public has to be urged to shift their consumption and farmers to shift their production from food types that produce high levels of greenhouse gas emissions to those that make low levels. Also, government entities have to be urged to attempt to regulate the supply and demand of food items. For example, if the government taxes items that produce high levels of greenhouse gas emissions, the price tag of these items increases, and customers are more likely to shift away from these items to more cost-friendly alternatives. The government could also impose requirements for food sellers to add tags on packages of high greenhouse gas emission items indicating to customers the environmental impact relating to these items. If customers are responsive to this information, this would further reduce demand for these high-emission food items. This would indirectly impact farmers and other suppliers who are likely to decrease production or importation of these items when the demand for them decreases. Another example is that if government subsidizes seeds, eco-friendly fertilizers, and other raw materials used for the production of low-emission food types, this could incentivize farmers to increase the supply of items and offer them to customers at a lower cost. This would indirectly impact consumer demand since they may shift away from more expensive food items with higher emissions toward more cost-friendly items with lower emissions.
In order to help the stakeholders make the above decision, the below tableau story was created consisting of multiple dashboards that contain visualizations for both consumers and producers of food as well as governments. One of the dashboards contains emission levels of different food items as well as a breakdown of the percentage of emission coming from each source activity involved in the production of this food item. The general public can use this specific dashboard to decide what to consume and what to avoid and farmers to decide what to grow or not to grow. The same dashboard can be used by governments to regulate the demand and supply of food items based on their respective greenhouse gas emission levels.
Another dashboard within the Tableau story, which is of importance to farmers, is a dashboard containing information about land usage and water usage by each food item. This can help the producer determine the feasibility of planting specific items based on the availability of resources at hand. The Tableau story tool also consists of several other dashboards that the stakeholders may be interested in for informational purposes.
Solution Validation
Our solution is multifaceted due to the existence of multiple stakeholders: the general public, governmental entities, and the Food and Agriculture Organization of the United Nations (FAO).
Since it’s impossible to meet with governmental entities or the Food and Agriculture Organization of the United Nations (FAO) at the time being, a reach out was done to the general public as a first step. The aim of it was to know how aware people were about the contribution of agriculture and food choices to greenhouse emissions and global warming, people’s dietary preferences, and how willing they were to make changes to their consumption choices to reduce greenhouse emissions. The mode of communication was through a survey consisting of the following questions:
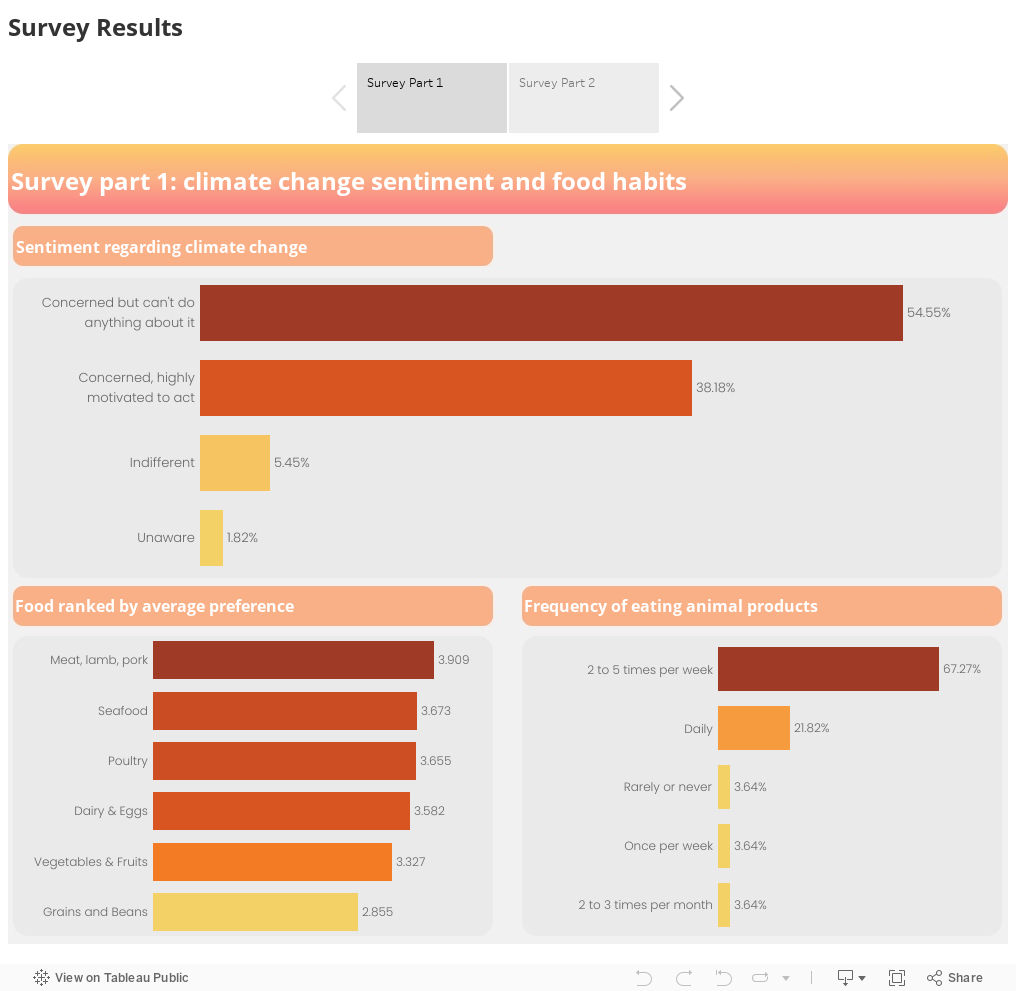
How do you feel about climate change? (Choices: unaware, indifferent, concerned but can’t do anything, highly motivated to act on reducing climate change)
Rank the below food groups from your favorite (rank 1) to the least favorite (rank 6). (Food groups: Grains and beans, Dairy and Eggs, Meat/lamb/pork, Poultry, Seafood, Vegetables/fruits).
How often do you eat meats (beef/lamb/pork/poultry)? (Choices: daily, 2-5 times a week, once per week, 2-3 times per month, rarely or never)
Would you choose to eat fewer “portions of meat” in order to reduce greenhouse emissions? (Choices: Yes, No)
If you had land that could be dedicated to agricultural purposes, would you consider greenhouse emissions as a factor in deciding what to grow? (Choices: Yes, No).
The first three questions were presented to individuals without any prior knowledge of our project findings. After these questions were answered, a tree map was portrayed showing greenhouse gas emissions by food type. Following the visualization, the individuals were prompted to answer the remaining two questions.
The results of the survey indicated that most people are knowledgeable about climate change and ready to act to curb it or are willing to make changes but don’t think they can do anything to make a positive impact. Meats including beef, pork, and poultry are popular favorites. However, despite their preferences, most people were willing to change their consumption choices to decrease the detrimental impact on the environment. The main takeaway from the survey was that more awareness needs to be raised about the emissions emitted from the production of different food products to better equip each stakeholder to make decisions that are less harmful to the environment. Our study clearly shows the contribution of greenhouse gas emissions by food type so if people take actions to reduce their intake and or production of these food types with high yields of greenhouse gas emissions, collectively, the level of greenhouse gas emissions coming from agriculture and food consumption can decrease.
Recommendations
Everyone needs to do their part in curbing climate change. As individuals, we can choose our consumption behavior by shifting away from food items that result in high emissions of greenhouse gases. This will indirectly affect supply since producers are less likely to keep producing/importing items that are not demanded as much. Furthermore, if individuals have their own land that can be used for agricultural purposes, they can focus on growing items with low emission rates.
The government also has a role in reducing greenhouse gas emissions from agricultural sources. Governments can directly impact demand by imposing taxes on food or feed items that result in high emission rates. This can result in consumers shifting away from these items for more affordable options. On the other hand, governments can directly impact supply by subsidizing seeds or eco-friendly fertilizers for the production of specific low-emission food items. This would incentivize farmers to focus on producing and selling low-emission foods and shift away from high-emission foods. Since the governments have the ability to impact both supply and demand, we recommend that the Lebanese Ministry of Agriculture, Lebanese Ministry of Environment, and Lebanese Ministry of Finance work together to raise awareness about the impact of emissions from agricultural activities and food consumption and implement these taxes and subsidies accordingly.
Finally, we urge the Food and Agriculture Organization of the United Nations (FAO) to host global campaigns that raise awareness about the contribution of greenhouse gas emissions from agricultural activities and food consumption. The FAO can recommend changes in food consumption choices to consumers and it can set goals for and advise governments about potential policies they can implement to decrease national emissions.
Contributors: Aya Zeini, Baraa Abo Ghouch, Eslam Abo Al Hawa, Layan El Kaissi, Marian Abou Fares, Mhammad Nahle.
For the past 25 years, Netflix has always been the largest streaming service in the world as it holds more than 10% of the global internet traffic. New players have joined the competition and they are growing rapidly, and the question is: How will Netflix be able to maintain its dominant position?
In Q1 2022, Netflix lost around one million subscribers, and this was the first drop in number of subscribers for the past 10 years which led to a huge drop in its stock price and market share as it went down from 690.3 till 190.4 within 7 months only. On the other hand, Netflix income has always been increasing especially from 2022 as it was 2,219 where it became 4,500 but in 2022 it decreased for the first time by 1.6% and this is where they felt there is an urgent need for call of action.
One of the problems Netflix was facing is relying on licensed titles which counts for 97% of the content in 2016. After they started losing those licensed titles, they had to remove them which led to losing a lot of subscribers. ‘Criminal Minds’ is the top-watched licensed show on Netflix as of 2021 and it was later removed due to licensing issues which was disappointing to Netflix users and as per our survey, 51% users canceled their subscription after they hooked on a Netflix series and found it was removed. By 2022, they increased the percentage of produced original titles by 50%. They followed this strategy of spending a lot of money into making originals to fuel their subscription growth especially after subscribers began to hemorrhage.
Netflix is also struggling from the competition. In Q2 2022, Disney platforms had 27.3% (year over year) growth of subscribers compared to 5.5% for Netflix. Can you imagine their growth in coming years?
Despite the fact that Netflix is struggling to maintain its trajectory, they still have the biggest overall subscribers base and have a history of innovation that is going to be very difficult for any competitor to defeat. Currently, Netflix is planning to introduce a cheaper membership that includes advertising to grasp more subscribers. Although this is a good step to start with, but they still have to work at being nimbler and more dynamic with packaging and bundling so most people don’t like to be distracted by adds while watching and this has been validated in our survey. At the same time we found out that 72% of our surveyed Netflix users 72% aren’t willing to switch to another platform and 82% said they enjoy original titles produced by Netflix.
This proves the point that Netflix users are loyal and didn’t give up on the platform but rather they demand improvements to meet their needs. Therefore, if Netflix can continue to produce original titles that creates a significant reaction from users and impress them, users will find value in their membership. Moreover, investors should keep an eye out for Netflix’s following releases and viewership to see if the platform is still breaking records and satisfying viewers. This is a streaming war, if Netflix decides to resist and fight back, the chances of Netflix falling below their competitors are slim.