
By Razan Tayba, Zeinab Nassar, Jalal Abboud, Dana Najjar, Ali Sabra
The world’s population has significantly expanded over the ages, on November 15, 2022, it was announced that the world population officially hit the 8 billion mark. Population growth is not expected to slow down. In fact, the UN projects that by 2050, there may be 10 billion people on the planet (Guterres, 2022).
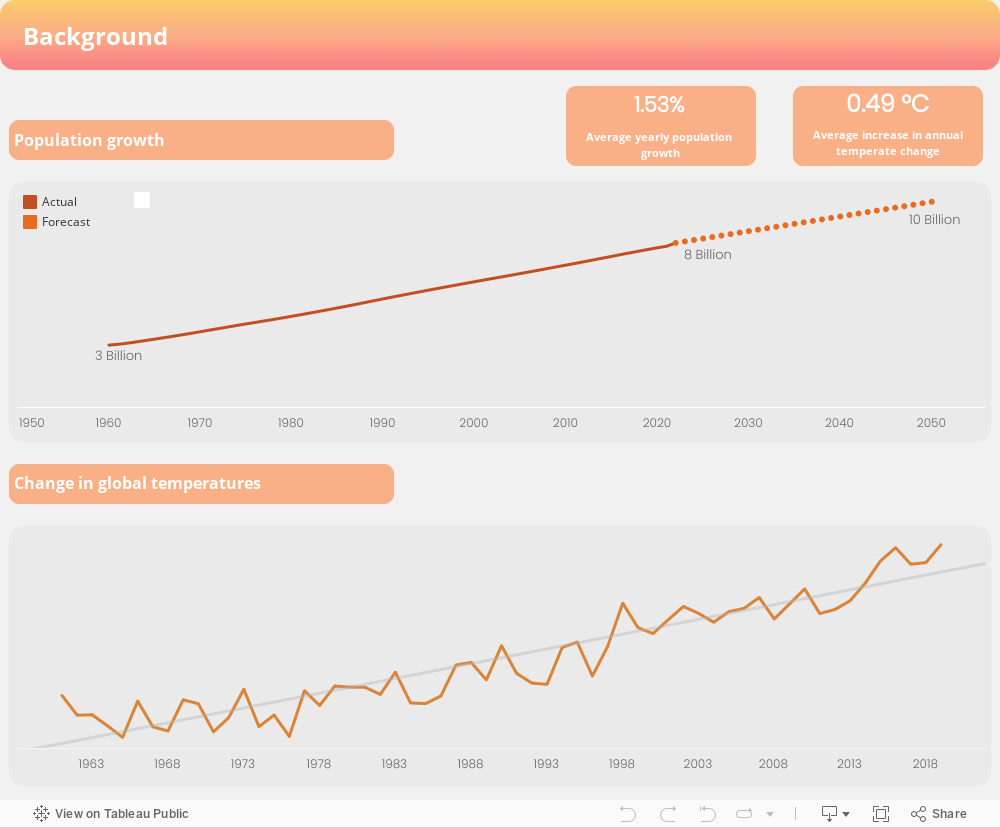
With population growth, comes an increased demand for food, energy, and water. The deployment of new technologies and economic expansion have been able to meet this need during the past 70 years. However, meeting the growing global demand comes at a high cost: increased production levels lead to increased emissions of greenhouse gases. Greenhouse gases trap heat from the sun within the Earth’s atmosphere, contributing to global warming (Bednarski).
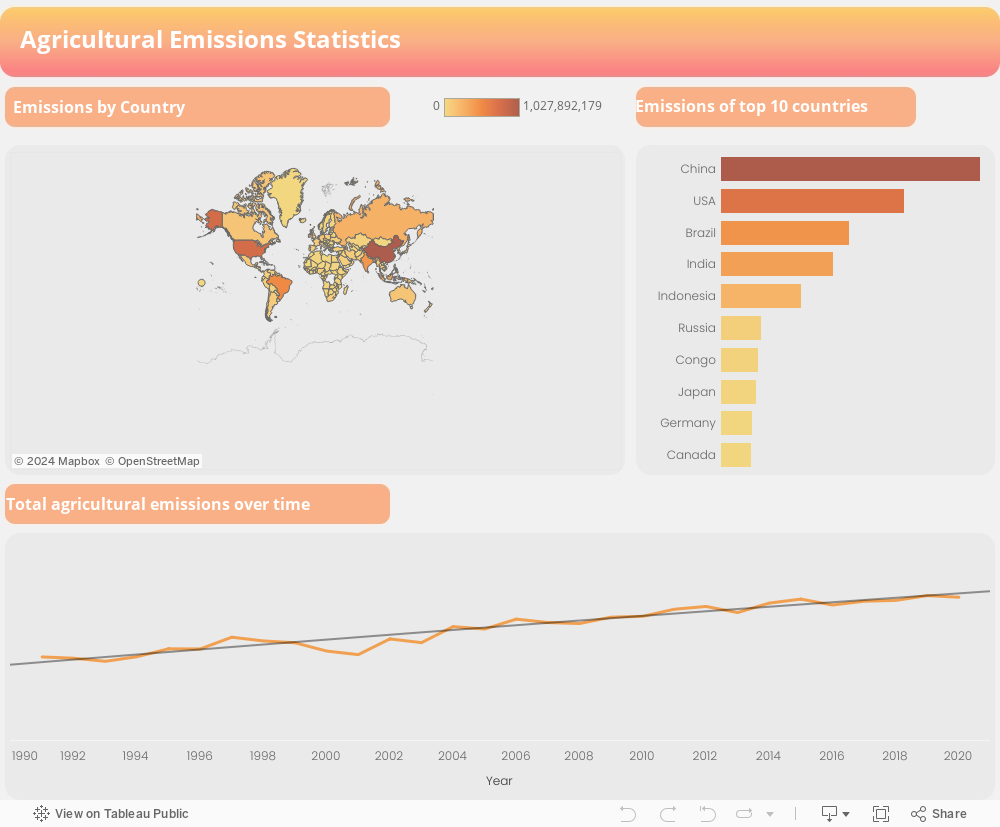
The annual maximum temperature on Earth is increasing drastically, and part of this increase is directly tied to greenhouse gas emissions from agricultural production and livestock. The agriculture industry is known to account for between 25 and 30 percent of the world’s total greenhouse gas emissions. Different types of emissions from agriculture include nitrous oxide (N2O), methane (CH4), and carbon dioxide (CO2) (Stephen, 2014).
The main question is “How can we ensure that we continue to meet the global need for food while reducing emissions so that our food production is sustainable? In other words, how can we change how we consume or produce food to preserve the planet for future generations?
What can be done?
In order to reduce greenhouse gas emissions, the general public has to be urged to shift their consumption and farmers to shift their production from food types that produce high levels of greenhouse gas emissions to those that make low levels. Also, government entities have to be urged to attempt to regulate the supply and demand of food items. For example, if the government taxes items that produce high levels of greenhouse gas emissions, the price tag of these items increases, and customers are more likely to shift away from these items to more cost-friendly alternatives. The government could also impose requirements for food sellers to add tags on packages of high greenhouse gas emission items indicating to customers the environmental impact relating to these items. If customers are responsive to this information, this would further reduce demand for these high-emission food items. This would indirectly impact farmers and other suppliers who are likely to decrease production or importation of these items when the demand for them decreases. Another example is that if government subsidizes seeds, eco-friendly fertilizers, and other raw materials used for the production of low-emission food types, this could incentivize farmers to increase the supply of items and offer them to customers at a lower cost. This would indirectly impact consumer demand since they may shift away from more expensive food items with higher emissions toward more cost-friendly items with lower emissions.
In order to help the stakeholders make the above decision, the below tableau story was created consisting of multiple dashboards that contain visualizations for both consumers and producers of food as well as governments. One of the dashboards contains emission levels of different food items as well as a breakdown of the percentage of emission coming from each source activity involved in the production of this food item. The general public can use this specific dashboard to decide what to consume and what to avoid and farmers to decide what to grow or not to grow. The same dashboard can be used by governments to regulate the demand and supply of food items based on their respective greenhouse gas emission levels.
Another dashboard within the Tableau story, which is of importance to farmers, is a dashboard containing information about land usage and water usage by each food item. This can help the producer determine the feasibility of planting specific items based on the availability of resources at hand. The Tableau story tool also consists of several other dashboards that the stakeholders may be interested in for informational purposes.

Solution Validation
Our solution is multifaceted due to the existence of multiple stakeholders: the general public, governmental entities, and the Food and Agriculture Organization of the United Nations (FAO).
Since it’s impossible to meet with governmental entities or the Food and Agriculture Organization of the United Nations (FAO) at the time being, a reach out was done to the general public as a first step. The aim of it was to know how aware people were about the contribution of agriculture and food choices to greenhouse emissions and global warming, people’s dietary preferences, and how willing they were to make changes to their consumption choices to reduce greenhouse emissions. The mode of communication was through a survey consisting of the following questions:
- How do you feel about climate change? (Choices: unaware, indifferent, concerned but can’t do anything, highly motivated to act on reducing climate change)
- Rank the below food groups from your favorite (rank 1) to the least favorite (rank 6). (Food groups: Grains and beans, Dairy and Eggs, Meat/lamb/pork, Poultry, Seafood, Vegetables/fruits).
- How often do you eat meats (beef/lamb/pork/poultry)? (Choices: daily, 2-5 times a week, once per week, 2-3 times per month, rarely or never)
- Would you choose to eat fewer “portions of meat” in order to reduce greenhouse emissions? (Choices: Yes, No)
- If you had land that could be dedicated to agricultural purposes, would you consider greenhouse emissions as a factor in deciding what to grow? (Choices: Yes, No).
The first three questions were presented to individuals without any prior knowledge of our project findings. After these questions were answered, a tree map was portrayed showing greenhouse gas emissions by food type. Following the visualization, the individuals were prompted to answer the remaining two questions.
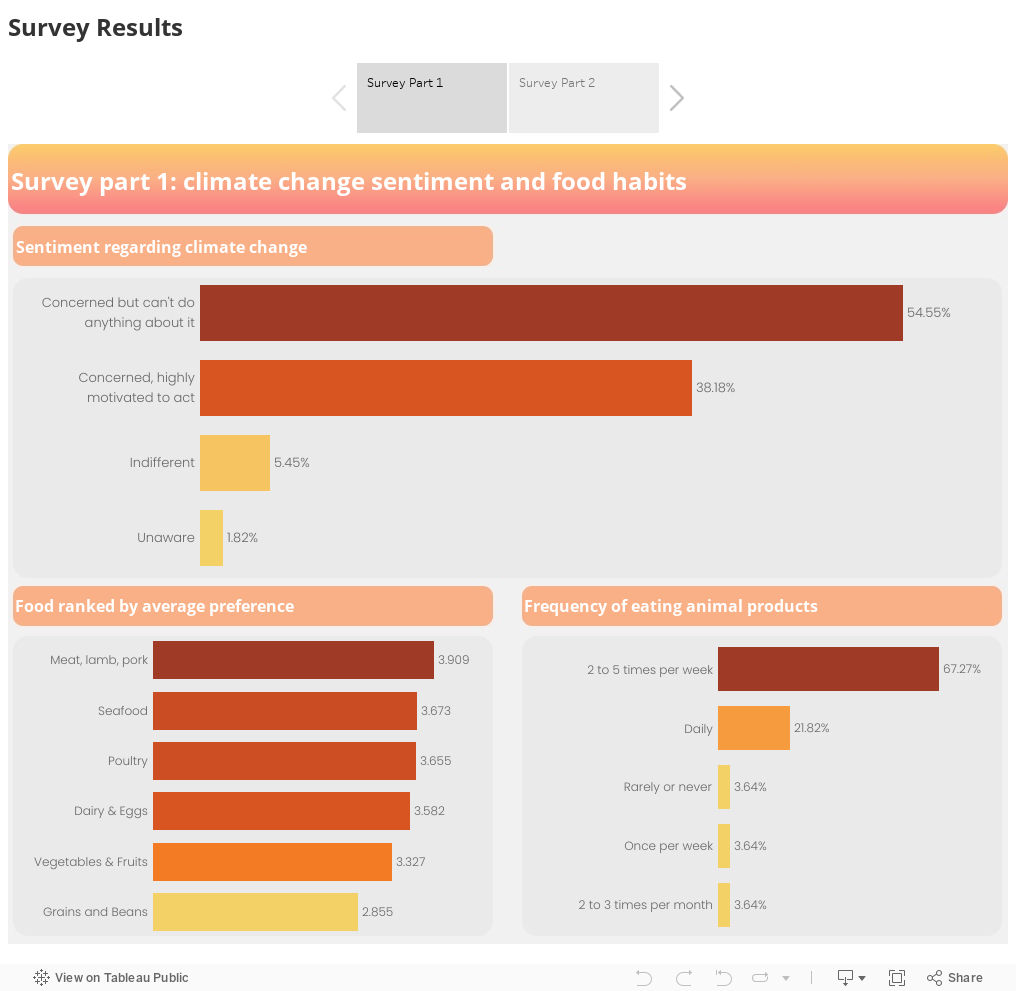
The results of the survey indicated that most people are knowledgeable about climate change and ready to act to curb it or are willing to make changes but don’t think they can do anything to make a positive impact. Meats including beef, pork, and poultry are popular favorites. However, despite their preferences, most people were willing to change their consumption choices to decrease the detrimental impact on the environment. The main takeaway from the survey was that more awareness needs to be raised about the emissions emitted from the production of different food products to better equip each stakeholder to make decisions that are less harmful to the environment. Our study clearly shows the contribution of greenhouse gas emissions by food type so if people take actions to reduce their intake and or production of these food types with high yields of greenhouse gas emissions, collectively, the level of greenhouse gas emissions coming from agriculture and food consumption can decrease.
Recommendations
Everyone needs to do their part in curbing climate change. As individuals, we can choose our consumption behavior by shifting away from food items that result in high emissions of greenhouse gases. This will indirectly affect supply since producers are less likely to keep producing/importing items that are not demanded as much. Furthermore, if individuals have their own land that can be used for agricultural purposes, they can focus on growing items with low emission rates.
The government also has a role in reducing greenhouse gas emissions from agricultural sources. Governments can directly impact demand by imposing taxes on food or feed items that result in high emission rates. This can result in consumers shifting away from these items for more affordable options. On the other hand, governments can directly impact supply by subsidizing seeds or eco-friendly fertilizers for the production of specific low-emission food items. This would incentivize farmers to focus on producing and selling low-emission foods and shift away from high-emission foods. Since the governments have the ability to impact both supply and demand, we recommend that the Lebanese Ministry of Agriculture, Lebanese Ministry of Environment, and Lebanese Ministry of Finance work together to raise awareness about the impact of emissions from agricultural activities and food consumption and implement these taxes and subsidies accordingly.
Finally, we urge the Food and Agriculture Organization of the United Nations (FAO) to host global campaigns that raise awareness about the contribution of greenhouse gas emissions from agricultural activities and food consumption. The FAO can recommend changes in food consumption choices to consumers and it can set goals for and advise governments about potential policies they can implement to decrease national emissions.
0 Comments