Price Variation of Commodities in Lebanon: A Cross Sectional Study
In the spirit of collaboration, the incredible individuals behind this project:
- Anthony Aramouny
- Ghassan Shammas
- Malak Wehbe
- Mohammad Abdul Rahman
- Rawad Abi Zeid
- Zeinab Mortada
Prices Variation Rational
Commodities price variation in Lebanon has been the center of many socio-economic activities and concerns in the past 2 decades. In fact, notwithstanding the underlying concept of inflation (or deflation), the issue has a deep social stability construct: Food security for the poor and the poorer. No matter what the GDP is per capita, it is essential to understand that when commodities prices vary a substrate of the Lebanese society feels the impact much stronger than others: those below the line of poverty.
The Problem
Relying on the data published by www.humdata.org on the yearly prices of goods in Lebanon, it is clear that the consumer encounters prices variation, within the same period of time between the different regions in Lebanon. This is clear in the visuals published below.
We believe that the problem resides in the following issues:
- Lebanon lacks sufficient personnel involved in the prices control at the economy of economy and trade.
- It has Limited reach on price controls and prices ceiling.
- It Lacks specialized domestic food security experts.
- It lacks total agricultural programming to supplement the market with commodities in crisis.
- It lacks cheap national transport routes for bulk products such as railways. The cost of transport may exceed 30% of the final cost of a commodity.
Details
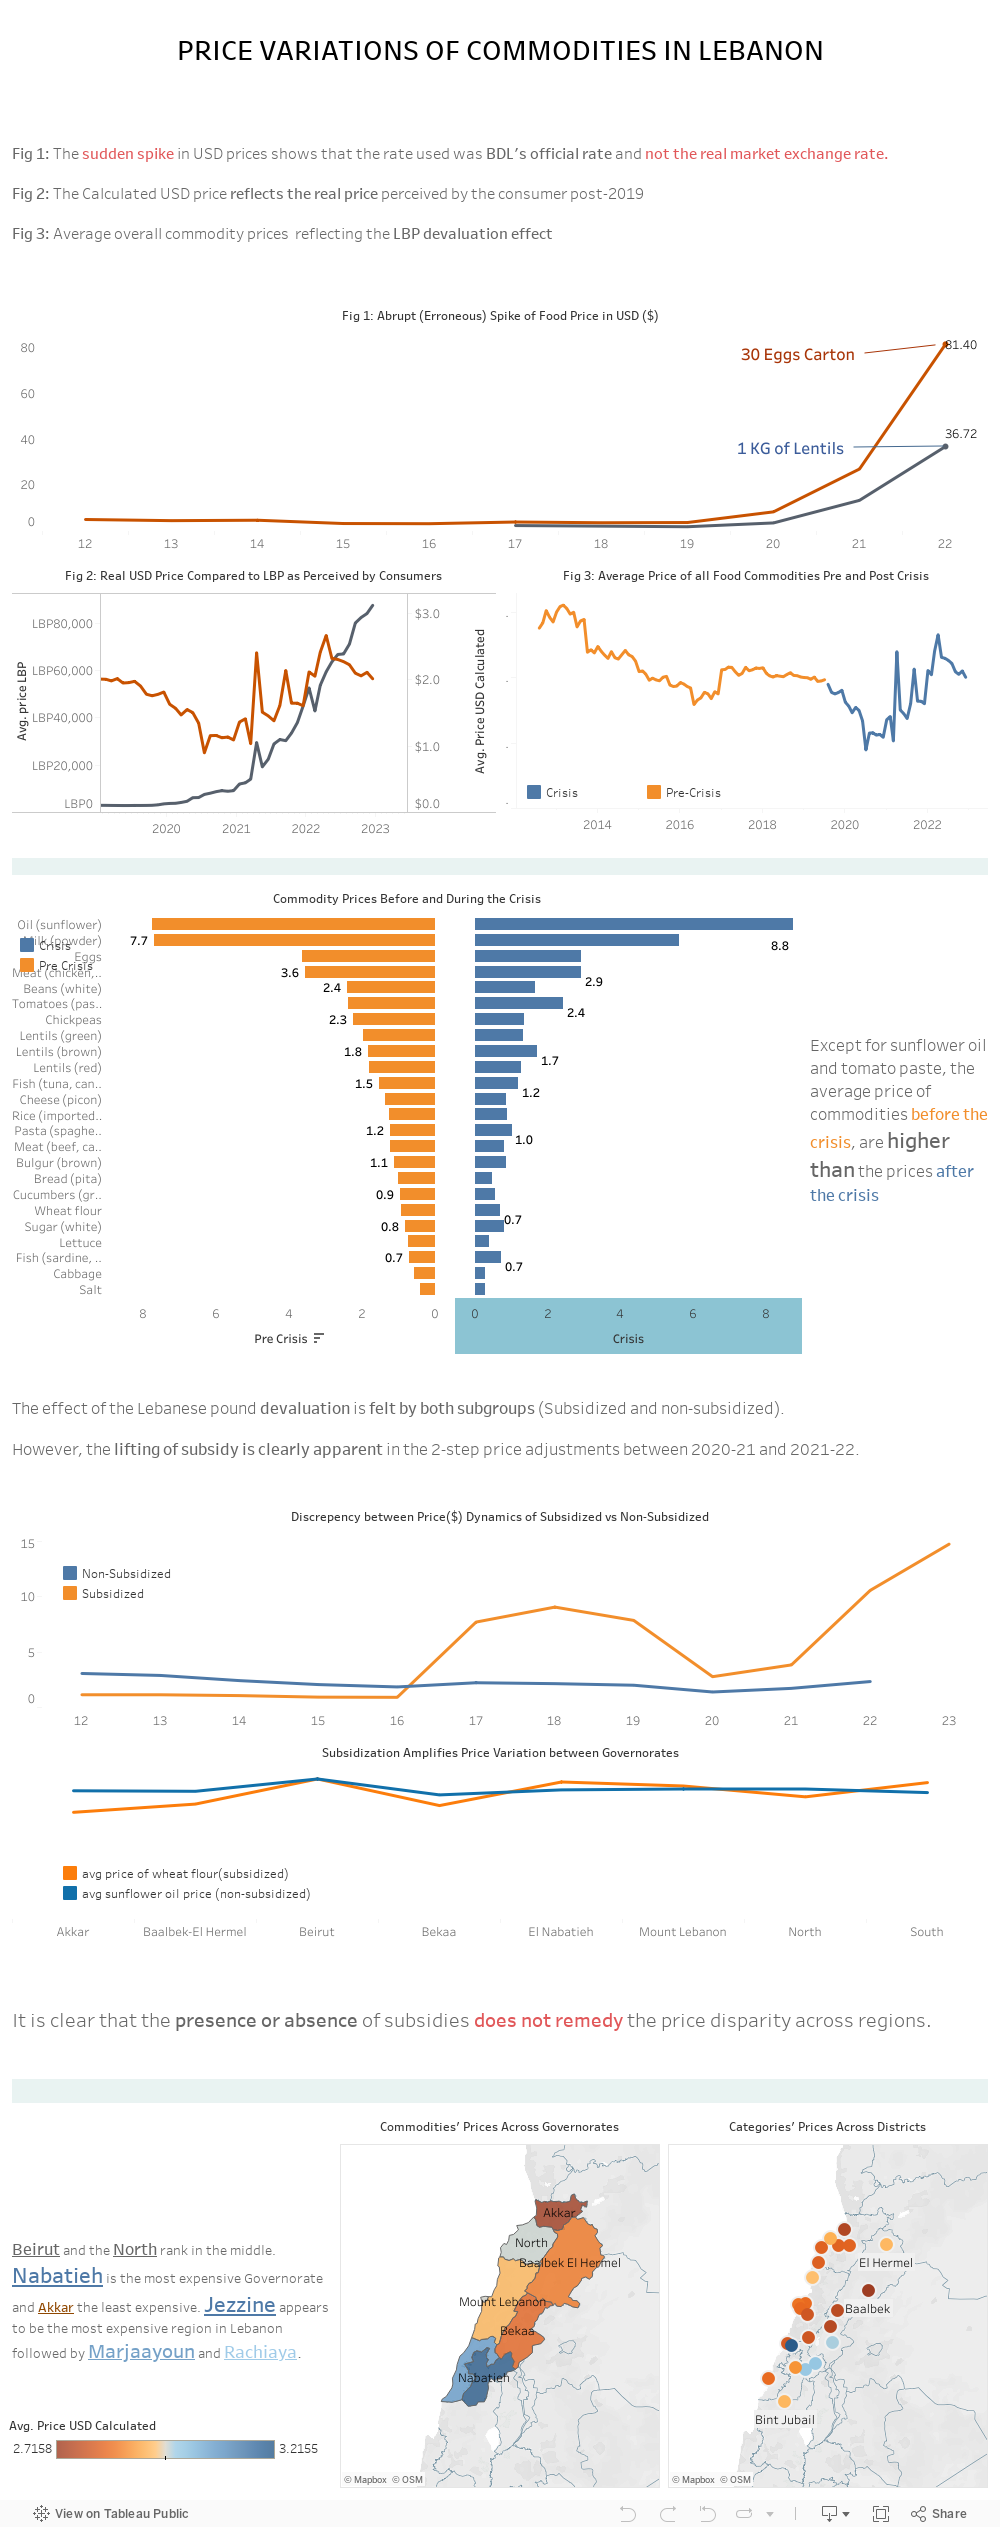
It is necessary to divide the time series into 3 periods:
- From 2012 to October 2019 i.e. precrisis period
- From October 2019 until end of 2021 (crisis period with subsidized goods)
- 2022 until now, post crisis and post subsidies.
The banking and financial crisis in Lebanon imposed mainly two constraints on the food security issue: i) the strong volatility of the exchange rate against a fixed low official rate of LB1500/$, ii) a subsequent spiraling inflation rate that was strongly reflected on the prices of goods in the country.
Meanwhile, during the first 2 years of the crisis, the government had subsidies on fuel and its derivatives, wheat and bread and some other commodities. The subsidies were lifted during 2021, and the prices were” floating”. For a short period of time, the prices oscillated without any rational and later stabilized due to the rapid dollarization of the retail market: The Lebanese Pound became almost obsolete, superseded by the US$ as a cash for retail transactions. It is to be noted that the salary of the public sector is still indexed to the “old” Lebanese pound exchange rate and hence the public servant are actually those who suffer the most the impact of price variation in Lebanon.
Explore Our Interactive Dashboard below:
For a more in-depth look at our project, we invite you to explore our interactive dashboard. It’s designed to provide you with detailed analytics, and visual insights into our work.