
Rising Traffic Accidents
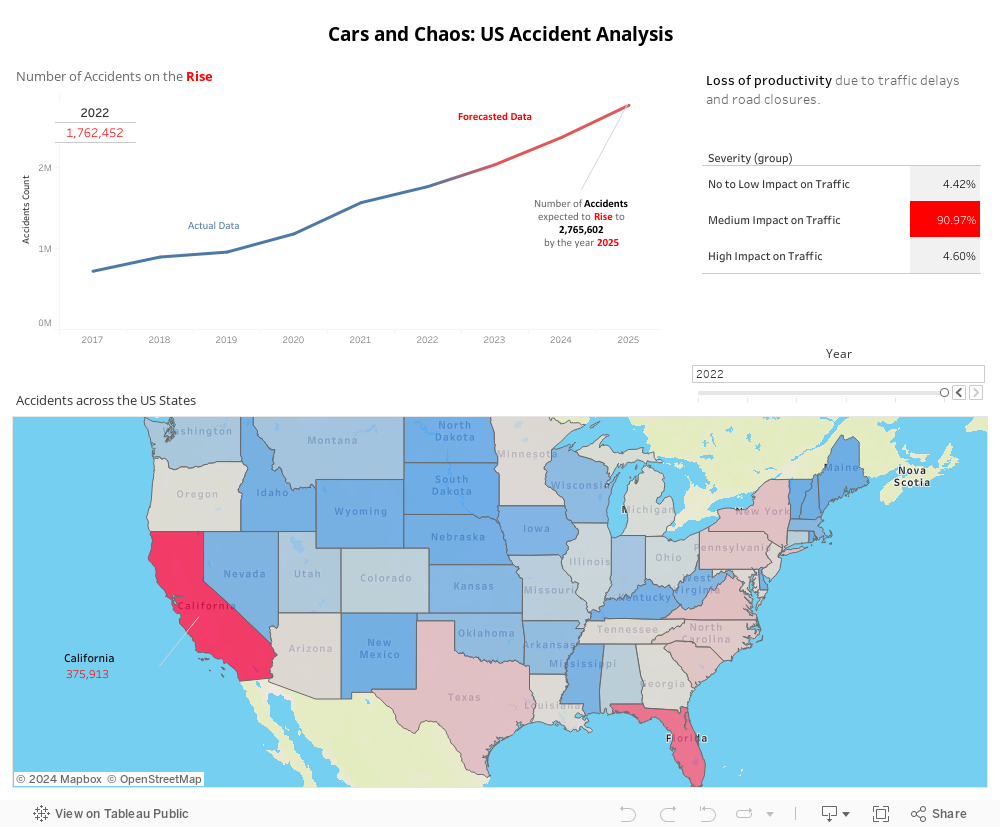
The rise in traffic accidents in the United States poses a critical threat to public safety and disrupts the efficiency of road networks. This trend not only jeopardizes lives but also undermines the reliability of the transportation system, leading to unpredictable and dangerous road conditions. Additionally, these frequent incidents have significant economic implications, straining resources and impacting the broader economy. In 2019, the National Highway Traffic Safety Administration (NHTSA) estimated the economic cost of motor vehicle crashes at $340 billion, nearly 2% of the U.S. GDP. Beyond immediate costs, these accidents strain emergency services and disrupt the transportation of goods, affecting productivity. The current state of road safety in the U.S. presents a significant challenge, with 1.7 million traffic accidents recorded in 2022, with the majority recorded in California. This alarming figure is not just a standalone concern; it is projected to escalate to an estimated 2.7 million by 2025. Such an increase not only signifies a growing risk to public safety but also hints at underlying issues in traffic management and driver behavior. The most telling evidence of this problem is its direct impact on traffic flow. Approximately 80% of these accidents significantly disrupt traffic, leading to delays, increased travel times, and economic costs associated with lost productivity.
Factors Behind US Traffic Incidents
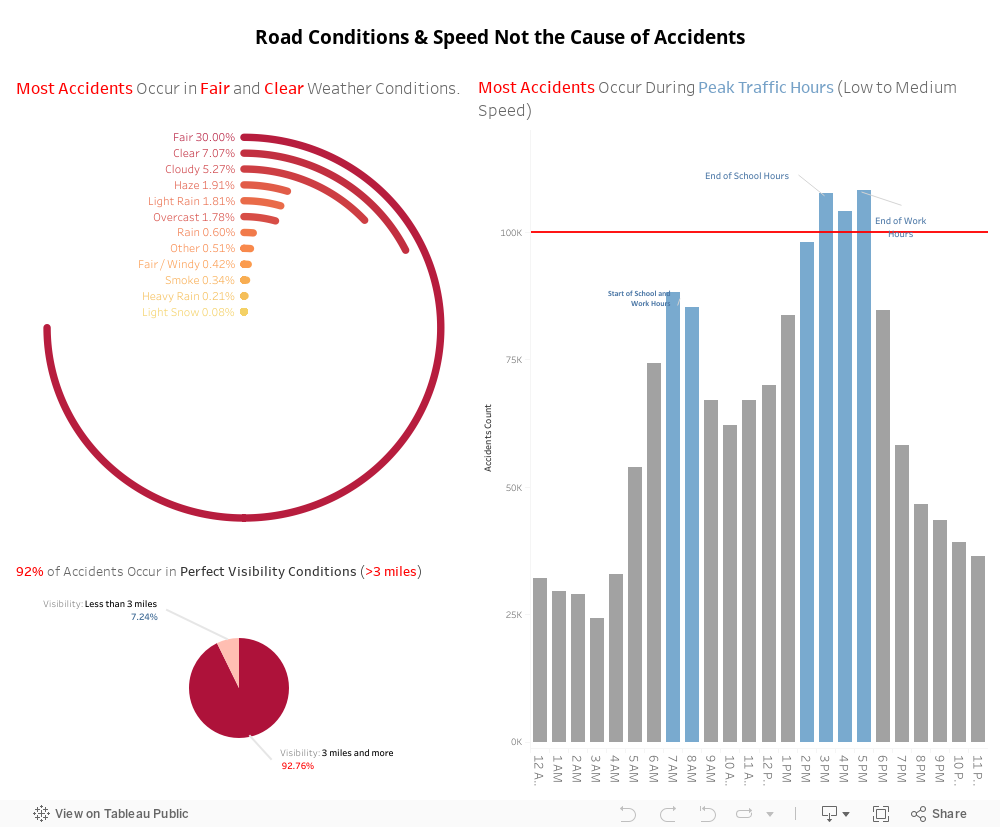
When addressing the challenge of road accidents, a critical first step is identifying the root cause, which literature suggests can be attributed to either Road Conditions or Driver Behavior. Analyzing the data reveals a notable trend – a significant proportion of accidents occur in optimal weather conditions, free from rain or snow that could compromise traction. Equally, visibility does not emerge as a primary factor, with over 90% of accidents transpiring when visibility extends beyond 3 miles. Intriguingly, the majority of accidents unfold during peak traffic hours, indicating a prevalence of low to medium-speed collisions. Importantly, the data suggests that road design is not a predominant issue in these accidents. This underscores the imperative of delving into driver behavior as a key focus for addressing and mitigating the high frequency of road accidents.
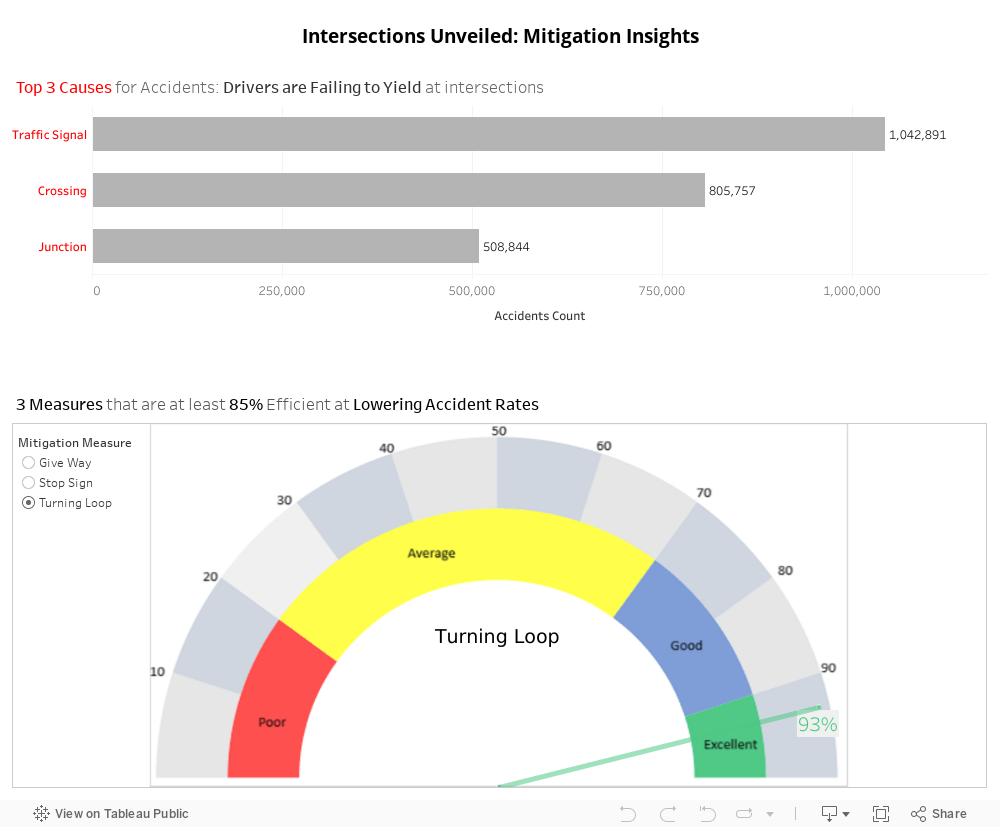
The majority of accidents unfold at key intersections—stop lights, junctions, and crossings—marked as conflict points. These areas pose heightened risk as drivers executing left or right turns must seamlessly merge with oncoming traffic while yielding to vehicles with the right of way. To address this challenge, various mitigation measures can be implemented. Introducing turning loops, employing stop signs, and incorporating give-way protocols are among the strategies aimed at enhancing the safety of these critical points. These measures are designed to streamline traffic flow, clarify right-of-way assignments, and ultimately contribute to a reduction in accidents at these high-risk locations by reducing the need for decision-making by the driver.
Recommended Mitigation Measures
To address the escalating issue of car accidents, particularly those stemming from complex driver decision-making at intersections, a targeted approach is recommended. This approach involves implementing specific traffic management solutions designed to simplify the decision-making process for drivers, thereby reducing the likelihood of accidents. The key elements of this strategy are as follows:
1. Turning Loops:
- Purpose: Turning loops, also known as dedicated turning lanes, provide a designated space for vehicles to make turns without disrupting the flow of through traffic.
- Implementation: These loops are often marked by dedicated lanes with clear signage, allowing turning vehicles to enter and exit the flow of traffic more safely.
- Efficiency: Turning loops have demonstrated a high efficiency rate of 94%, making them a highly effective solution for managing turning movements at intersections.
2. Stop Signs:
- Purpose: Stop signs are effective in controlling the movement of vehicles at intersections, ensuring that drivers come to a complete stop and yield to oncoming traffic before proceeding.
- Implementation: Placing stop signs at appropriate points within an intersection helps regulate traffic and minimizes the risk of collisions, especially in situations where the right of way needs clarification.
- Efficiency: Stop signs exhibit a commendable efficiency rate of 90%, proving to be a reliable means of directing traffic and minimizing conflicts.
3. Give Way Protocols:
-
- Purpose: Give way markings and rules dictate which vehicle has the right of way, helping to prevent conflicts between turning and oncoming traffic.
- Implementation: Clearly marked give-way lines and signs indicate where drivers must yield, promoting smoother merging and reducing the likelihood of accidents caused by confusion regarding right-of-way rules.
- Efficiency: Give-way protocols have demonstrated an efficiency rate of 86%, contributing significantly to the orderliness and safety of intersections.
Loved this
Impressive!
Impressive Work!!! Why are these not implemented everywhere if they are proven efficient
wow perfect!
Very well-structured storytelling using adequate data visualization techniques!
Although there are strict laws, but real street driving is not safe due to irresponsible driving behaviors, especially in locations where the police and cameras are unavailable
the visuals are well thought of and the content is very informative, a job well done!!
So Impressive!!!
well presented !!
nice article. good stastical information.
Great information, clear representation of data.
Loved it
Found this very useful. The content is insightful, well-researched, and presented in a clear and engaging manner.
As a transportation engineer at Dar Al-Handasah, I find this article quite informative and well guided. The significance of turning loops is frequently overlooked, despite their pivotal role in optimising traffic flow. Moreover, finding similar articles as a reference for any project’s traffic assessment has always been challenging.
Solid info! It presents the information in a straightforward and accessible way. Appreciate the clarity and conciseness.
Well presented statistics
I loved how the statistics were visually organized. Made my reading very easy to follow along.
Very informative. I loved the rich analysis of the issue.
The integration of the visuals helped alot, it enriched the information even more.
Sharp, insightful, and easy to understand. Well done.
The structuring is excellent & the information is very availing.
Impressive article on a critical issue
Well done.
The interactive elements enhance user engagement and allow for a more personalized exploration of the data, fostering a deeper connection with the content.
Valuable insights…A commendable effort in shedding light on crucial aspects of road safety.
This initiative adeptly addressed a critical issue with a high level of professionalism.
Excellent choice of visualizations. Perfectly matches the topic.
Clear and precise explanation to a critical issue with efficacious visualizations.
Very interesting and impressive article! Great Job!
So impressive!!
very useful and well presented insights! well done