Embarking on the American Dream: Definitive Analysis to a Successful U.S. Visa Acquisition
The United States of America (USA) is home to more international immigrants than any other country in the world. In fact, the USA has more international immigrants than Germany, Saudi Arabia, Russia and the United Kingdom combined. You, I, and hundreds of students reading this blog are in the midst of crafting our career paths, where many have the aspiration of finding their dream job or pursuing a PhD in the USA. When you reach this point, you start thinking about what company or university to apply to, and your first hope is to get accepted to the university or job you applied for. However, this acceptance would be pending your visa acceptance. This is the stage that many people find to be the most challenging: getting a visa to the US.
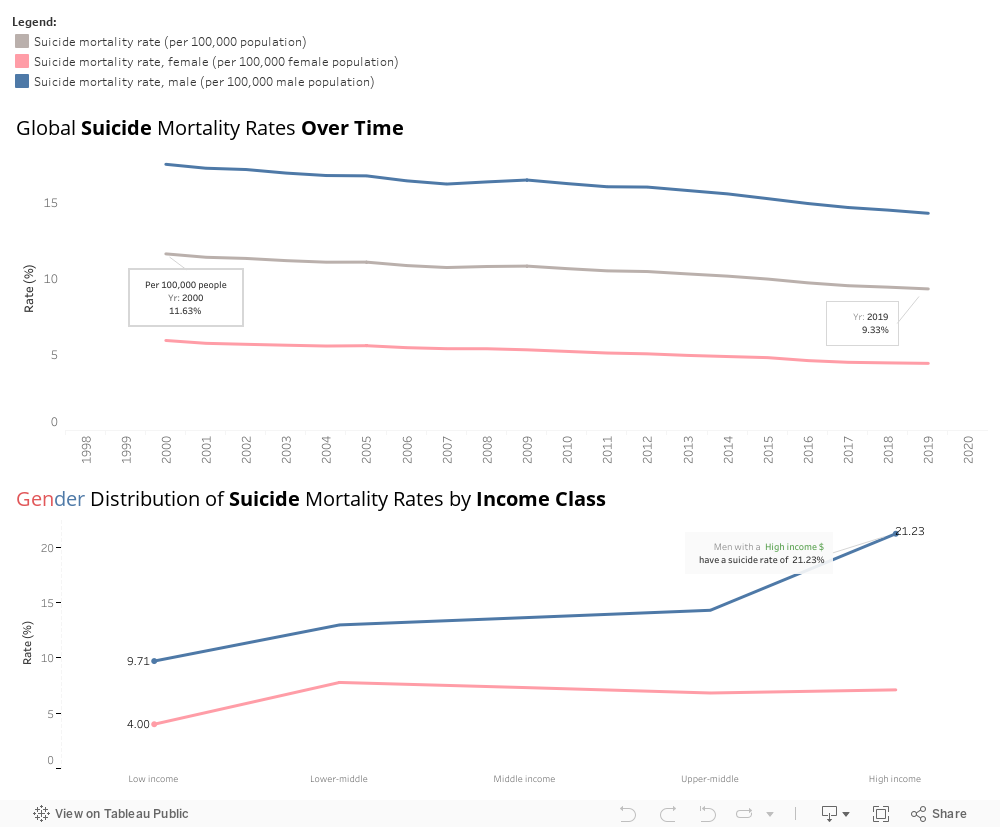
The American dream has been the focus of attention for many visa applicants; as they are seeking better work opportunities, liberty, democracy, and equality. However, behind this pursuit lies a complex factor that shapes the final status of the visa application, as applicants are not seen as equal in the eyes of USA visa employees. Many of an applicant’s uncontrollable demographic characteristics determine the acceptance probability of his application. For example, being from Micronesia gives a 100% rate of the visa being denied. In this blog post, controllable characteristics will be analyzed and visualized to showcase the optimal employee profile that is more likely to be granted a US visa. This blog post will focus on immigrant visas, with a specific emphasis on those related to employees. Using data driven analysis and exploration, the key influencers affecting the US visa acceptance will be explored, and recommendations will be given to solve the ongoing problems facing the US visa application acceptance.
Unlocking Opportunities: Understanding U.S. Work Visas
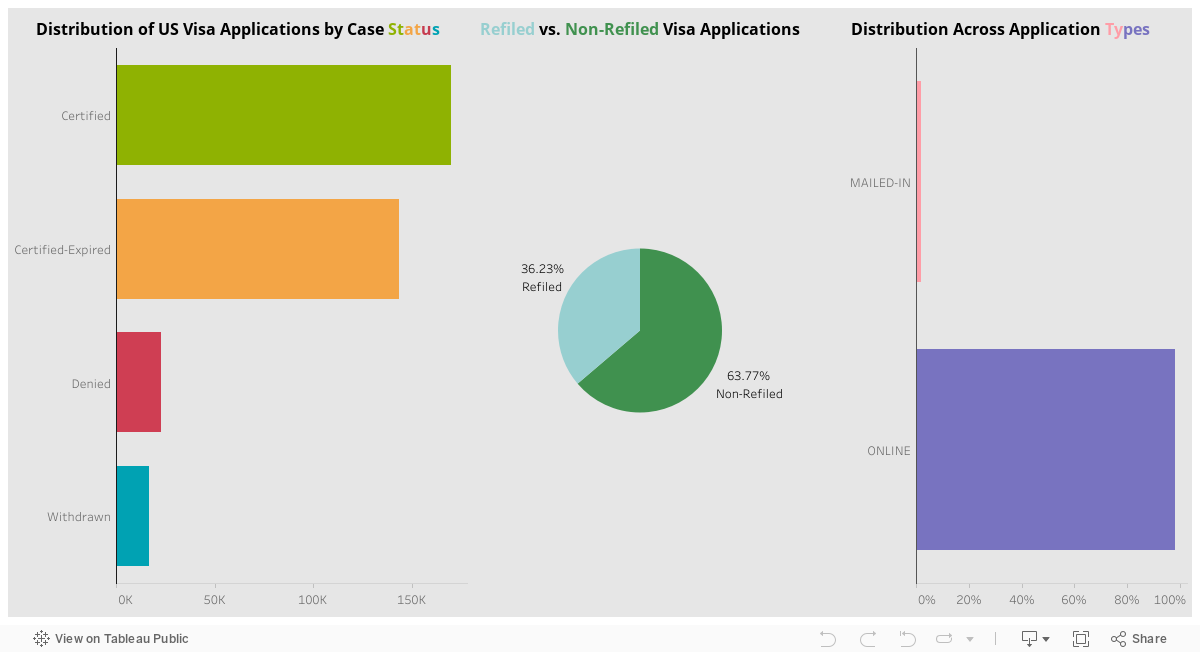
In the following dashboard, you have the option to filter through various visualizations by selecting different case statuses, “refiled” or “non-refiled,” and application types. The initial visualization offers a quick overview of certification rates within the dataset, highlighting that a substantial number of applications, specifically 170,126, have received certification. In contrast, a smaller portion, only 22,912 applications, has been denied. These figures suggest an encouraging trend in the certification process, pointing towards a favorable environment for visa approvals. The positive trend observed in the dataset may have broader policy implications. It could suggest that existing visa policies or recent changes have contributed to a more favorable climate for applicants.
The second visualization delves into the refiled applications, showcasing that 36.23% of submissions have undergone the refile process, while the majority, 63.77%, have not been refiled. This insight could prompt further investigation into the reasons behind refiling and provide valuable information for refining application procedures.
In the third visualization, when visualizing the channels through which applications are submitted, it is evident that a vast majority, 98.4%, are completed online, while a smaller fraction, 1.6%, opts for mailing in their applications. This emphasizes the dominance of digital submissions and suggests an opportunity to optimize online processes.
Three Key Requirements: The Foundation for Visa Success
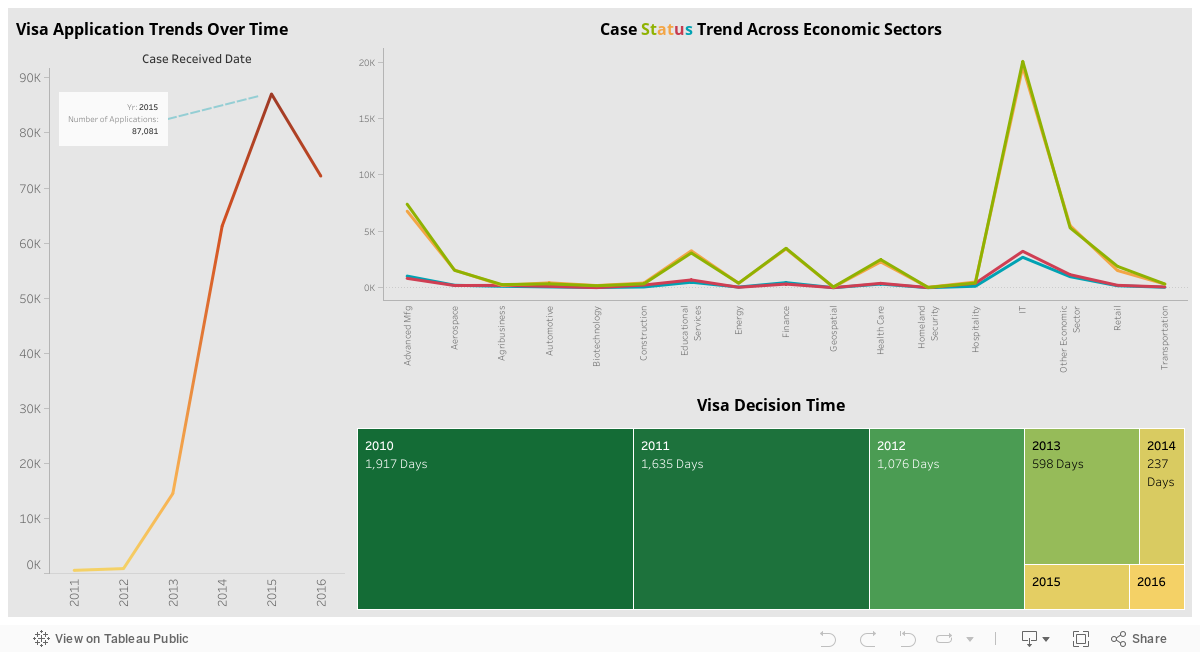
The first visual below tracks the number of received visa applications over the years. Notably, there’s a growth trend from 2011 to 2015, peaking at 87,081 applications. However, the trend reverses in 2016, with a decline to 72,171 applications. This temporal analysis invites exploration into the factors influencing application fluctuations.
Highlighting sector-specific trends, the second visual indicates that the IT sector consistently holds the peak for all case statuses. This insight can guide resource allocation, policy adjustments, or sector-specific considerations to further streamline visa processing.
The third visualization focuses on the duration of visa decisions over time. It unveils a significant decrease from 2010, where decisions took 191.7 days on average, to 2016, where the duration plummeted to 96 days. This trend suggests an improvement in processing efficiency and responsiveness.
In this dashboard, the aim is to dig deeper within the dataset to draw further insights into the optimal applicant profile.
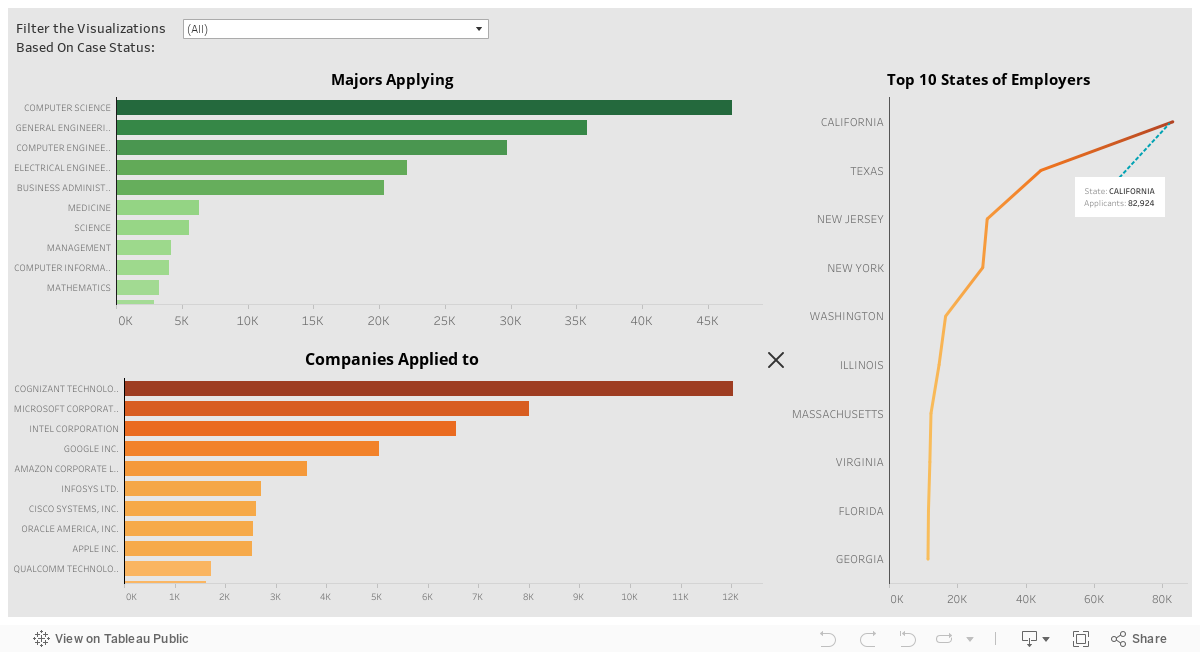
The first bar chart showcases the top majors applying for a US visa, with computer science on top, followed by general engineering and computer engineering. This suggests a notable trend in the major choices amond individuals applying for US visas. The dominance of computer science – related majors suggests a high demand for individuals with expertise in technology and programming. The data implies that individuals with computer science and engineering backgrounds may have advantageous prospects in securing employment opportunities in the US.
The second bar chart showcases the companies applied to, with Cognizant Technology being on top, followed by Microsoft, Google and Intel. This information provides insights into the preferred employers for US visa applicants. The prevalence of applications to those technology giants indicates a substantial internet or demand in the technology and IT sectors. The data suggests that individuals seeking US visas often target employment opportunities with these prominent companies, possibly due to their global reputation, job offerings, or industry influence. For applicants, this informs their choices and strategies when seeking employment opportunities in the US.
The line graph showcases the top 10 employer states, with California as the frontrunner with 33,903 applicants. Notably, California stands out as a technology hub, attracting the highest number of job seekers.
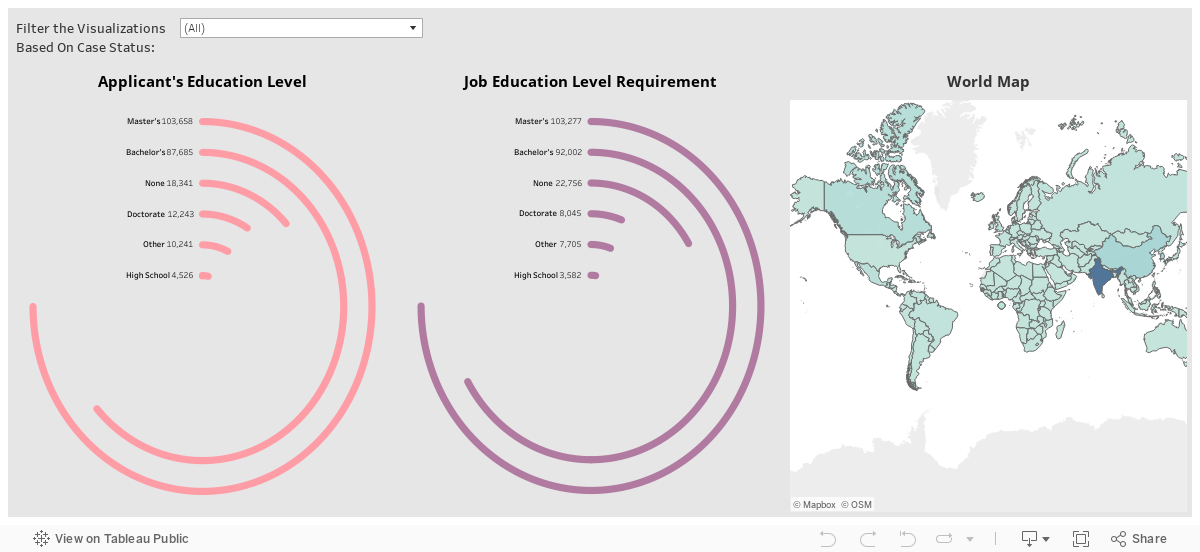
Based on the first radial bar chart, there is a visible pattern in the education level requirements for jobs. As indicated, a Master’s degree is the most commonly sought after qualification, followed by a Bachelor’s degree, and with “None” representing the third category. This information could have implications for individuals seeking employment visas: since the majority of job opportunities require a Master;s degree, prospective visa applicants can enhance their chances by acquiring this degree. Bachelor holders will also find opportunities, but with higher competition, while individuals without an educational background, or a doctorate, might have limited options.
This second radial bar chart showcases the applicant’s education level, with a masters degree coming on top, followed by a bachelor, and doctorate coming as third. This information suggests that both Master’s and Bachelor’s degrees are the most common educational levels among applicants. This finding signifies that US visa applicants hold a high level of education. The prominence of doctorate degrees, even if third in frequency, indicates a pool of highly qualified and specialized cadidated. Visa authorities and employers may take note of this educational distribution, potentially influencing the competitiveness of applicants based on their educational backgrounds.
The world map aims to visualize the distribution of the top countries where visa applications originate from, taking into account the birth country as well as the country of citizenship of applicants. When considering birth country, India comes on top, with 31,363 applicants originating from the country, followed by China, with 4,870 applicants, followed by Canada with 2,033 applicants. This data correlates with our research, where India comes on top when it comes to visa applications.
Proposed Solutions:
1- Optimize Online System: Applicants should advocate for embassy investment in optimizing the online system to enhance efficiency. Focus on user-friendly interfaces, mobile responsiveness, clear guidance, and targeted measures to address common issues leading to refiled applications.
2- Validate Information: Applicants are advised to thoroughly review and validate all entered data during the application process to ensure accuracy and completeness, reducing the risk of immediate denial due to inadvertent errors or misinformation.
3- Avoid Traditional Mail Submissions: Discourage the use of traditional mail submissions due to the higher risk of denials caused by potential discrepancies and errors in the manual processing involved.
4- Apply for Correct Visa Type: Ensure applying for the correct visa type, understanding distinctions between similar visas, and aligning qualifications with the intended job to prevent application denial.
5- Advocate for Industry Collaboration: Tech majors should actively advocate for closer collaboration between the immigration department and industry leaders to address specific challenges faced by IT professionals. Proactive research on tech job requirements is recommended.
6- Partnerships with Major Employers: Establish partnerships with major tech employers to streamline the visa application process, address challenges, and ensure a smoother experience for applicants targeting renowned organizations.
7- Seek Assistance from Parent Companies: When applying to a subsidiary, seek assistance from the parent company to enhance the chances of approval, as applications from well-known industry leaders are more likely to be approved.
8- Feedback Mechanism for Past Applicants: Establish a feedback mechanism to collect insights from past applicants, identify pain points, and implement changes for an improved overall application experience.
Conclusion: These proposed solutions collectively aim to address various aspects of the U.S. visa application process, from system optimization and data validation to industry collaboration and feedback mechanisms. Implementing these measures can contribute to a more efficient, accurate, and applicant-friendly visa application experience.
Share Your Experience!
Have you navigated the U.S. visa application process? We’d love to hear about your experiences, challenges, and successes. Share your insights in the comments below and let’s create a space for knowledge-sharing and support as we collectively navigate the path to a thriving career in the United States!