Lebanon’s service sector should be a national strength — tourism, education, banking, and professional services once made the country a regional hub. But when we look beyond assumptions and into the data, a very different story appears: for 21 straight years, Lebanon has been in the red, importing more services than it exports.
From telecoms and travel to banking and consulting, services play a key function in transforming a country’s economic strength. But for Lebanon, the story hidden in the data tells a completely different reality—one of a consistently growing services deficit over the last two decades.
Looking at 20 years of trade data, I examined how Lebanon’s services balance transformed across key economic periods. The story became immediately clear:
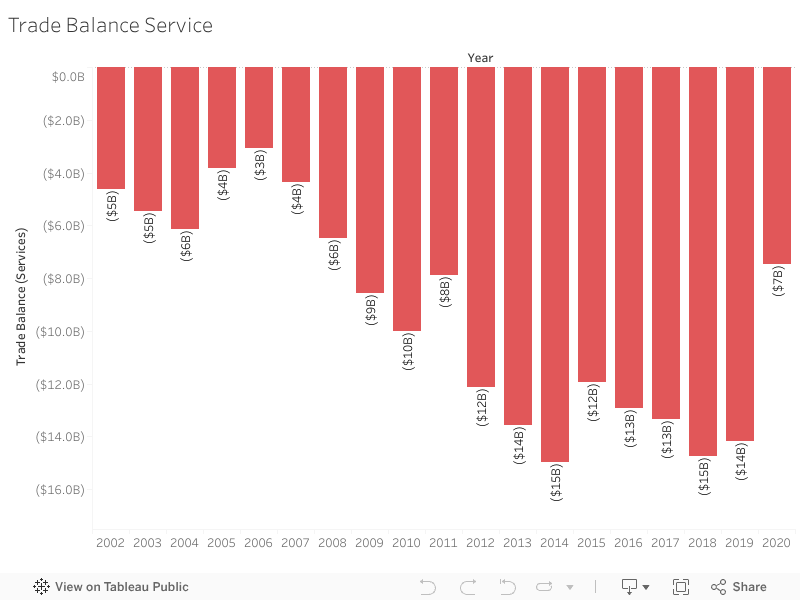
For 21 consecutive years, Lebanon has never escaped a services trade deficit, and the gap continues to deepen.
Why This Matters
For more than twenty years, Lebanon has faced a continuing services trade deficit. The country’s imports, including finance, logistics and professional consulting, have consistently exceeded its exports. The ongoing imbalance heightens economic vulnerability and increases Lebanon’s reliance on foreign service suppliers.
Between 2002 and 2022, the trade balance remained consistently negative. During its 2014-2018 peak, the trade balance deficit surpassed $14 billion, revealing how deeply rooted this issue has become.
The visualization below highlights how this deficit has evolved across key periods.
**Interactive Visualization:**
Hover over the bars to see exact values for each year.
**Full View:**
Complete visualization showing Trade Balance Services from 2002-2022.
During the pandemic in 2020, the deficit slightly decreased—mainly due to reduced travel and service utilization. Unfortunately, this improvement is temporary. In 2021 and 2022, the deficit rises again, continuing the very trend Lebanon has struggled with for years.
What This Means
A persistent services trade deficit highlights structural vulnerabilities. It reveals that Lebanon is consistently spending more on imported services than it generates from exports. With time, this imbalance becomes a financial burden that weakens financial stability and increases dependence on external inflows.
The Big Idea
Examining two decades of data highlights how Lebanon’s service trade deficit has continued to expand, revealing Lebanon’s economic vulnerability. The figures are striking on their own, but when presented as a story, the patterns become impossible to overlook.
What Can Lebanon Do?
Reducing the services deficit requires structural changes rather than short-term fixes. Strengthening digital services, tourism, and healthcare exports can create new revenue streams. Supporting export-oriented SMEs — especially those providing regional outsourcing services — can also help Lebanon compete more effectively.
Policy efforts should focus on promoting digital transformation, encouraging service-based startups, and building stronger regional trade partnerships. Over time, these measures can help diversify Lebanon’s export base, reduce dependency on imported services, and move the country toward a more sustainable trade position.
For example, Lebanon’s IT outsourcing sector—especially remote consulting and digital services—has grown naturally since 2020 and can become an export engine if supported through training and regional partnerships.
Charting Progress: Vietnam’s GDP, Trade, and Industrial Growth (2010-2022)
The years 2010 to 2022 have seen stability and expansion in Vietnam’s economy. The visual shows the economic dynamics of the nation over a ten-year period, highlighting the GDP growth rate annually, which highlights the country’s resilience in the face of regional and international difficulties. Additionally, it draws attention to the consistent contribution of trade to GDP, which reflects Vietnam’s growing influence on the international scene. The graph also shows the manufacturing and industrial sectors’ expanding and considerable influence on the economy, indicating a move toward modernization and industrialization. Vietnam’s strategic economic policies and strong reactivity to shifting economic conditions are demonstrated by this data narrative.
Established policies like the Doi Moi economic reform, which laid the foundation for Vietnam’s market-oriented strategy, supported the country’s economic resilience in the face of global problems in 2020. Furthermore, during a turbulent time, Vietnam’s commerce was supported by the government’s strategic application of free trade agreements, such as the EU-Vietnam Free commerce Agreement (EVFTA) and the Comprehensive and Progressive Agreement for Trans-Pacific Partnership (CPTPP). During the epidemic, this strategy and programs like the National Foreign Direct Investment Strategy for 2021–2030 supported growth and cushioned the economy. Following the COVID-19 epidemic, Vietnam’s National Assembly passed Resolution 43 in 2022, which was a comprehensive package meant to revive the country’s economy. To lessen the burden on businesses, specific measures included a 2% reduction in VAT and CIT deductions. A significant budget, almost US$15 billion, was set aside for modernization, infrastructure development, and healthcare advancements. In addition, the government offered favorable loans to support company recovery together with social security subsidies for job creation and training. These focused monetary and fiscal policies were essential in launching Vietnam’s economy’s post-pandemic recovery. The Vietnam Briefing addresses the effects and extent of these policies in detail.
Seizing the Momentum: Vietnam’s Path Forward
In times of global unpredictability, Vietnam’s resilience and economic expansion bear witness not just to its excellent policymaking but also to the unwavering dedication of its people and leadership. One issue still stands as we consider this dynamic economy’s amazing journey: how can the international community use Vietnam’s achievements as a model to strengthen its own economy? The search of creativity and teamwork together holds the key to the solution. Using Vietnam’s experience as a model, let’s consider how we may use these ideas to face our own issues with the same determination and bravery.
As MSBA students, we are used to working with data daily, we are accustomed to hearing about its importance and how it holds the answers to any question we might have. We didn’t really understand how powerful data was until we were asked a question we didn’t have the answer to, and with the use of data we were able to unearth the answers to our question.
It was Monday February 22, directly after our Data visualization class, we were walking from OSB to Zaituna Bay and we were discussing different potential ideas for our upcoming visualization course when suddenly we were stopped by a SkyNews reporter. He asked us if we were students and then proceeded with asking us the one question that captured our curiosity:
Luckily, they included MSBA’s one and only Rafic Srouji in the news report the next day. His answer was:
This whole interaction got us thinking and sparked our curiosity; we wanted to find out why is the cost of consumer goods drastically increasing and what can we do about it.
As residents of Lebanon, we experienced first-hand the dramatic rise of prices every time the Lira devalues with an average inflation rate of 132.98%, so we joined the monthly inflation rate data in Lebanon with the monthly Lira rate data from 2019 till 2022. After plotting the timeseries data, we found that when the lira rate increases the inflation rate increases substantially. With further research, we found that the price of consumer goods changes substantially with the fluctuation of the lira because most consumer goods are imported, thus being purchased with the USD.
In order to get more insights about the nature of the trade deficit (exports and imports), we analyzed the Lebanese exports and imports data. This enabled us to create charts that compare the import and export values in Lebanon, and to divide them by sector.
As we can see in the dashboard’s charts, Lebanon has a large trade deficit of $12.81 Billion with most consumer goods being imported, this definitely plays a huge role in the increase of prices. If Lebanon was more self-sufficient when it comes to consumer goods and other basic products, the price of said products could potentially decrease and would be less volatile to changes in the lira rate.
Lebanon imports 20% of its total imports from the Agriculture sector, as well as 20% from the Minerals sector, which both constitutes to its highest imports. Our focus as to evaluate whether this amount could be reduced.
A big discovery was found! Lebanon has opportunities all over its area, hidden in its chaos; the country has at least one available factory that can produce goods from any tradeable sector. Lebanon has more than enough factories to reach the dream of putting a dent in the trade deficit. The country has 1,616 factories in the food industry that can dramatically decrease the high prices of food and beverages, if properly exploited.
A comparison between Turkey and Lebanon was found to be a great validation to our proposed solution. Turkey’s Lira has lost more than 70% of its value since 2021, but it was found that the inflation rate didn’t follow as aggressively as that of Lebanon. The weaker correlation between the Turkish Lira rate and the Turkish inflation rate is a direct result of the strong local production in Turkey. Turkey has a negligible trade deficit of $29 million which is negligible in comparison to its population (85 million), in opposite to Lebanon who has a trade deficit of $12.82 billion with a population of 6.83 million.
Local production is a key player in decreasing Turkey’s yearly trade deficit. Improving local production is seen to be effective in decreasing the country’s trade deficit, and decreasing the prices of goods.
From here, our findings demonstrate that there is a crucial need for local production. To do so, the government must allocate resources towards these factories and exploit them, especially in times we need them the most. This would potentially increase tourism, increase local jobs, and decrease prices all together.
Does a Country’s Borrowing Policy Affect its Population’s Income level?
The Case of Lebanon
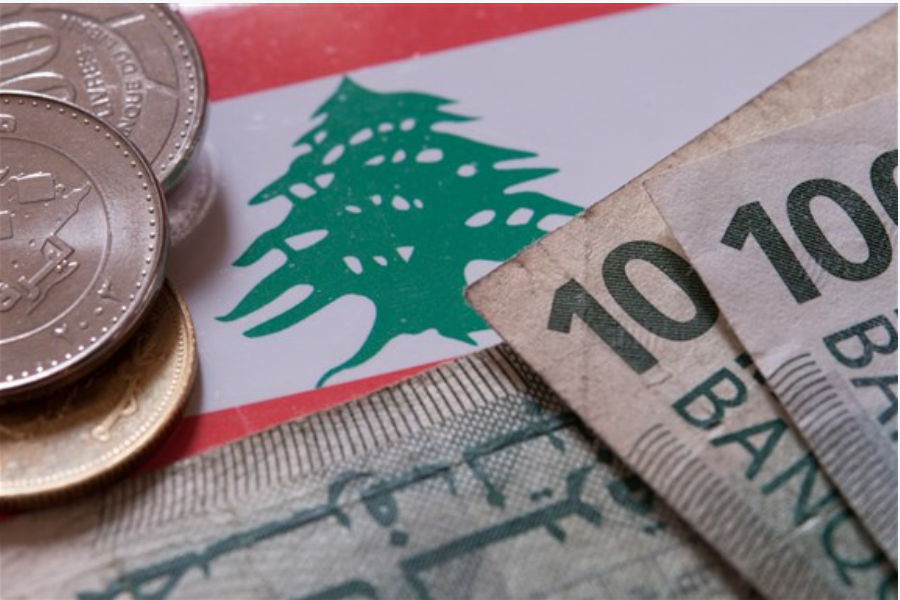
DOLLAR? LBP?
WHAT’S THE EXCHANGE RATE TODAY?
DISCOUNTING CHECKS? AT WHAT RATE?
WHAT???? 20%????
THIS MEANS I’M LOSING 80% OF MY MONEY!!!
I WAS DOING OK BUT NOW I CAN BARELY MAKE ENDS MEET…
This has unfortunately been the sad reality that
theLebanese people have been living for since
October of 2019.
WHY?
Because a Banking | Financial | Currency | Crisis
Made a Huge Bubble Burst!
BUT HOW DID WE GET HERE?
Lebanon has had a budget deficit for over 20 years and has been borrowing from external parties
for as long as we can remember.
So, as Lebanese citizens, we are born indebted.
A country’s national debt affects its population’s income level:
Growing debt has a direct effect on economic opportunities
If high levels of debt crowd out private investments, workers would have less to jobs do and therefore earn lower wages
Countries with LOWER DEBT exhibit HIGHER INCOME levels per capita.
SO HOW HAS LEBANON’S DEBT BEEN CHANGING OVER TIME?
WHAT CAN WE DO TO MAKE THINGS BETTER?
Potential Solutions include but are not limited to:
Supporting Production and Services Sectors leading to more Job Creation and eventually More Wages
Improving Trade Agreements leads to more exports which would Reduce Budget Deficits and make the country economically healthier
Attracting Foreign Direct Investmentsby providing a healthy capital market (ex: improving Reporting Practices) which leads to More Investments & More economic opportunities, More Jobs and eventually More wages
IS THERE PROOF?
Countries with Open Trade Policies seem to have higher income levels
Countries with Updated Reporting Practices also have higher income levels