by sjs32 | Nov 22, 2022 | Uncategorized
Wages and salaried workers is a crucial topic that has been discussed world wide and addressed in different ways. Several factors affect the total number of salaried workers in a country including the available job opportunities, the demand and supply enforced on labor force, and the type of field a worker is in. As such, this has created huge gaps and inequality in wages and salaried workers all over the world.
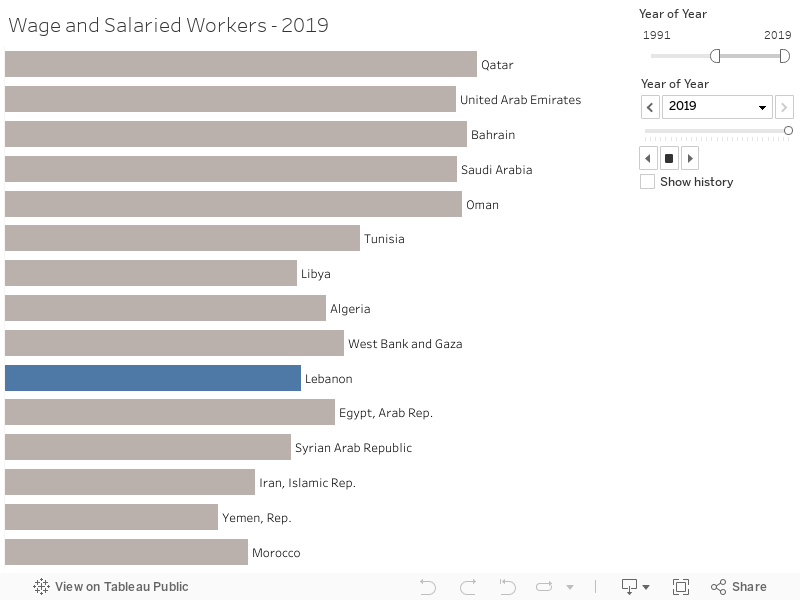
To better understand this feature, the below graph displays the changes of wage and salaried workers percentage over the years from 1991 to 2019 in the MENA region.
Looking at the graph, we can see that Qatar, Bahrain, UAE, Saudi Arabia, and Oman are countries that remained to be the top in terms of wage and salaried workers throughout the years as compared to other countries in the MENA region such as Lebanon, Syria, Yemen, and others. These top 5 countries all recorded over 95% of the workers are salaried and waged overr the years.
Moreover, looking more closely at other countries, we can see that countries such as Lebanon has a maximum of 65% of workers who are salaried workers and Libya with the lowest value among all countries.
This shows that among the countries in the MENA region there exists huge gaps and inequalities between workers in countries mainly due to scarce job opportunities in middle and low income countries such as Lebanon. This huge difference has caused a large number of fresh graduates in Lebanon to seek jobs outside of their country and mainly towards UAE and Saudi Arabia.
by ami31 | May 9, 2021 | Dashboard, Visualization
Childbirth is considered to be a landmark and joyous moment in any woman’s life. And although health experts say that no two childbirth experiences are the same, it is quite astounding that this can, in many cases, reach the extreme of death. According to statistics released by UNICEF, the World Health Organization (WHO), the United Nations Population Division, United Nations Population Fund (UNFPA) and the World Bank Group, around 2.8 million pregnant women and newborns die every year of preventable causes [1]. This turns childbirth into an event to be feared as it poses a significant threat to the lives of many women across the globe. According to the United Nations’ , quality education is defined as one the of the seventeen sustainable development goals (SDGs), so how can education help mitigate childbirth mortality?
“Pregnancy is not a disease. It should not lead to deaths. Every maternal death should be regarded as an abnormality.” – Vivianne Ihekweazu, Director of the Nigerian Health Watch [2]
How are Childbirth Deaths Related to Education?
The World Development Indicators data from the World Bank [3] allows us to look into the impact of education on childbirth by exploring the percentage of births that are handle by skilled health staff. In the figure below, we plot the average life expectancy at birth in years with respect to the average percentage of births attended by skilled staff for each country. There is a clear positive correlation between the two variables. We therefore conclude that children who are delivered by skilled health workers during labor are more likely to have a higher life expectancy.
However, the impact of having educated people overseeing child delivery does not stop here. Unfortunately, carrying out child delivery without proper understanding of the necessary health procedures has more alarming implications. In the dashboard below, we notice a sharp decrease in both maternal mortality (women dying during labor) and neonatal mortality (newborns dying at birth) in countries where more childbirths are handled by skilled health workers. This implies that many of the childbirth related deaths can be attributed to the lack of necessary health skills.
Where are these Childbirth Deaths Mostly Occurring?
Below we find the places that suffer the most from this by selecting the countries that have a below average percentage of births attended by skilled staff.
By looking at the geographical distribution of these countries we unsurprisingly find that the majority is located in Africa. Furthermore, we notice that the educational attainment in these countries is significantly lower than countries that have more professionally handled childbirths. This is an expected causality since to have more skilled people perform childbirth procedures we need more educated people.
So the Solution Is, Educate More People!
“The benefits of education permeate all walks of life right from the moment of birth.” – Irina Bokova, Director-General of UNESCO [4]
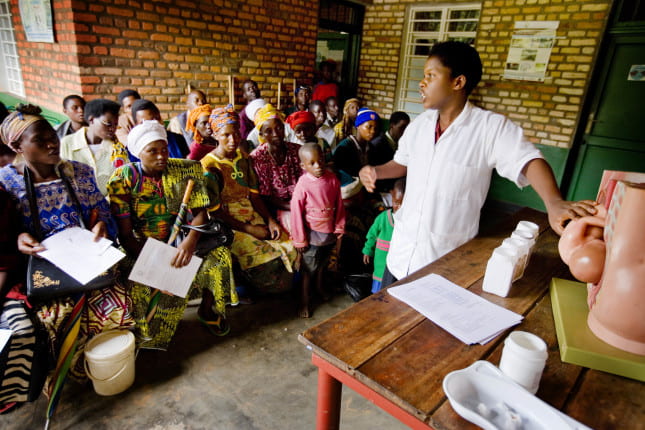
In light of the above, we clearly need to have more educated people that are able to professionally handle childbirth procedures. This is especially needed in developing countries where childbirth mortality is more pronounced. A key approach strategy here is to educate the local birth attendants and community midwives that are already active in these communities. These local and community health workers are already more connected to the women and families in their towns making their newly found skills more accessible and allowing them to spread health awareness to pregnant women in their communities [5]. Finally some communities in rural Africa are located in remote locations faraway from any medical supply and service centers. Therefore, setting up portable medical outposts near these towns would greatly enhance the quality of services provided by birth attendants.
References
[2] E. Onyeji, “Despite having highest maternal mortality in Africa, Nigeria’s situation still underreported – Report,”
Premium Times Nigeria, 03-Dec-2020. [Online]. Available:
https://www.premiumtimesng.com/news/headlines/429266-despite-having-highest-maternal-mortality-in-africa-nigerias-situation-still-underreported-report.html.
[3] https://datatopics.worldbank.org/world-development-indicators/
[4] “Education can save lives, help reach sustainable development goals – UN agency,”
UN News, 18-Sep-2014. [Online]. Available:
https://news.un.org/en/story/2014/09/477702-education-can-save-lives-help-reach-sustainable-development-goals-un-agency.
[5] D. Shikuku and C. Ameh, “Investing in midwifery training and education for improved maternal and newborn outcomes,”
On Medicine, 19-Mar-2021. [Online]. Available:
https://blogs.biomedcentral.com/on-medicine/2021/03/19/midwifery-training-education-maternal-newborn-outcomes-isrctn/.

by Celine Abdallah | May 5, 2020 | Uncategorized
“Transformation is often more about unlearning than learning”. – Rohr R.
As communities still follow their traditions and norms instead of educating themselves about the harms of child marriage, it continues to pose a threat to future generations to this day. Several factors shown in the dashboard can act as indicators for us to know in which countries this issue still persists. We used tableau to analyze these indicators by country and were surprised with the extent to which this issue is still present to this day and the lack of awareness about it. From our data, we categorized the indicators that are prevalent in our Country and discussed them with Lebanese activists (Mr Joe Maalouf, journalist – Ms. Hayat Mirshad, Head of communication and campaigning at RDFL). We were then able to come up with a clear picture of how the child marriage situation is in Lebanon; and accordingly, came up with solutions to reduce it.
In order to ultimately end child marriage, awareness should be raised to change cultural beliefs and norms.
It is time to put an end to child marriage!

by Jad Rizk | May 5, 2020 | Dashboard, Visualization
The below storyboard highlights and examines a correlation between the GDP per capita and population age distribution. The visualization shows a comparison between regions and across time. This correlation makes us think more about future problems like pensions, economic growth, child labor, retirement age, and possible social problems. It is worth examining further if there is causality. Are economic changes coming based on age distribution?
The dashboard is interactive. Please feel free to filter, highlight, and discover the data in more depth. The fullscreen setting will allow for a better viewing experience.