As our planet grapples with the consequences of climate change, this blog post delves into the complex relationship between human activities and our environment. Specifically, we’ll explore the dynamics of carbon dioxide (CO2) emissions, shedding light on the countries responsible for the highest emissions and examining their consequences on both land and water ecosystems.
The Global Landscape: Top 5 CO2 Emitters
When fossil fuels such as coal, oil, and natural gas are burned for energy, they release large quantities of CO2 into the atmosphere. The excessive release of CO2 and other greenhouse gases enhances the heat-trapping effect, causing a gradual warming of the planet known as global warming. This warming, in turn, leads to a wide array of climate change impacts, including disruptions to ecosystems.
Our journey begins with a visual exploration of the top five countries contributing significantly to global CO2 emissions. China, the United States, India, Russia and Japan respectively account for the highest amounts of CO2 emissions.
The bar graph on the right displays the total amount of CO2 emissions released by those five countries in 2020, along with their percentage contribution to greenhouse gas emissions. Clearly, CO2 emissions constitute a significant share of overall greenhouse gas outputs, with notable contributions observed particularly in China and Japan.
Subsequently, the line graph traces the trajectory of CO2 emissions in those five countries, where the data reveals a significant upward trend in CO2 emissions in China. Meanwhile, the remaining countries exhibit a relatively consistent pattern in the evolution of their CO2 emissions.
Power Generation: Coal vs. Renewables
The two line graphs contrast the production of electricity from coal sources against the consumption of renewable energy. While electricity production from coal sources is following a constant trend, the nations are not doing much when it comes to renewable energy, where India is the country that uses the most renewable energy.
The Toll on Wildlife: Threatened Species
The first bar graph examines the status of threatened mammal and fish species in the top five CO2-emitting countries in 2018. The second bar graph unveils a different narrative; the bottom five countries contribute less to global emissions. While this correlation warrants further exploration, it prompts us to consider whether lower emissions may indeed be associated with a lower number of threatened species.
In response, the following recommendations are proposed to guide collaborative efforts towards a sustainable and resilient future:
Global Collaboration: Nations, particularly the top emitters, must commit to CO2 emissions reduction and participate in international initiatives to address climate change.
Renewable Energy Acceleration: All countries, especially those heavily reliant on coal, should prioritize and accelerate efforts to increase the share of renewable energy in their energy portfolios. Investment in research, development, and implementation of sustainable energy technologies is paramount.
Conservation Initiatives: Nations with high emissions must implement robust conservation programs to mitigate the impacts on threatened species. Conversely, lower emitters should continue efforts to maintain a positive outlook for their wildlife.
Aforestation and Reforestation: Invest in afforestation (planting trees in areas that were not forested) and reforestation (replanting trees in deforested areas) projects to absorb CO2 from the atmosphere.
Carbon Capture and Storage (CCS): Develop and implement technologies that capture and store CO2 emissions from industrial processes and power plants, preventing them from entering the atmosphere.
Public Awareness and Education: Increase public awareness about the impact of individual and collective behaviors on CO2 emissions. Education campaigns can encourage more sustainable choices in daily life.
By combining these recommendations and tailoring them to specific regional contexts,the governments, industries, and individuals can contribute to a significant reduction in CO2 emissions, fostering a more sustainable and resilient planet.
Water is a basic human need; without it, survival is not possible.
Every day, 2.1 billion people wake up with no access to clean water. In other words, millions of families around the world do not drink, cook, or shower with clean water.
Each year, 3.4 million people die from unsafe and contaminated water sources, especially in the Sub Saharan African region with the highest mortality rate average of 101 persons per 100,000 in Chad, followed by an average of 87 in Somalia.
Access to basic drinking water, safely managed drinking water, and basic handwashing facilities
On average today, only 65% of the African population have access to basic drinking water, 31% use safe managed drinking water services, and only 26% have basic handwashing facilities including soap and water.
Despite global Sustainable Development Goals and commitments made in 2015 to ensure availability and sustainable management of water and sanitation for all, a progress was only witnessed in a few African nations over the past three to five years, according to the UN’s first-ever assessment of water security in Africa. Results show Egypt as one of the top five most water-secure countries in Africa, while Ethiopia, Somalia, Niger, and Chad appear to be the least water-secure countries in Africa.
It is also noticeable that the rural population is the one water deprived the most: only 39% of the sub-Saharan population has access to basic drinking water, in comparison to 80% from the urban population.
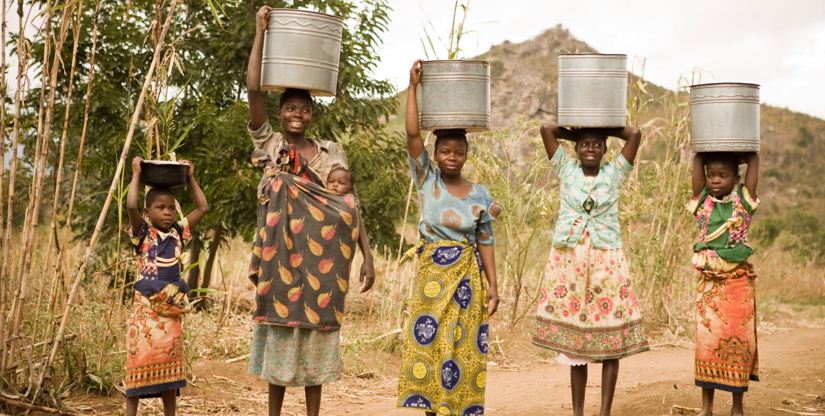
Effects on Women & Children
More than 70% of women in Africa are employed in agriculture including water collection. That means that instead of attending school, raising a family, or simply having a decent job, African women are obliged to spend from 3 to 6 hours walking to arrive to the closest source and collect water for their household. Women who are subjected to collecting water are more likely to:
Drop out of school
Suffer from infections and diseases
Die from contaminated water
Be sexually abused and much more.
Women are not the only ones who suffer, nearly 6,000 children die of water related diseases each day. This is why, it is time to end the water crisis.
A call for help
How can we make safe water available for all? This can be done by installing sustainable water points in the most impoverished areas of the world. Our focus should be first on rural villages in Africa, where the walk to collecting clean water is on average 3.7 miles.
Previous drilling solutions have proven beneficial to the needed regions: over 9 million people have now access to clean water, and a good example is a rural primary school in southern Kenya. This school used to spend its entire government budget purchasing water for students and teachers. This budget was intended to cover teacher salaries and purchase required books and supplies, but water was determined to be a much greater need. After drilling water wells and obtaining clean water onsite, the school witnessed a knowledgeable 30% increase in attendance, and budgets were re-allocated for teachers salaries and books. This plan is a proven solution that helps increase education opportunities for girls and women, improve health and sanitation, and have more opportunities for development. Therefore, we urge you to donate now on https://wholives.org/donate/ allowing WHOlives organization to install new water points each month. You can change lives!
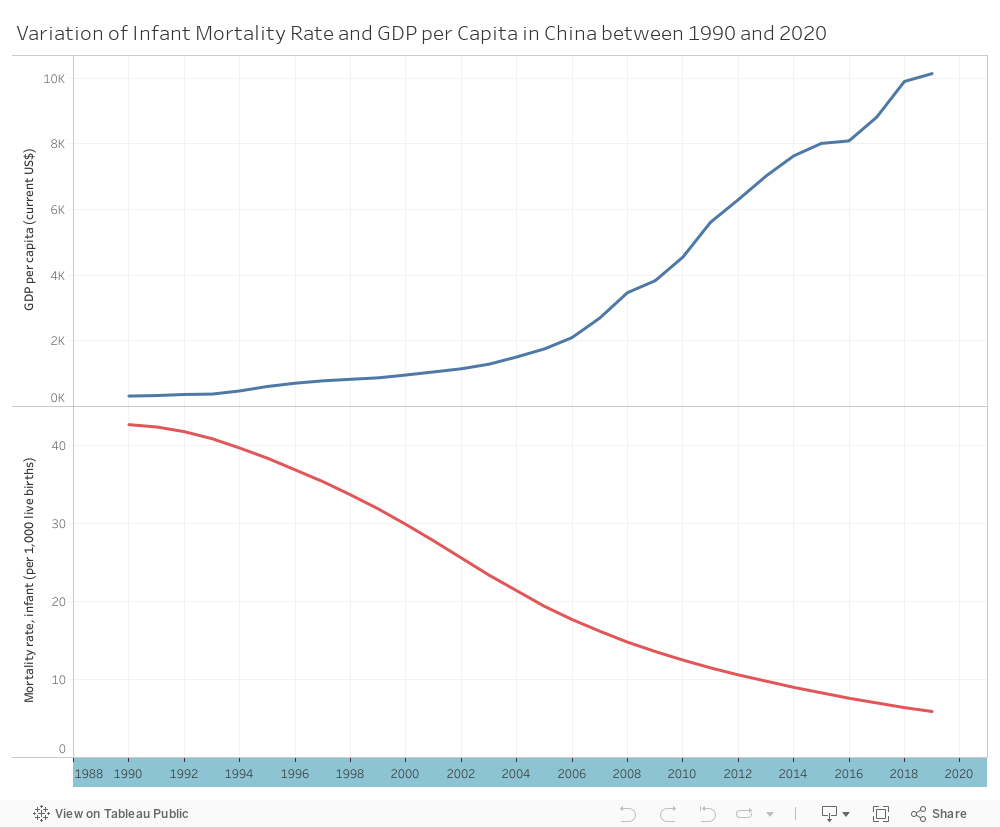
At the dawn of the 1990s, the People’s Republic of China was a typical developing nation. The majority of its population lived in poverty mainly in rural areas. The country’s GDP per capita was $318 which was almost equal to that of the African nation of Mali ($317) and much less than the GDP per capita of the South American nation of Guyana ($533.5). However, the most challenging problem that the Asian dragon faced was the high infant mortality rate of 42.7 deaths per 1000 births which was considered high according to UN standards (12 deaths/1000 births). Since then, the government implemented ambitious and bold economic reforms and opened gradually its economy to the rest of the world. The country witnessed an influx of foreign investment that resulted in the increase of the nation’s GDP per capita from $318 in 1990 to $10,144 in 2019! Beijing took advantage of its miraculous economic growth by incrementing investment in its health system. It focused on health financing, human resource development and health information systems and promoted the equalization of health services including maternal and child health services. As a result, the infant mortality rate in China decreased from 42.7 deaths/1000 births in 1990 to 5.9 deaths/1000 births in 2019. In other words, China triumphed in decreasing its infant mortality rate by 86% in almost 20 years, an achievement that even the most developed nations of the world did not accomplish. China is the example of a nation that has benefited from its economic development to decrease infant mortality rate. In this way, it achieved target 3.2 of the Sustainable Development Goals set by the United Nations for countries to reach by 2030 -the ending of preventable deaths of newborns to less than 12; and most importantly achieved the health and welfare of its population.
References:
Guo Y, Yin H. Reducing child mortality in China: successes and challenges. Lancet. 2016;387(10015):205-207. doi:10.1016/S0140-6736(15)00555-3
Department of Economics and Social Affairs, United Nations: Sustainable Development Goals, Goal 3: https://sdgs.un.org/goals/goal3