We’ll explore how Lebanon’s unemployment rates compare with other Arab nations and discuss innovative strategies to address this challenge. Our focus is on understanding the current situation and proposing effective solutions for economic growth and stability.
The Problem of High Unemployment in Lebanon
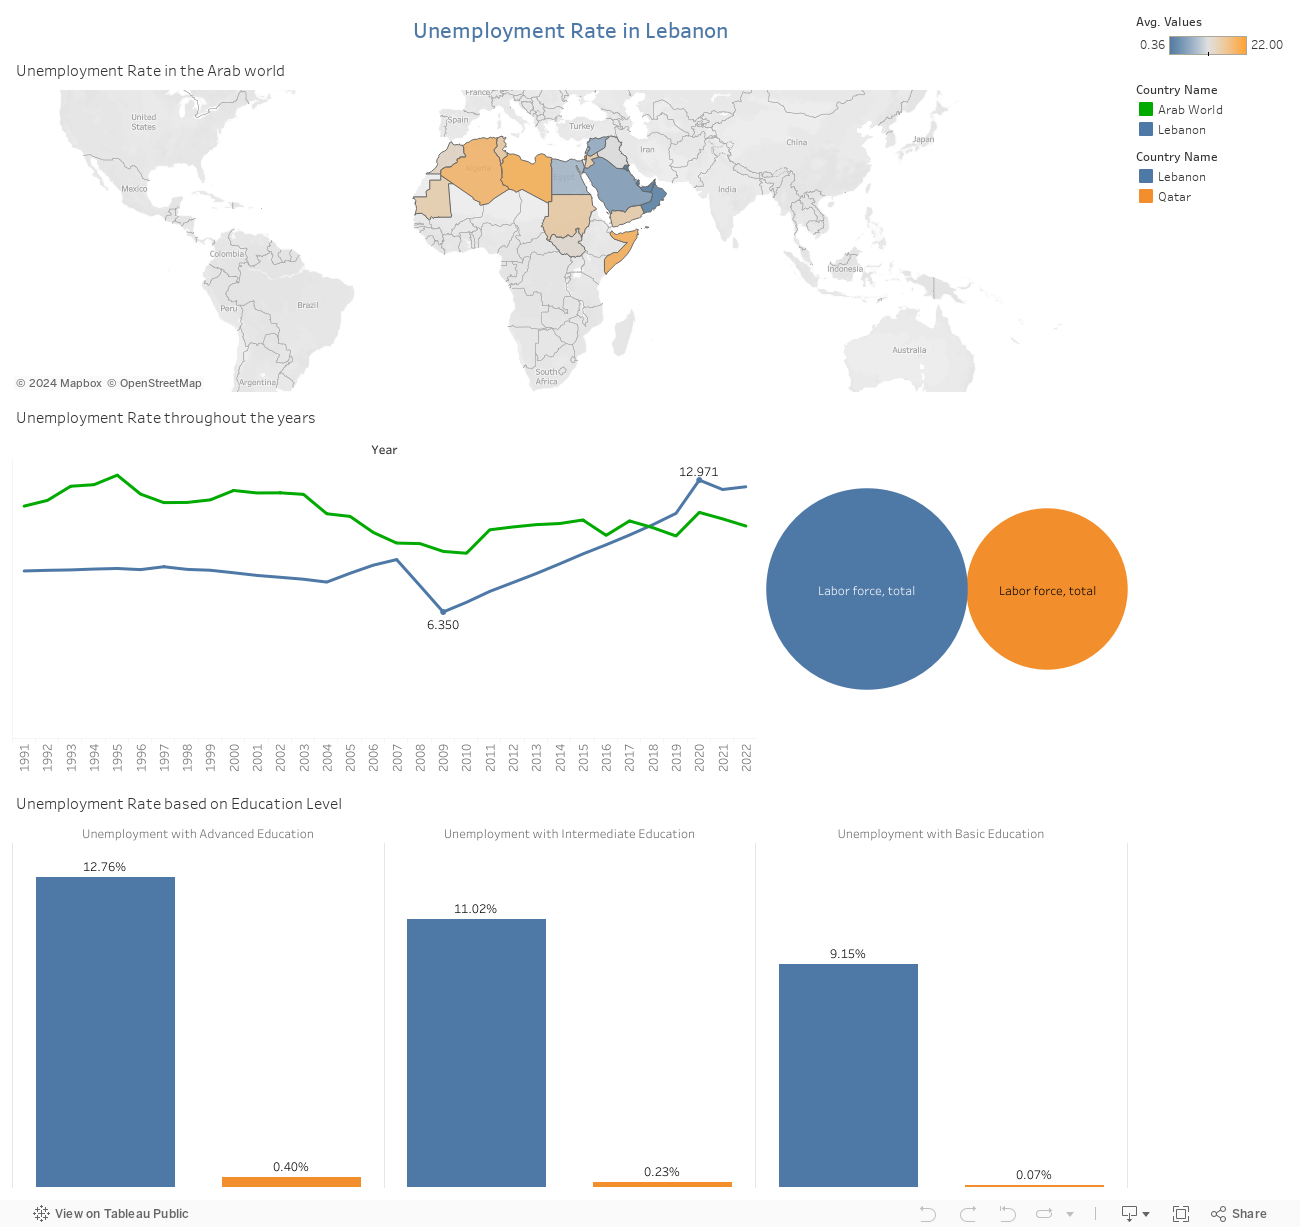
Lebanon’s Struggle: A markedly high unemployment rate compared to the wider Arab world.
Comparative Statistics: Lebanon’s unemployment rate stands at 12.76% among those with advanced education, a stark contrast to Qatar’s 0.4%.
Regional Perspective: Lebanon’s total unemployment rate of 8.6% amidst the Arab nations.
Proposed Solution: Adapting to Industry Evolution through Training and Partnerships
Skill Enhancement: Continuously update training programs to stay in sync with evolving industry demands.
Certification and Recognition: Offer certification or accreditation for completed training programs.
Access to Opportunities: Provide resources for job seekers to access these training opportunities.
Collaboration with Industry: Establish partnerships with businesses to create internship and apprenticeship programs.
Detailed Solution Strategy: Comprehensive Approaches to Address Unemployment
Tailored Education: Implement education and training programs specifically designed to meet industry demands.
Entrepreneurship and SME Support: Foster entrepreneurship and aid in small business development.
Collaborative Efforts: Strengthen ties between educational institutions, government entities, and the private sector.
Investment in Growth Industries: Focus on industries with high potential for job creation and economic impact.
Solution Validation:
Benchmarking Success: Drawing insights from successful interventions in regions with similar challenges.
Pilot Programs and Case Studies: Initiating tests to evaluate the effectiveness of these strategies.
Conclusions and Recommendations:
Multifaceted Approach: A combination of targeted education and training, entrepreneurial support, and strategic industry investments is recommended for Lebanon.
Aiming for Economic Growth: This strategy aims to utilize Lebanon’s larger labor force effectively to bridge the unemployment gap and foster economic growth.
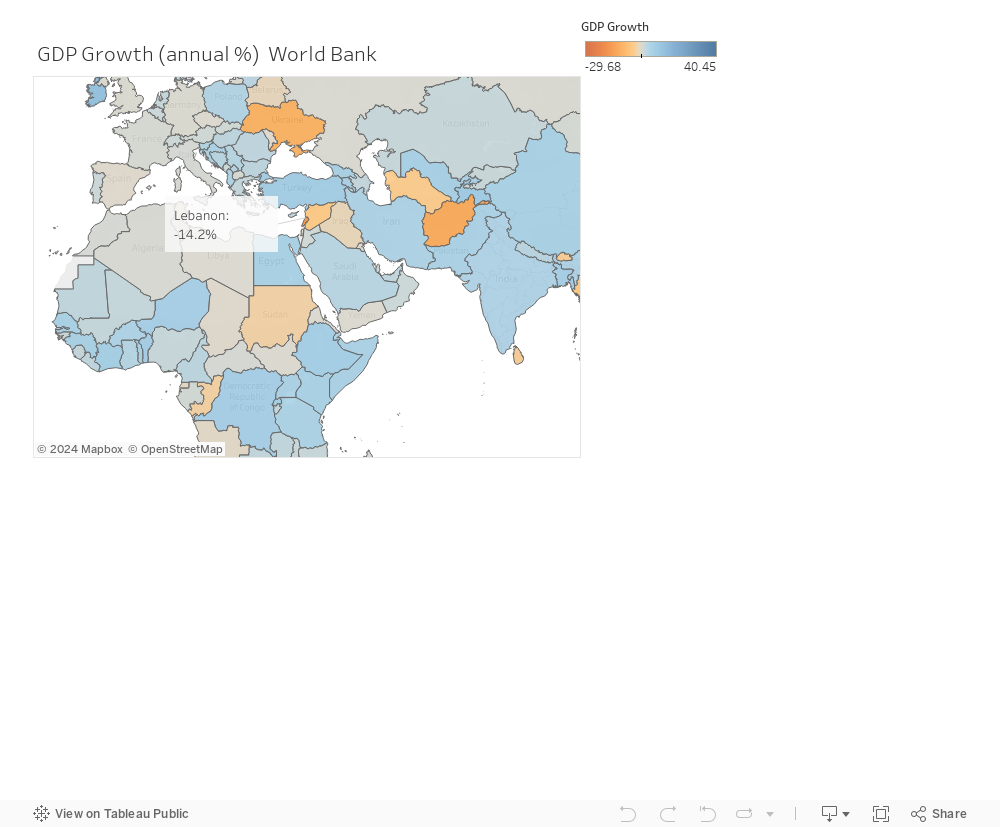
Lebanon has been ranked as one of the top countries with severe negative GDP growth. As shown in the below graph, Lebanon’s GDP growth is also lower than that of its neighboring countries, including Syria which has been facing a war since 2011.
In order to check for potential causes of this severe negative GDP growth, Lebanon was compared with other countries on the level of economic indicators. What is found interesting is that Lebanon has the highest external debt (expressed as % of GNI) compared to other countries, as the below figure shows.
Let’s dig deeper into the relationship between external debt and GDP growth in Lebanon. As the below figure shows, when Lebanon’s external debt made a big jump and increased by 130% (from 147% to 277.9%), GDP growth had a severe decline of 15.5% (from -4.2% to 19.7%).
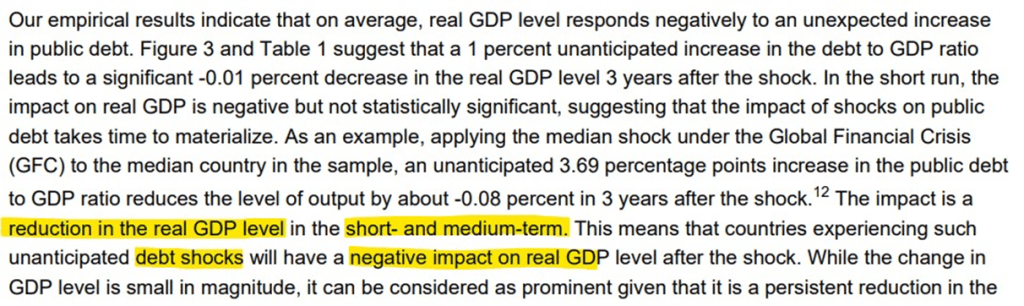
This relation is validated by a study performed by The Monetary Fund that states that external debt shocks have a negative impact on GDP in both, the short- and medium-terms. This is further shown in bellow screenshot taken from the study (The Monetary Fund,2022).
For this reason, The Monetary Fund, in collaboration with the World Bank, has developed The Heavily Indebted Poor Countries (HIPC) Initiative that provides debt relief for qualifying countries if these countries develop a Poverty Reduction Strategy Paper (PRSP) to show how this relief would help them re-increase there GDP.
In the period from 2019 to 2022, Lebanon faced an unprecedented confluence of crises that tested the resilience of its people and the stability of its economy. This tumultuous period unfolded against the backdrop of the global pandemic, the devastating explosion at the Beirut port, and an already fragile political and economic landscape.
In 2019, Lebanon was already grappling with economic challenges, a weakening currency, and public discontent. Little did the nation know that a series of events would unfold, further exacerbating its struggles.
The Economic Downturn:The year 2019 witnessed a decline in Lebanon’s GDP growth, driven by a combination of economic mismanagement, political instability, and a growing public debt. The situation worsened in 2020 as the global COVID-19 pandemic took hold. The pandemic not only strained healthcare systems but also disrupted global supply chains, affecting trade and exacerbating Lebanon’s economic woes.
The Impact of COVID-19:As COVID-19 spread globally, Lebanon, like many nations, implemented strict lockdowns to curb the virus’s spread. However, these measures had a significant economic toll, particularly on sectors such as tourism, hospitality, and services. Unemployment rates surged as businesses struggled to stay afloat in the face of lockdowns and reduced consumer spending.
The Beirut Port Explosion:August 4, 2020, marked a tragic turning point for Lebanon. The explosion at the Beirut port sent shockwaves through the country, causing widespread devastation and loss of life. Beyond the immediate human toll, the explosion dealt a severe blow to the economy. The port, a vital economic hub, was decimated, disrupting trade and further straining an already fragile economy.
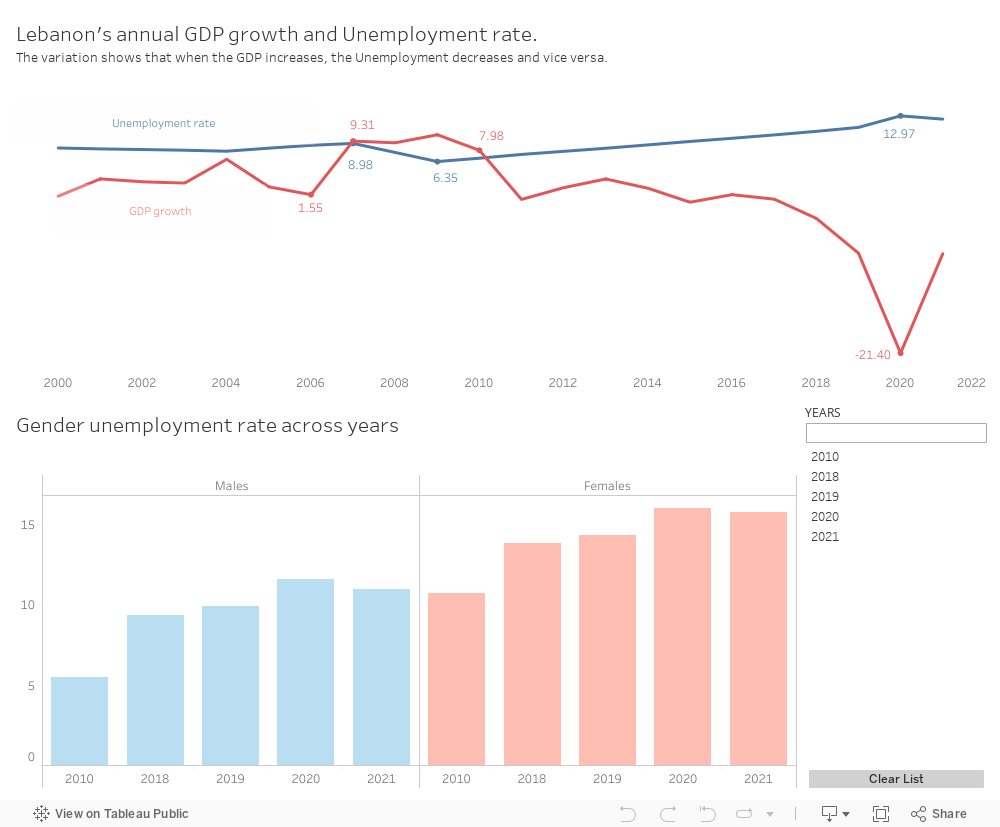
The Unemployment Crisis:As the GDP contracted, the unemployment rates, meticulously depicted in our Tableau visualizations, soared. The economic downturn, compounded by the pandemic and the port explosion, left countless Lebanese citizens without jobs. The barchart vividly illustrates the gender-specific impact, showcasing the challenges faced by both males and females in this turbulent period.
Solutions
Yet, in adversity lies the opportunity for resilience and recovery. As we examine the line chart depicting GDP growth, a glimmer of hope emerges. The chart illustrates a gradual increase in GDP in 2021, signaling a potential comeback.
To foster this recovery and bolster Lebanon’s economy, a multi-faceted approach is essential. Some potential solutions include:
Economic Reforms: Implement comprehensive economic reforms to address fiscal challenges, improve governance, and attract foreign investment.
Infrastructure Investment: Focus on rebuilding and modernizing infrastructure, including the reconstruction of the Beirut port, to stimulate economic activity and enhance trade capabilities.
Support for Small Businesses: Provide targeted support for small and medium-sized enterprises (SMEs) to encourage entrepreneurship, create jobs, and revitalize local economies.
International Aid and Collaboration: Seek international aid and collaborate with the global community to access financial assistance, technical expertise, and humanitarian support.
Healthcare Investment: Invest in the healthcare sector to strengthen the country’s resilience to health crises, fostering a healthier workforce and more robust economic conditions.
As Lebanon charts its course towards recovery, these solutions offer a roadmap for rebuilding and fostering sustainable development. The line chart becomes a symbol of resilience, capturing not only the challenges faced but also the potential for renewal and progress.
Resilience and Hope:Despite these challenges, the people of Lebanon exhibited remarkable resilience. Communities came together to support one another, and NGOs and international aid played a crucial role in providing relief. The visual representation of GDP decline and rising unemployment underscores the urgency of addressing the socioeconomic impacts of crises.
Lebanon’s journey through these challenging years serves as a testament to the strength of its people. While the road to recovery is long and arduous, the collective spirit and determination of the Lebanese offer a glimmer of hope for a brighter future.
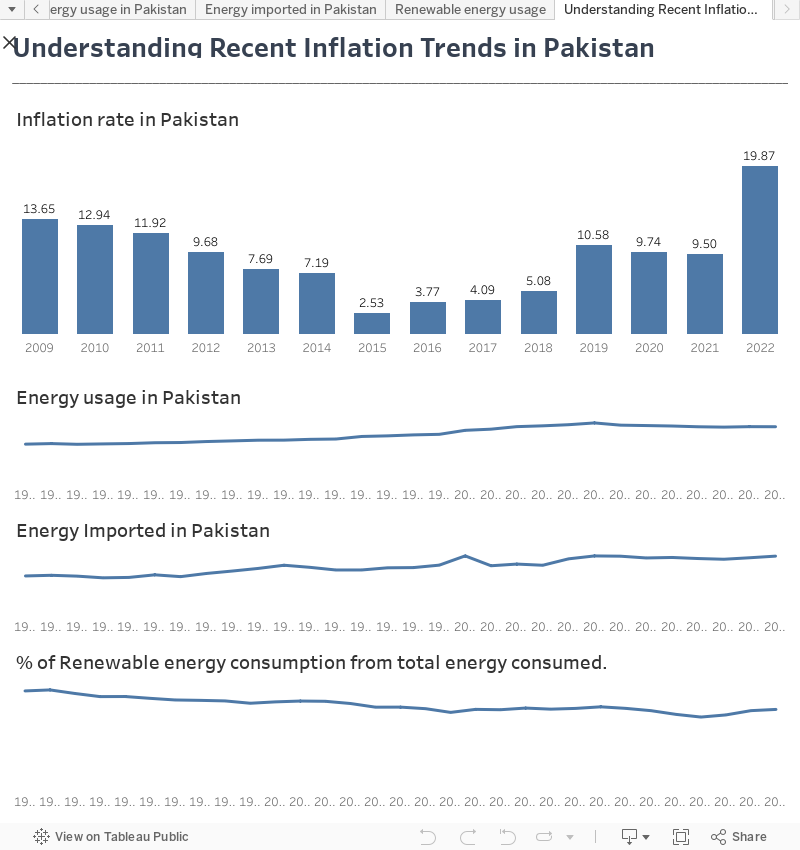
Pakistan finds itself among the growing list of nations grappling with an alarming surge in inflation rates, and this phenomenon is a complex interplay of multiple factors. The bar chart compellingly illustrates this rising trend. It underscores a disconcerting truth: from the year 2021 to 2022, Pakistan witnessed a staggering 10% increase in its annual inflation rate. This alarming leap in inflationary pressures carries profound implications for the country’s economic stability and the daily lives of its citizens, necessitating a thorough examination of the root causes.
First, by looking at the first line chart, we can see that Pakistan’s energy usage is annually increasing. The country uses this energy for power generation, industrial processes, transportation, and residential purposes. However, the core issue is that Pakistan heavily relies on imported energy resources, particularly oil and gas, to meet its energy needs which can be proved by the line chart showing the increasing percentage of energy imported from total energy consumed. This dependence has persisted for many years and is expected to continue for the next 10-15 years. This means that Pakistan needs to purchase a significant portion of its energy from the global market, which makes it susceptible to fluctuations in international energy prices. These price fluctuations have been on the rise in recent years, and they can have a direct impact on Pakistan’s overall inflation rate. As energy prices go up, so does the cost of living for the people in Pakistan, leading to an increase in inflation.
The last line chart is extremely important because it serves as an evidence to the fact that Pakistan’s reliance on renewable energy is decreasing over the years. The percentage of renewable energy used is less than 50% of the total energy consumption in Pakistan which means that they rely more on non-renewable energy. This can expose the nation to global energy price fluctuations and be a huge contributor to the increasing inflation rate in Pakistan.
To stabilize the economy and mitigate the impact of volatile global energy markets, the government should focus on two key strategies. First, Pakistan needs to expand its domestic energy production and reserves. Second, it should invest in renewable energy sources. By doing so, Pakistan can reduce its dependence on energy imports and diversify its energy supply. This approach will help the country move away from costly imported energy resources and transition towards more sustainable and cost-efficient energy solutions.
The is most closely related to Sustainable Development Goal (SDG) 7: Affordable and Clean Energy. This SDG aims to ensure access to affordable, reliable, sustainable, and modern energy for all while promoting energy efficiency and sustainability. The issues of energy dependence and rising global energy prices impact not only economic well-being but also environmental sustainability, aligning with the goals of SDG 7.
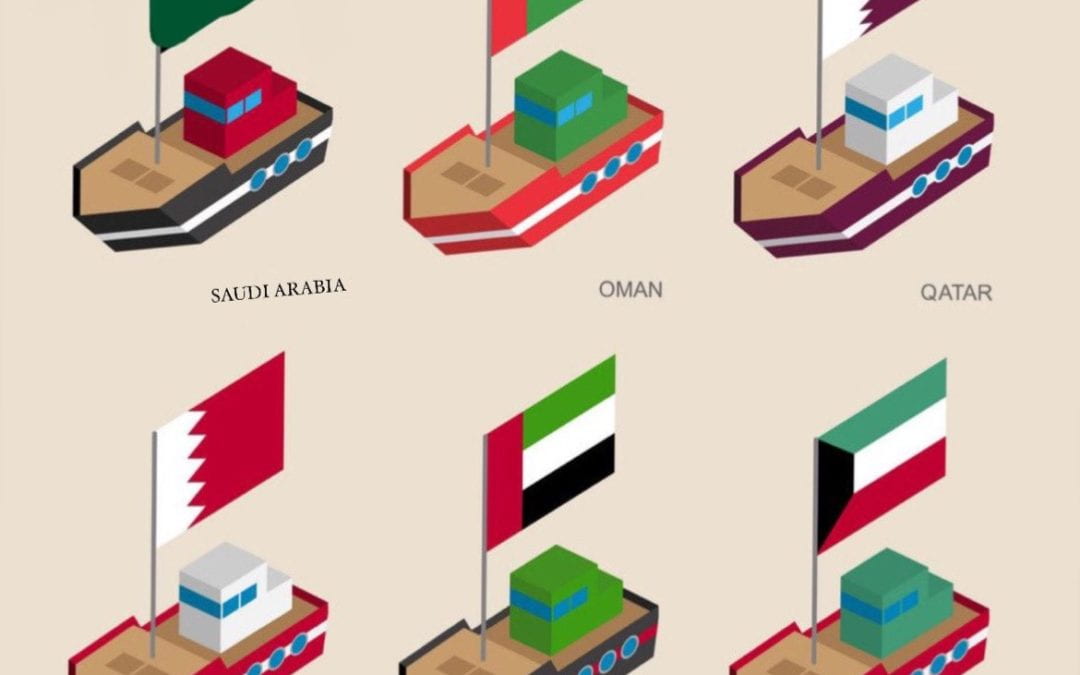
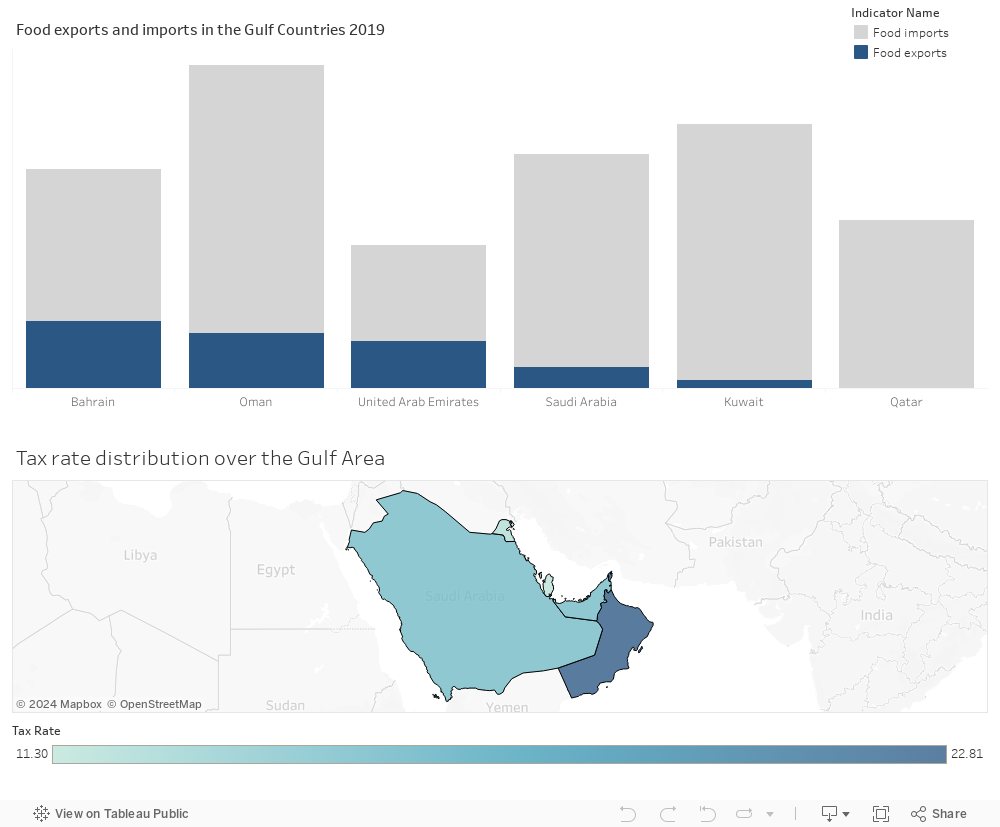
The percentage of Food export in Gulf Countries in 2019 is extremely low and the imports is relatively high comparing to exports. Gulf countries exhibited a notable disparity between food exports and imports, with food exports being exceedingly low and food imports substantially higher. Qatar, Kuwait, and Saudi Arabia, in particular, heavily relied on food imports to meet their consumption needs. This underscores a regional dependence on international food sources and highlights the importance of addressing food security to ensure stable access to essential resources in the Gulf.
Impact of Tax rate on Import and Export
The tax rates in Gulf countries as seen in the map can linked to the imports and exports, reveal an interesting correlation. Lower tax rates, such as those in Qatar and Kuwait, can encourage trade and potentially offset their low food exports and high food imports. Conversely, higher tax rates, as seen in Oman, might contribute to higher food import figures. The relatively lower tax rate in the UAE supports its role as a regional trade hub, which is reflected in its balanced import and export figures. The interplay between tax rates and trade statistics underscores the significance of fiscal policies in shaping the trade landscape of these Gulf nation
Agriculture & Industry
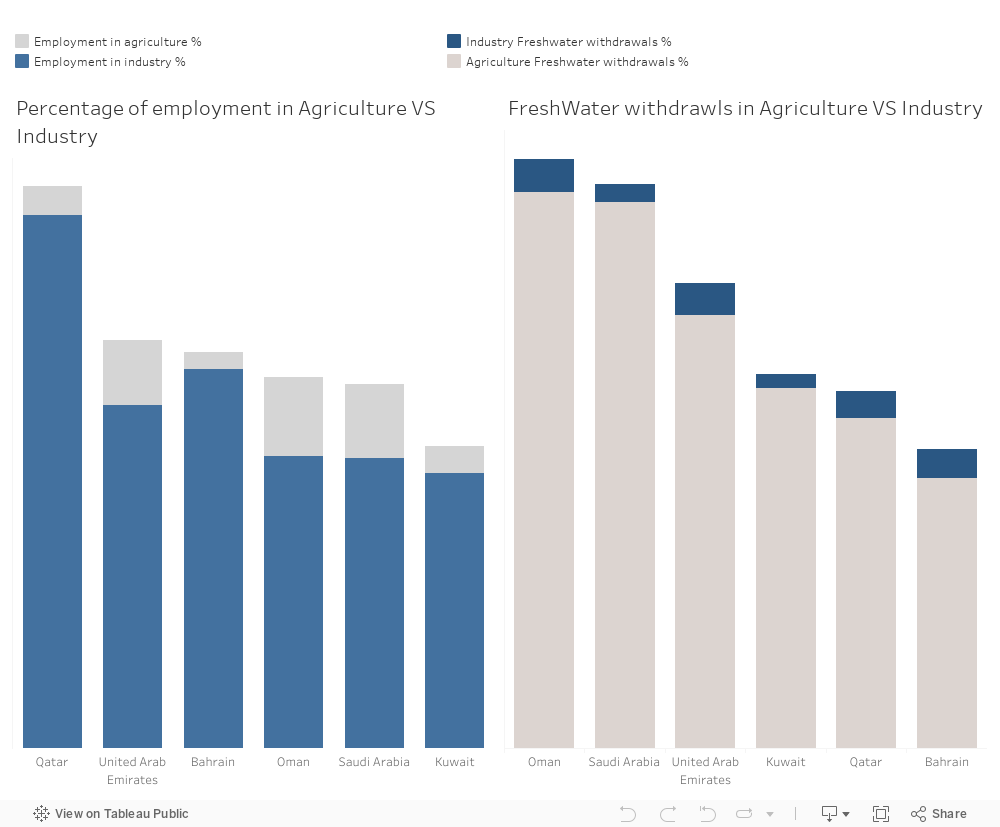
Influence of Water Withdrawals in Agriculture and Industry on food imports and exports
The water withdrawals data indicate the extent of agriculture and industrial activity in Gulf countries. Higher agricultural water withdrawals, as seen in Saudi Arabia and Oman, suggest self-sufficiency in food production. Meanwhile, countries with lower agriculture withdrawals, like Kuwait, may rely more on food imports. These water withdrawals can be linked to food import and export dynamics, influencing food security and trade strategies in the region.
Influence of Employment in Agriculture and Industry on food imports and exports
Higher Agricultural Employment & Food Trade:
Oman and Saudi Arabia, with higher agricultural employment, might have a more significant capacity for domestic food production. This could relate to their lower food imports and potential for food exports despite modest industrial growth.
Lower agricultural employment in Bahrain, Kuwait, Qatar, and the UAE could imply a heavier reliance on food imports due to limited domestic agricultural output, aligning with their higher food import figures.
Industrial Employment & Food Trade:
Qatar’s high industrial employment might suggest a lesser emphasis on agriculture, potentially leading to higher food imports despite economic diversification.
Other countries, with varying industrial employment rates, might showcase different levels of agricultural emphasis, influencing their food import-export dynamics.
Solutions
Investment in Agricultural Innovation: Encourage technological advancements and innovation in agriculture to boost productivity, creating more jobs and improving food self-sufficiency..
Tax Reform: Implement tax policies that incentivize investment in both agricultural and industrial sectors, promoting growth and job creation in these areas.
Education and Skills Development: Invest in education and training programs to equip the workforce with the necessary skills for employment in agriculture, industry, and other emerging sectors.
Sustainable Resource Management: Implement sustainable water and land management practices to support agricultural growth without compromising environmental resources, thereby ensuring long-term economic stability.
UN Goals
Goal 8: Decent Work and Economic Growth:
Employment in Agriculture and Industry: The distribution of employment in agriculture and industry reflects the economic structure of countries. Goal 8 emphasizes the importance of decent work and employment opportunities for sustained economic growth.
Food Import-Export Dynamics: Countries with higher agricultural employment might have stronger domestic agricultural sectors, impacting their trade balance in food. Conversely, higher industrial employment might affect the reliance on food imports due to potentially reduced emphasis on agriculture.
Tax Policies: Tax structures impact economic activities and employment opportunities. Favorable tax policies can stimulate growth in both agricultural and industrial sectors, contributing to Goal 8’s aim of fostering economic growth and decent work.
By focusing on inclusive economic growth, job creation, and enhancing productivity in both agriculture and industry, countries can contribute significantly to achieving Goal 8, ensuring sustainable and equitable economic development.
UN Goal Link – Goal 2: Zero Hunger:
Food Import-Export Dynamics: Countries with high food imports or low food exports often face challenges in achieving food security. Goal 2 aims to end hunger, achieve food security, improve nutrition, and promote sustainable agriculture.
Agricultural Practices: Stronger agricultural sectors (linked to lower food imports or higher exports) directly contribute to achieving Goal 2. Sustainable agriculture practices, as encouraged by the goal, can enhance food production and reduce dependency on imports.