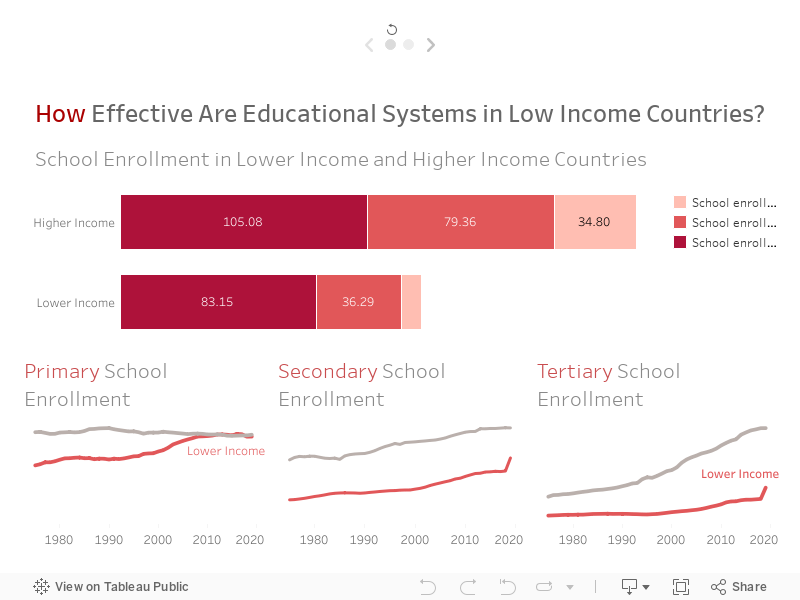
Children and young adults living in low and lower middle income countries are less likely to exercise their right of education and advance from primary to secondary then to tertiary school compared to young adults in higher income countries.
In fact, school enrollment decreases significantly from 83% in primary to 8.6% in tertiary school. Based on thorough exploratory analysis, factors affecting low school enrollment rates in lower income countries include governments’ low expenditure on secondary and tertiary education, in addition to high pupil-to-teacher ratios. On average, low income governments spend 50% less on secondary education compared to primary. Moreover, these countries have 165% more students in classes compared to high income countries; thus, students do not receive sufficient attention to be able to fully understand key concepts which causes frustration among students thus drop outs.
Lower income countries are urged to look into better education expenditure distribution among educational levels, and to prioritize hiring more teachers in order to provide education and secure brighter futures for all children and young adults.
According to UNESCO, about 258 million children and youth are out of school for the school year ending in 2018. The total includes 59 million children of primary school age, 62 million of lower secondary school age and 138 million of upper secondary age. This is a major humanitarian challenge that all countries have united to address by anchoring it within SDG number 4: Quality Education.
Every Child deserves the opportunity to learn. In this Dashboard, we tried to show visualizations that highlight the reality behind Children Out Of School.
Poverty is a barrier that keeps children out of schools.
The gap between males and females attending schools was equal to 14% in 1970 and decreased to reach 2% in 2018. For girls in some part of this world, education chances are still restricted.
“When you carry a life and it’s there, and then gone, a part of your soul dies. Forever”. Casey Wiegano
Yes, I’m a mom, and just thinking about it for a fraction of a second breaks my heart! Unfortunately, Sub-Saharan countries along with some South Asian countries which are highlighted with darker blue in the map whiteness the highest infant mortality rates. In Sub-Saharan countries ,on average, 68 infants die in every 1000 births and this rate is the second highest among the classified regions (second graph)
From the bottom graphs, we can see that there is a high correlation between the average adolescents fertility rates and the female adolescents who are out of school. On the other hand, a correlation exists between the adolescents fertility rate and the mortality rate of infants.The highest rates are also observed in Sub-Saharan countries (darker blue).
Putting these observations into one sentence, we can infer that the more adolescent females that are out of school the more likely they are to give birth to infantsthat havehigher chances of dying.
As such, female students in Sub-Saharan countries should be empowered. They should be encouraged to continue their education aiming to lower their fertility rates and indirectly lower infants mortality rates. With no doubt, many other factors should be considered such as improving healthcare systems for both, moms and children.
Females in the Arab World are always faced with discriminatory situations in a ‘professional environment’. From personal questions in an interview to on-the-job obstacles, something always has to remind us of who we are and how anchored we are to it. It is not very different around the world, however, females have only recently started to break through the notions of the ‘working man’, proving that the only professional difference between them is inside the minds of those who believe it exists.
When I started exploring the World Development Indicators data on Tableau, I could not but stop at the Employment to Population Ratio. So I developed a dashboard visualized below.
As seen on the map, there are big differences in Female Employment to Population Ratios around the world. Looking deeper into the ratios of 2 adjacent but very different cultures, the European Union and Arab Countries – the line graphs to the right -, we can notice the difference in the gaps between female and male ratios. While the Male Employment to Population Ratio is almost the same across both areas, there is a big difference in the female’s numbers, of course affecting the total ratios.
I believe the needed change starts in education – not only that of little girls who need to be equipped by the time they can join the workforce, but also of societies to be welcoming, and supportive of those girls. Many forces enter in this journey, in many cases education is an unaffordable luxury, which is why the intrusion of governments and NGOs is highly needed.
The fertility mutates from region to another and it is related to the culture, education level and civilization. It also decreases from year to year because of civilization, weather, and human life style.
This Dash compares 3 different countries USA: Advance country , Lebanon : Arab region and Africa:third world and shows that all the countries will have the same fertility rate in the future.