by cjk08 | Nov 20, 2023 | Uncategorized

Introduction:
In 2007, the world experienced a financial shockwave that originated from the U.S. housing market downturn. The crisis quickly rippled across global economies, with significant impacts felt in the U.S., U.K., and China. In this post, we’ll explore a comprehensive analysis of the crisis and the concerted policy responses that helped navigate these turbulent economic waters. Accompanied by insightful Tableau visualizations, we delve into the monetary and fiscal adjustments that shaped the path to recovery.
The Epicenter of the Crisis:
The 2007 financial crisis is a stark reminder of the interconnectedness of global markets. Starting in the U.S., the collapse of the housing bubble sent shockwaves that were felt in the U.K., a major financial hub, and China, the burgeoning economic powerhouse. The crisis highlighted vulnerabilities and sparked a global debate on economic safeguards. Our Tableau visualizations, which I’ll share throughout this post, bring to life the data behind these seismic economic shifts.
Economic Indicators in Turmoil:
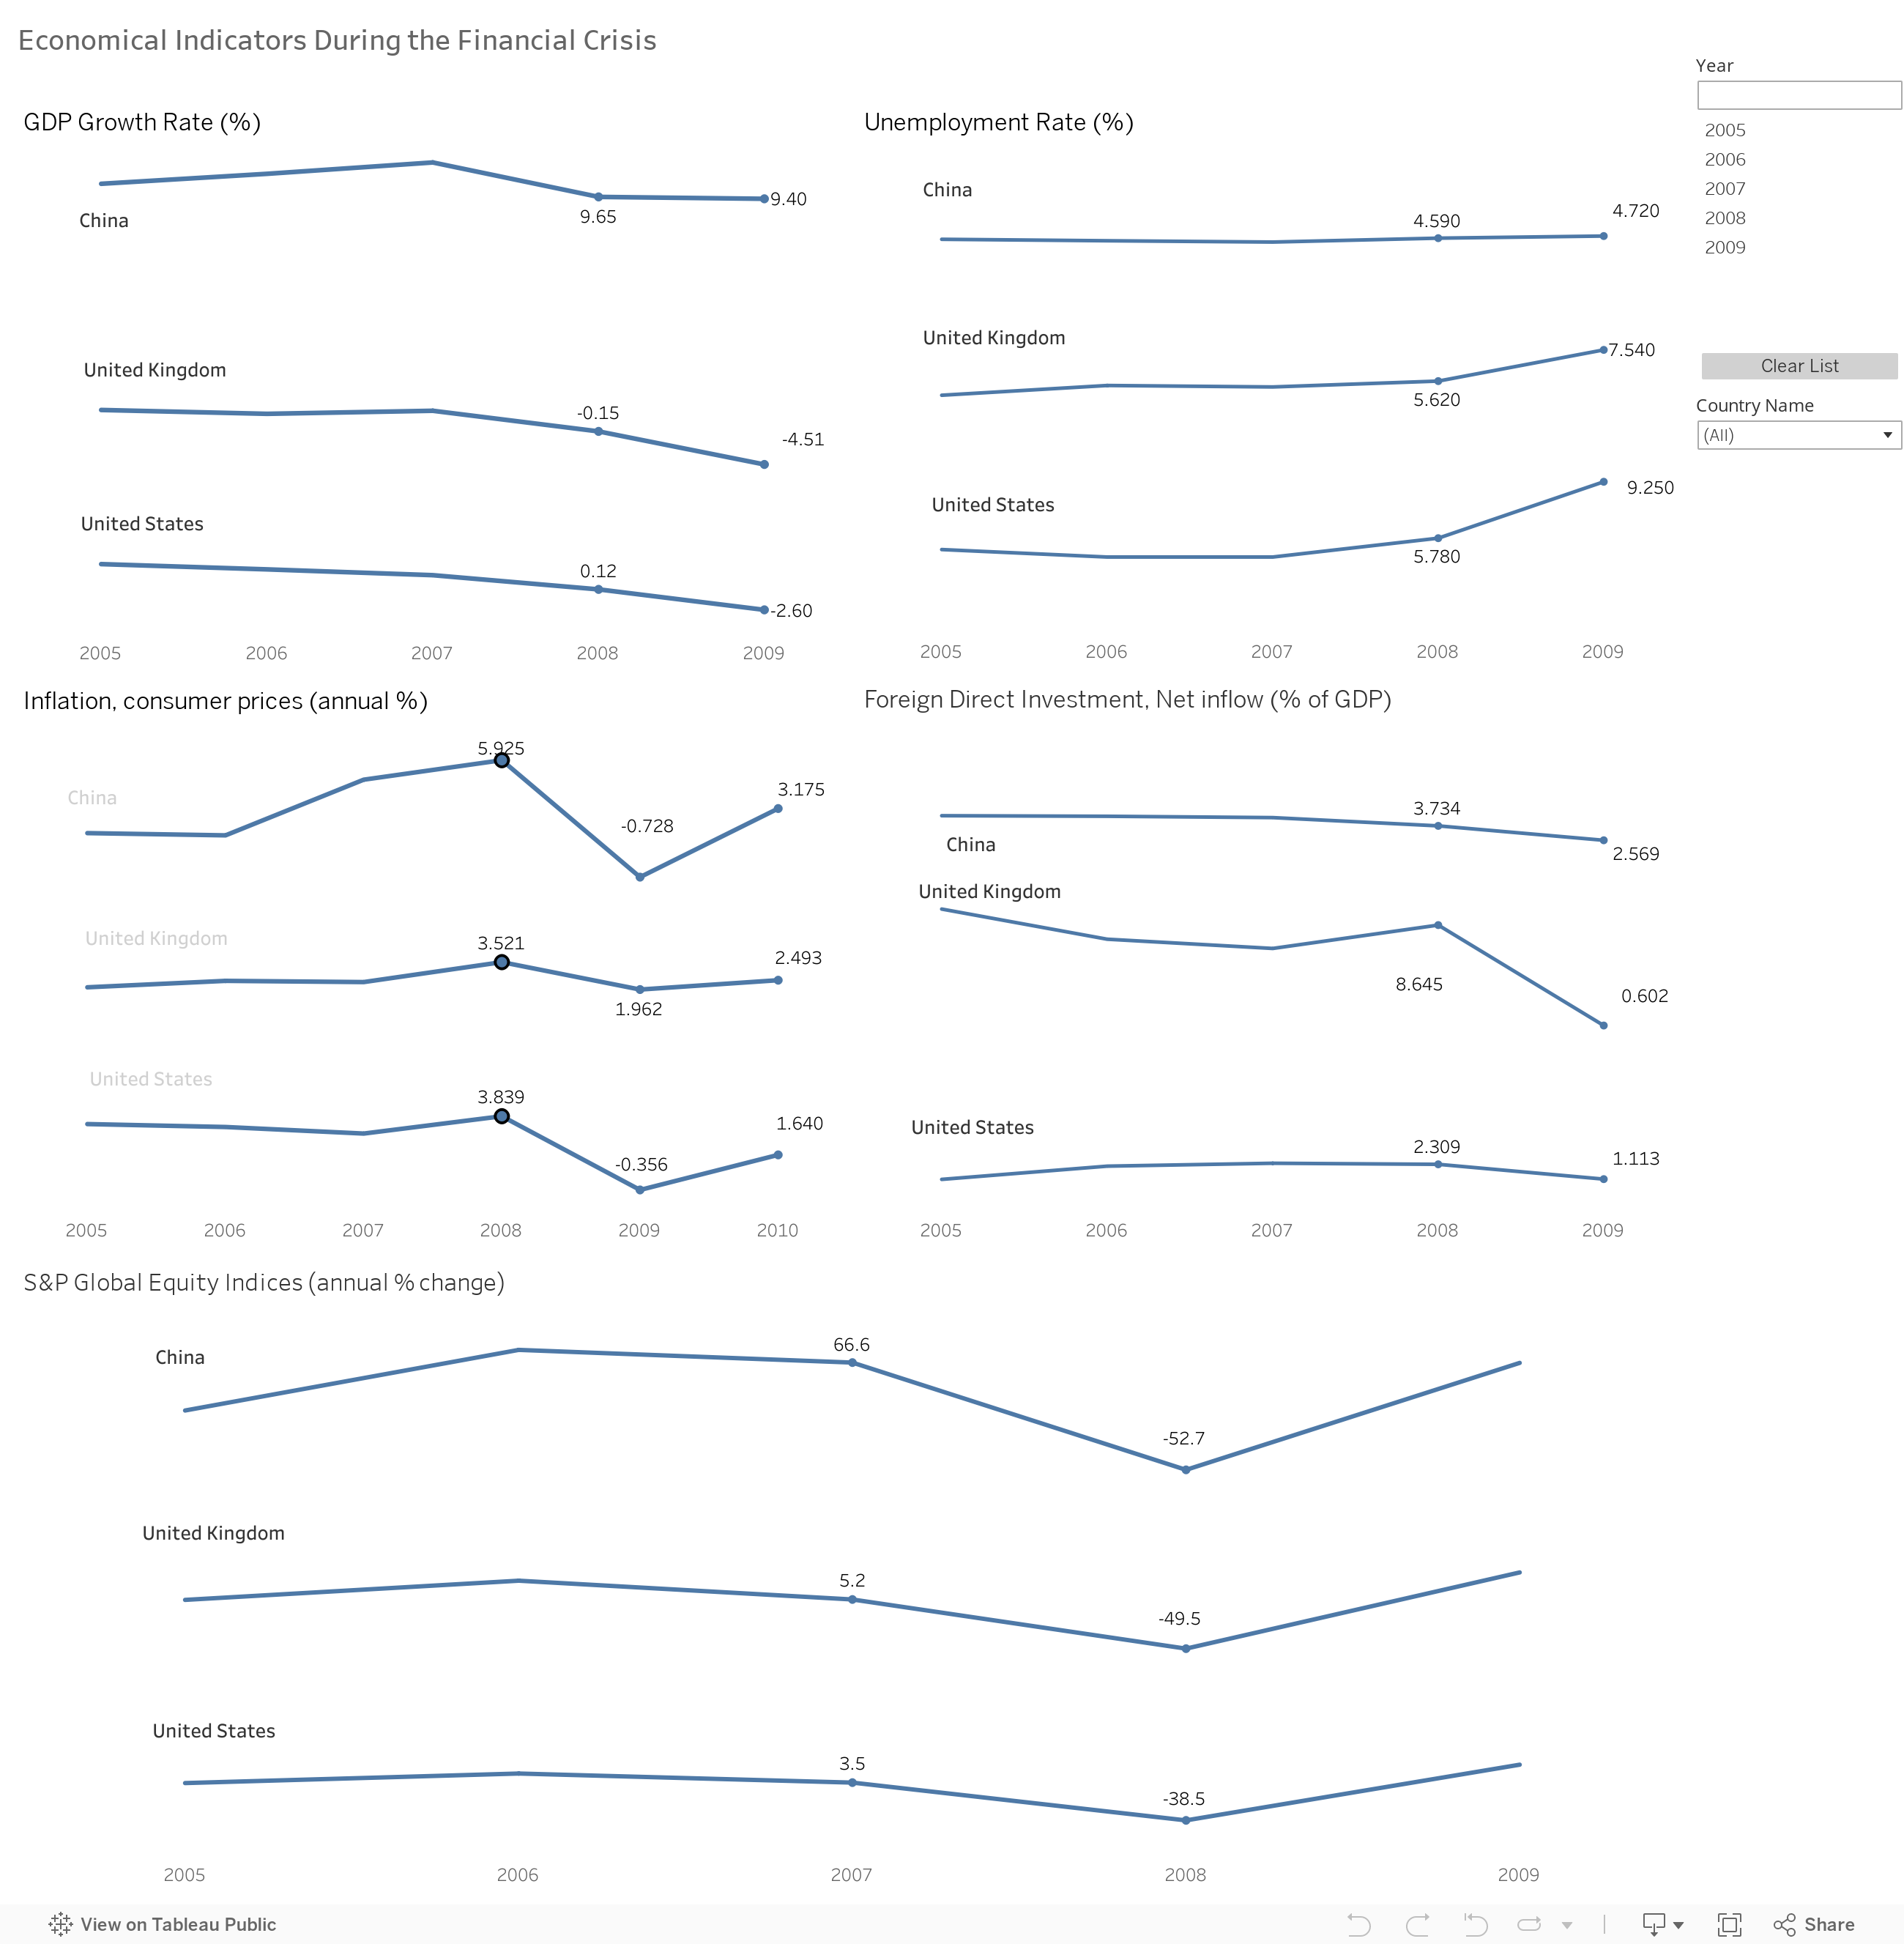
GDP Growth Rate: The severe downturn in the U.S. and UK economies in 2009, with GDP growth plummeting to -2.60% and -4.51%, respectively, signified deep recessions. China’s maintenance of a 9.40% growth rate, despite a global slowdown, demonstrated the effectiveness of its economic policies and a less interconnected reliance on global financial systems.
Unemployment: The dramatic rise in U.S. unemployment to 9.25% in 2009 mirrored the harsh reality of the economic crisis’s impact on the labor market. The UK’s unemployment rate’s more moderate increase to 7.54% indicated a resilient but strained job market. China’s steady unemployment rate suggested a controlled labor environment, possibly cushioned by government-led initiatives.
Inflation and Deflation: The pivot to deflation in the U.S. and China in 2009 highlighted the breadth of the economic contraction, marked by plummeting consumer demand. The UK’s decreasing inflation rate, from its 2008 peak, nonetheless remained positive, reflecting persistent cost pressures despite a contracting economy.
Investor Sentiment and Market Response:
FDI: The UK’s steep decline in FDI following the crisis suggested capital flight and a significant erosion of economic confidence, a contrast to the U.S.’s more stable investment climate. China’s gradual FDI decline mirrored the broader cautious stance of global investors during the period of uncertainty.
Equity Markets: The UK and U.S. equity markets’ deep dives of -49.5% and -38.5% in 2008, along with China’s -52.7% plunge, captured the panic and rapid revaluation of future earnings potential, significantly affecting wealth and spending.
Monetary & Fiscal Adjustments: Navigating Through Economic Turbulence
The global financial crisis of 2007-2008 forced countries to reevaluate their monetary and fiscal strategies. Central banks across the world slashed interest rates, while governments ramped up borrowing to inject liquidity and stimulate economic activity. The graphs provided offer a glimpse into how China, the United Kingdom, and the United States adjusted their policies in the face of economic headwinds.
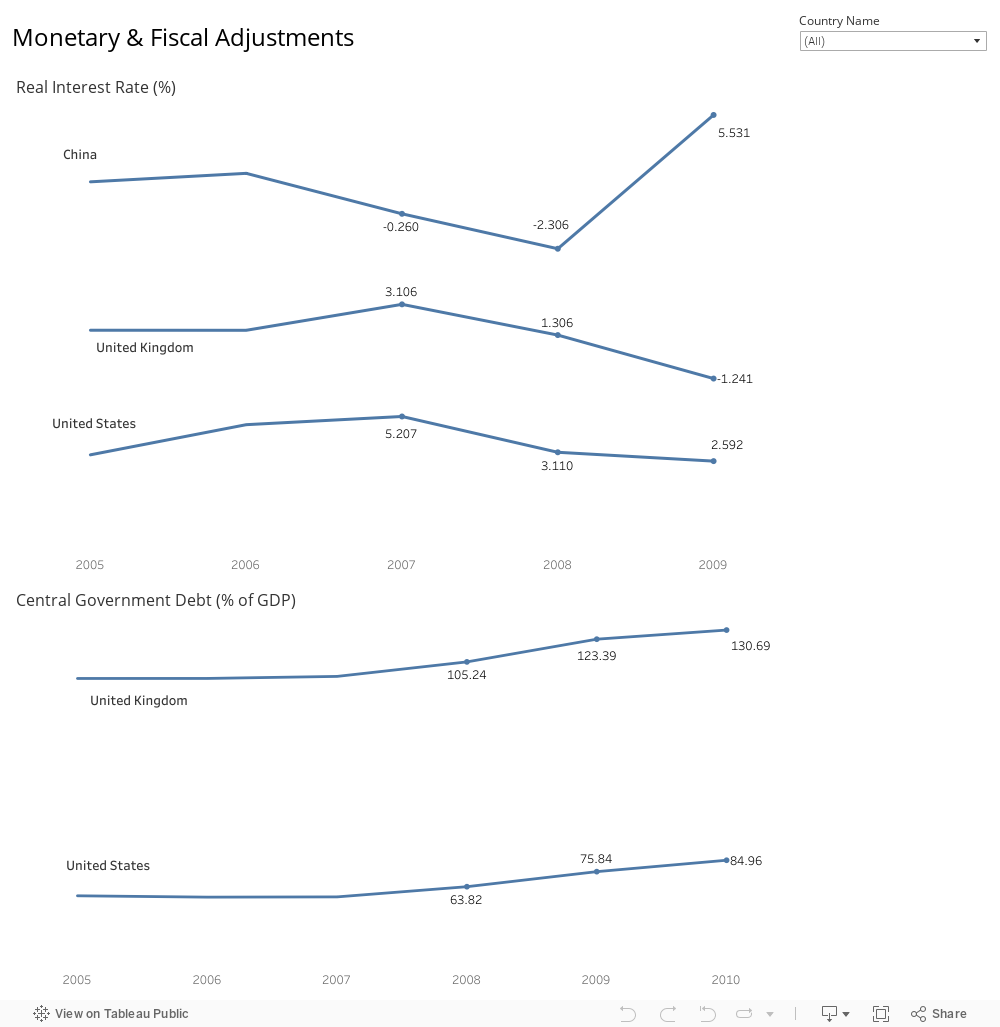
Monetary Policy Adjustments: A Dive into Negative Real Interest Rates
In response to the financial crisis, China, the UK, and the US adopted aggressive monetary policies, including steering real interest rates into negative territory to encourage borrowing and investment. This is particularly evident in 2009’s negative real interest rates.
China responded to the crisis by lowering its real interest rates from -0.260 in 2007 to -2.306 in 2008, indicating a decisive move to encourage spending and investment.
The UK followed a similar path, with real interest rates dropping from 3.106 in 2007 to -1.241 in 2009, reflecting a substantial monetary stimulus.
The US saw its real interest rates decrease from 5.207% in 2007 to 2.592 in 2009, as part of its strategy to revive the economy.
Fiscal Stimulus: The Path of Increased Government Debt
The fiscal response to the crisis was marked by an increase in government debt, as seen in the upward trend of central government debt relative to GDP. This increase is indicative of a commitment to boost economic activity through government spending.
The UK’s central government debt rose sharply from 93.63% in 2007 to 130.69% in 2010, a clear sign of significant fiscal intervention.
The US also saw its government debt climb from 63.82% in 2007 to 84.96% in 2010, as it took on more debt to stabilize the economy.
For China, although not displayed on the graph, the World Bank and IMF data show an increase in central government debt from 16.4% in 2007 to 33.5% in 2010, demonstrating China’s use of fiscal policy to maintain economic momentum.
Analyzing the Impact of Policy Adjustments on Economic Indicators:
Following these adjustments, we look at how they influenced key economic indicators. The equity markets in all three countries showed signs of recovery in 2010, with China’s market increasing by 8.2%, the UK’s by 12.8%, and the US’s by 13.6%. Such improvements in the equity markets typically reflect greater investor confidence, potentially buoyed by lower interest rates making equities more attractive compared to fixed-income assets.
In terms of foreign direct investment (FDI), there was a noticeable uptick in all three countries. China’s FDI as a percentage of GDP went up by 55.9%, the UK’s by an impressive 345.2%, and the US’s by 57.7%. The growth in FDI highlights the global improvement in investor sentiment and market confidence, likely influenced by the monetary easing and fiscal stimulus measures.
As for GDP growth, all three countries experienced positive changes. China continued its robust growth; the UK and the US both rebounded from negative growth rates in 2009 to positive rates in 2010. These changes underscore the effectiveness of the stimulus efforts, which aimed to encourage borrowing, spending, and overall economic activity.
Findings and Recommendations:
The economic data from the 2007-2008 financial crisis reveal that while aggressive monetary easing and fiscal stimulus were critical in mitigating the downturn, the recovery trajectory varied significantly across nations. The U.S. and the UK, with deep contractions in GDP and spiking unemployment, required robust policy responses to revive consumer confidence and stabilize financial markets. On the other hand, China’s proactive fiscal measures, particularly in infrastructure, helped sustain its economic momentum. Our findings suggest that future crises may demand even more nuanced and sector-specific policy interventions. For instance, targeted support for small businesses and industries most affected by a downturn could provide a more efficient path to recovery. Additionally, policies aimed directly at consumers, such as mortgage relief programs, could prevent a cascade of defaults and stabilize the housing market more rapidly. A collaborative international response, leveraging the strengths of interdependent global economies, could amplify the efficacy of such measures. Therefore, we recommend a framework for economic policy that emphasizes flexibility, targeted support, and global coordination to not only cushion against immediate shocks but also to lay the groundwork for sustainable, long-term growth.
Conclusion: Steering Through Economic Adversity
The financial crisis that shook the foundations of global economies in 2007-2008 also brought to light the critical role of proactive monetary and fiscal policies in navigating economic adversity. The United States, the United Kingdom, and China each faced unique challenges and responded with tailored strategies that reflected their economic philosophies and priorities. Despite the varied approaches, the shared objective was clear: to stabilize the financial system, stimulate growth, and restore confidence. The recovery of equity markets, the resurgence of foreign direct investment, and the gradual uptick in GDP growth by 2010 are a testament to the effectiveness of these interventions. This period of economic recalibration provided valuable insights into the intricate dance between government policy and economic health, insights that continue to shape economic strategies in our increasingly interconnected world.

by mse47 | Nov 19, 2023 | Uncategorized
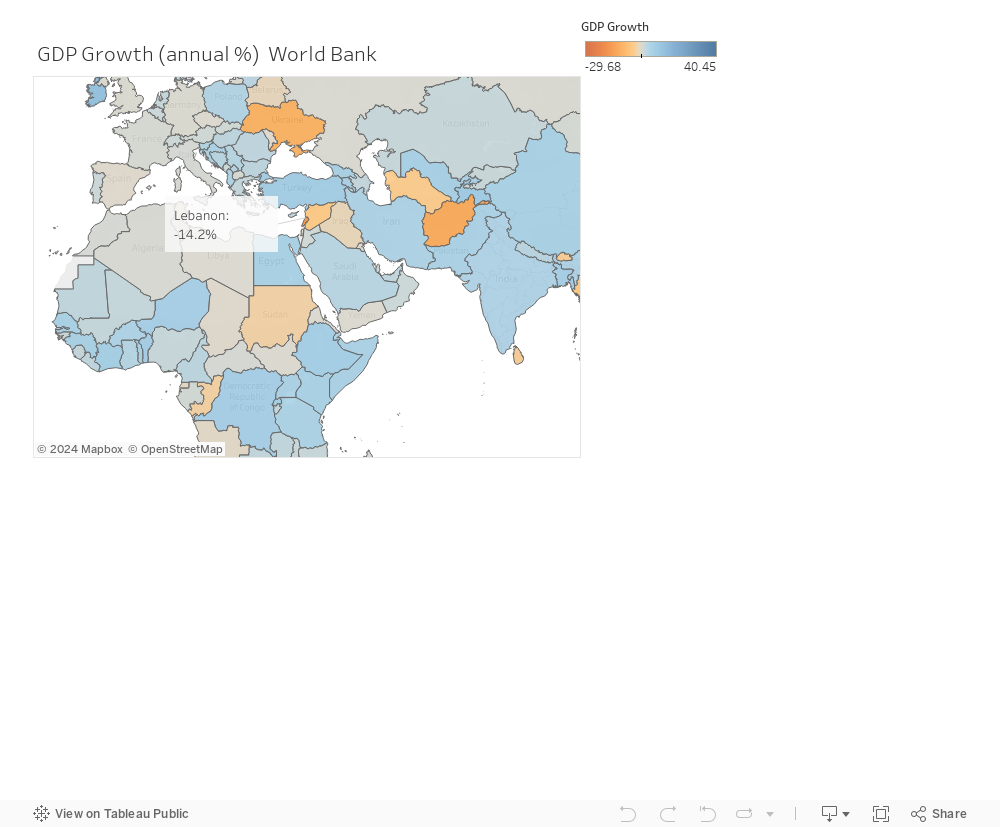
Lebanon has been ranked as one of the top countries with severe negative GDP growth. As shown in the below graph, Lebanon’s GDP growth is also lower than that of its neighboring countries, including Syria which has been facing a war since 2011.
In order to check for potential causes of this severe negative GDP growth, Lebanon was compared with other countries on the level of economic indicators. What is found interesting is that Lebanon has the highest external debt (expressed as % of GNI) compared to other countries, as the below figure shows.
Let’s dig deeper into the relationship between external debt and GDP growth in Lebanon. As the below figure shows, when Lebanon’s external debt made a big jump and increased by 130% (from 147% to 277.9%), GDP growth had a severe decline of 15.5% (from -4.2% to 19.7%).
This relation is validated by a study performed by The Monetary Fund that states that external debt shocks have a negative impact on GDP in both, the short- and medium-terms. This is further shown in bellow screenshot taken from the study (The Monetary Fund,2022).
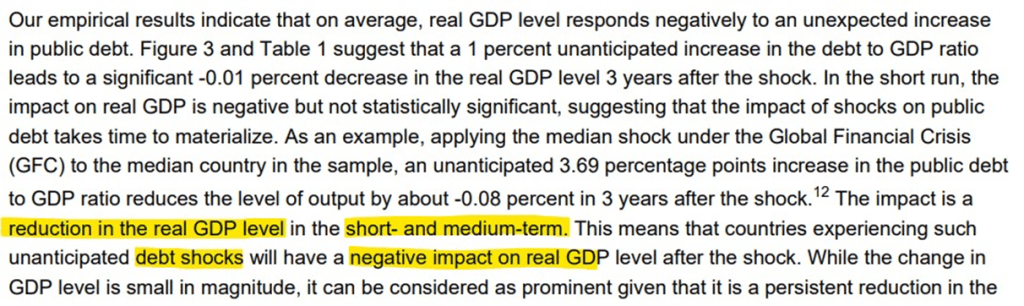
For this reason, The Monetary Fund, in collaboration with the World Bank, has developed The Heavily Indebted Poor Countries (HIPC) Initiative that provides debt relief for qualifying countries if these countries develop a Poverty Reduction Strategy Paper (PRSP) to show how this relief would help them re-increase there GDP.

by nea17 | Nov 18, 2023 | Uncategorized
Crisis Unveiled: The Stark Reality of Gender Literacy Disparity in Chad
Across Africa, gender literacy disparity is a significant issue, but in Chad, this gap is particularly alarming. The country has one of the highest gender literacy gaps globally, with a drastic difference in literacy rates between men and women.
Alarming Evidence: The Bleak Figures of Gender Inequality
According to the visualizations, the problem evidence is:
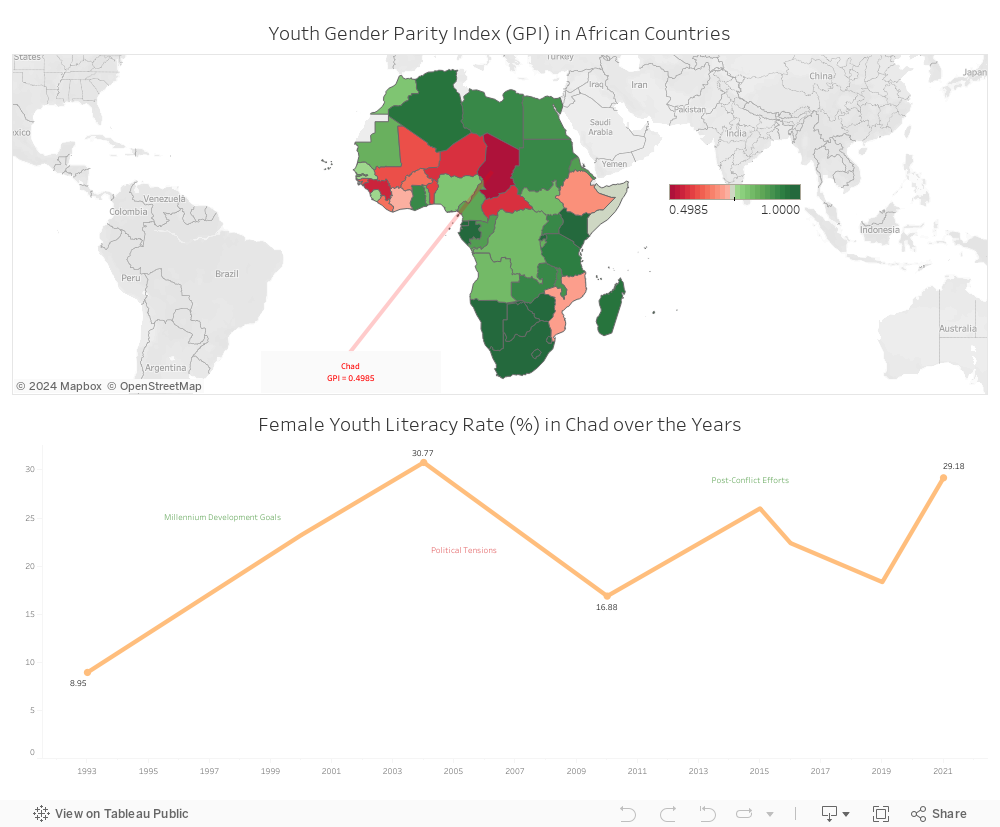
- The proportion of literate young males to females is 2:1 (Gender Literacy Disparity Ratio of 0.4985) which is the worst in Africa, and the world.
- Despite progress leading up to 2003 due to the Millenium Development Goals, Chad’s political tensions, including tensions due to political rebel groups, have hindered female youth literacy, which is now fluctuating due to post-conflict tension relief and Covid-19 impact, however, still is yet to go above the 2003 High.
- Less than one in three young females are literate in 2021.
This disparity is further highlighted by the socio-economic and political challenges unique to Chad. Women’s literacy is severely impacted by their involvement in vulnerable employment, increased domestic responsibilities, and societal norms that prioritize early marriage over education. These factors contribute to a widening gender literacy gap, particularly during crises like the COVID-19 pandemic.
Ray of Hope: Envisioning a Path to Literacy Equality
Potential Solution
Cultural and Educational Reform to Enhance Female Literacy in Chad
- A dual approach focusing on changing societal norms about female education and improving educational access and quality for young females.
- Programs to shift perceptions about female education at the community level, while also improving educational facilities and content.
Turning the Tide: Innovative Solutions in the Shadow of Despair
Solution Details:
- Community Sensitization Programs: Launching programs aimed at changing societal attitudes towards female education. These should involve community dialogues, awareness campaigns, and involvement of influential community figures to advocate for the importance of educating girls.
- Policy Advocacy for Gender Equality in Education: Working with government and local authorities to push for policies that prioritize and protect girls’ education rights, including mandatory education laws that are gender-neutral.
- Female-Focused Educational Infrastructure: Developing schools that cater specifically to girls, with facilities and environments that respect cultural norms while providing a safe space for girls to learn.
- Curriculum that Challenges Gender Stereotypes: Designing educational content that challenges traditional gender roles and promotes gender equality, helping to shift perceptions from a young age
Triumph Amidst Turmoil: Validating the Beacon of Change
To validate these solutions:
- Community Feedback and Participation: Collecting feedback from community members to ensure initiatives align with cultural sensitivities and actual needs.
- Measuring Shift in Perceptions: Conducting surveys to assess changes in community attitudes towards female education over time.
- Monitoring Educational Outcomes: Tracking enrollment, literacy rates, and retention of girls in schools to evaluate the effectiveness of the implemented solutions.
Urgent Call to Action: Recommendations to Break the Chains of Illiteracy
Findings/Recommendations:
- Critical Need for Cultural Change: Research highlights the need to alter societal norms and attitudes towards female education in Chad.
- Integrated Approach for Meaningful Progress: Combining educational reform with cultural transformation is essential for improving female literacy.
- Long-Term Commitment and Strategy: Addressing deep-rooted societal beliefs requires long-term, strategic planning with sustained effort from all involved parties.
- Collaboration is Key: Emphasizing the importance of cooperation between local communities, government, and international partners to drive change.
- Empowerment Through Education: Recognizing that educating girls extends beyond literacy; it empowers them to become active, equal participants in society.
In Chad, the gender literacy gap is alarmingly high, with young women facing significant educational disadvantages due to socio-economic and cultural barriers, including political instability. Addressing this requires a multifaceted approach involving community sensitization to shift attitudes towards female education, policy advocacy for gender equality, the establishment of female-focused schools, and curriculum reforms challenging traditional gender roles. Success hinges on collaborative, long-term strategies and monitoring educational outcomes to empower women as equal participants in society.
SDG Goals Involved:
- SDG 4 (Quality Education): Ensure inclusive and equitable quality education and promote lifelong learning opportunities for all.
- SDG 4.5: Eliminate gender disparities in education and ensure equal access for the vulnerable, including persons with disabilities, indigenous peoples, and children in vulnerable situations.
- SDG 4.5.1: Measures the proportion of students in primary, lower secondary, and upper secondary education who have access to education without discrimination based on gender, disability, or other factors.
- SDG 4.5.2: Focuses on the elimination of disparities in participation rates in organized learning (one year before the official primary entry age), by gender and other demographic factors.
- SDG 4.5.3: Addresses disparities in tertiary education, measuring the participation rate by sex, socioeconomic status, and other factors.
- SDG 5 (Gender Equality): Achieve gender equality and empower all women and girls.
- SDG 5.6: Ensure universal access to sexual and reproductive health and reproductive rights.
- SDG 5.6.1: Tracks the proportion of women aged 15-49 years who make their own informed decisions regarding sexual relations, contraceptive use, and reproductive health care.
- SDG 5.6.2: Measures the number of countries with laws and regulations that guarantee women aged 15-49 years access to sexual and reproductive health care, information, and education.
- SDG 10 (Reduced Inequalities): Reduce inequality within and among countries.
- SDG 10.3: Ensure equal opportunity and reduce inequalities of outcome, including through eliminating discriminatory laws, policies, and practices.
- SDG 10.3.1: Focuses on the proportion of the population reporting having personally felt discriminated against or harassed within the last 12 months on the basis of a ground of discrimination prohibited under international human rights law.
- SDG 17 (Partnerships for the Goals): Strengthen the means of implementation and revitalize the global partnership for sustainable development.
- SDG 17.18: Enhance capacity-building support to developing countries to increase significantly the availability of high-quality, timely, and reliable data.
- SDG 17.18.1: Tracks the number of countries that have national statistical legislation that complies with the Fundamental Principles of Official Statistics.