This does not start with a funny caption or a happy anecdote, but I assure you it’s an important topic and it touches the lives of everyone. This is Tarek Moukalled, and I hope that by the end of this session you can see the light at the end of the tunnel for patients in Lebanon.
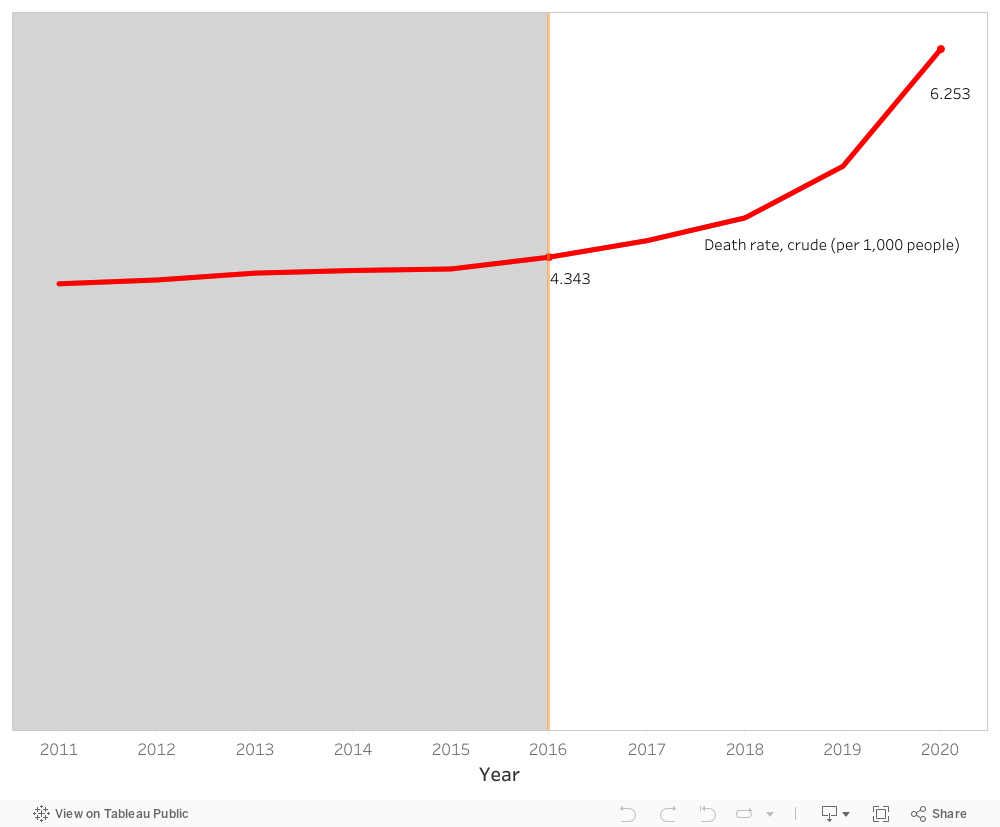
Our story begins with rather an unfortunate observation. Patients in Lebanon are dying. As a matter of fact, the death rate has increased from 4.34 deaths in 2016 to 6.25 deaths in 2020 per 1,000 persons. That is drastic and an alarming increase of approximately 44 % during a span of 5 years. But why?
A close inspection of the healthcare expenditure per capita during the suggested years shows a considerable increase from 648 USD to 995 USD. Furthermore, the % expenditure of GDP on healthcare in Lebanon also shows a consistent trend of a little less than 8 % across the same years. So, things should be fine, if not better! Yet unfortunately, this is not the case.
It appears the Lebanese people have been taking things into their hands. With the economic recession and the subsequent governmental bankruptcy, GDP decreased from ~ 51.1 billion USD in 2016 to 31.7 billion USD in 2020. This led to the fact that the Lebanese people have been paying more and more from their own pockets for healthcare reaching a whopping 44.2 % of healthcare expenditure in 2020.
Comparing the above results with the healthcare sector of a different country that shares similar demographics and healthcare expenditure with Lebanon would help with the context and the subsequent validation of the proposed solution, the light at the end of the tunnel. Remember?
With a similar % expenditure of GDP on healthcare (~ 7.5 %) and a little lower starting point in death rate of 3.16 per 1,000 persons, Jordan’s death rate in 2020 reaches 3.47 per 1,000 persons. The healthcare expenditure per capita in Jordan is consistently way lower than that of Lebanon. The % of out-of-pocket expenditure on healthcare is also steady and lower than that of Lebanon. As to the GDP, it starts lower than Lebanon in 2016 at ~ 39.9 billion USD and ends higher than Lebanon at 43.6 billion USD. As such, the main considerable deviation between both countries is the GDP amount. For that matter, it’s important to note that economies and healthcare sectors grow through expenditure rather than stagnation or restriction.
The increase in the share of health expenditure as part of GDP will have positive results on both short-term and long-term.
Enhanced Healthcare Quality
Faster Healthcare Response
Improved Patient Health Outcome
Decreased Death Rate
Target for Healthcare Tourism
With that, it is imperative to urge whoever who is responsible to proceed with the increase in healthcare expenditure for the sake of our patients and our future.
You are probably aware of the United Nations 2030 Sustainable Development Goals. As a High School College Admissions and Career Guidance Counselor, you can play an important role toward achieving GlobalGoal 8, especially the target of full employment and decent work for all. You can help by providing students with data-driven advice about the jobs of the future. It’s important for students to think about their future careers not only in light of their interests, but also in light of which jobs are on the rise.
6 out of 10 workers will require training before 2027
The Future of Jobs Report by the World Economic Forum is one of the best publications that can help you provide students with scientific advice. It is a yearly publication, and the most recent version was published on May 2023. It brings together the collective perspectives of 803 companies, employing more than 11.3 million workers – across 27 industry clusters and 45 economies from all world regions. One of the most striking findings of the report is that 6 out of 10 workers will require training before 2027.This should give you an idea about the pace at which things are moving, and how drastic the landscape of the job market could be changing in the coming few years.
Cashiers, Waiters, Farmers, and Chief Executives are on the list of occupations with the largest job declines
You may have guessed that cashiers are on the list, but have you guessed that waiters and farmers are also on the list? How about Chief Executives? This is why you want reliable data and not intuition as the basis of your career guidance. One of the best resources that you can refer to is the Occupational Outlook Handbook by the US Bureau of Labor Statistics, particularly the Employment Projections (EP) which provides information about the US labor market for 10 years in the future. The Handbook is only about the US labor market, but it is still a very good resource that gives you insights into future trends regardless of where you are.
The 2022-2032 Employment Projections can definitely inform your high school students’ decisions when they start planning for their future careers. It gives an idea about which jobs are growing, and which jobs are declining.
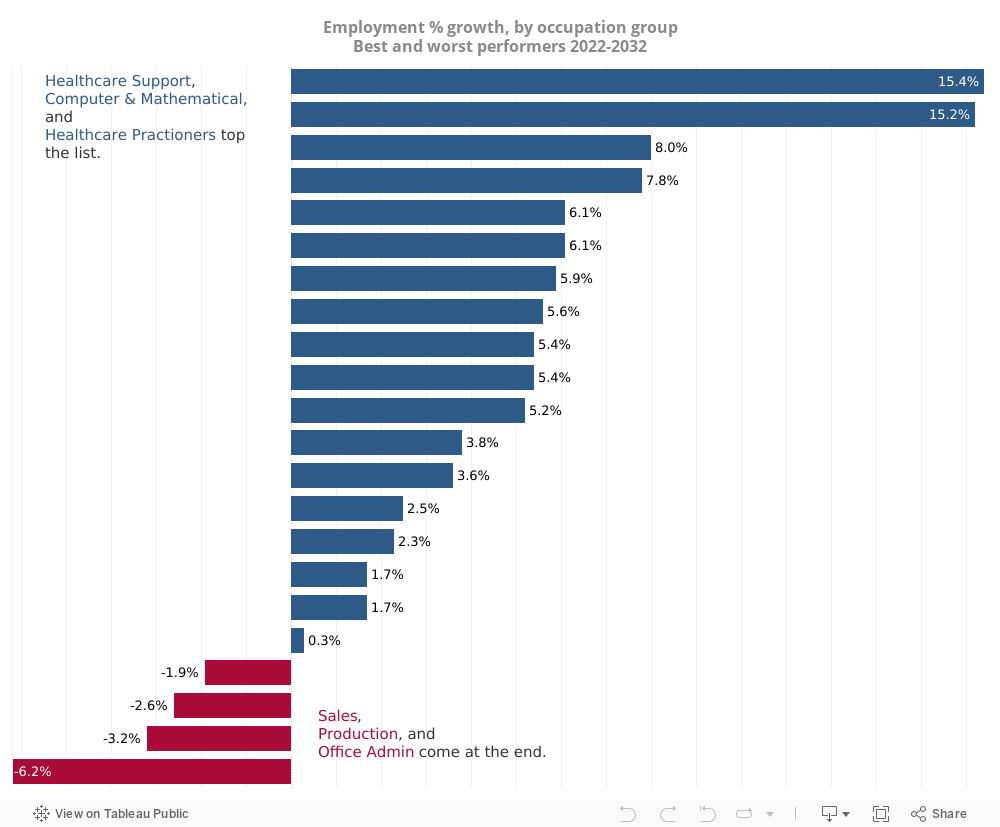
Healthcare and Tech are on the rise while Sales and Administrative occupations are declining
Let’s start with a macro-level picture of which occupation groups have the fastest percent growth, and which ones have the highest negative growth.
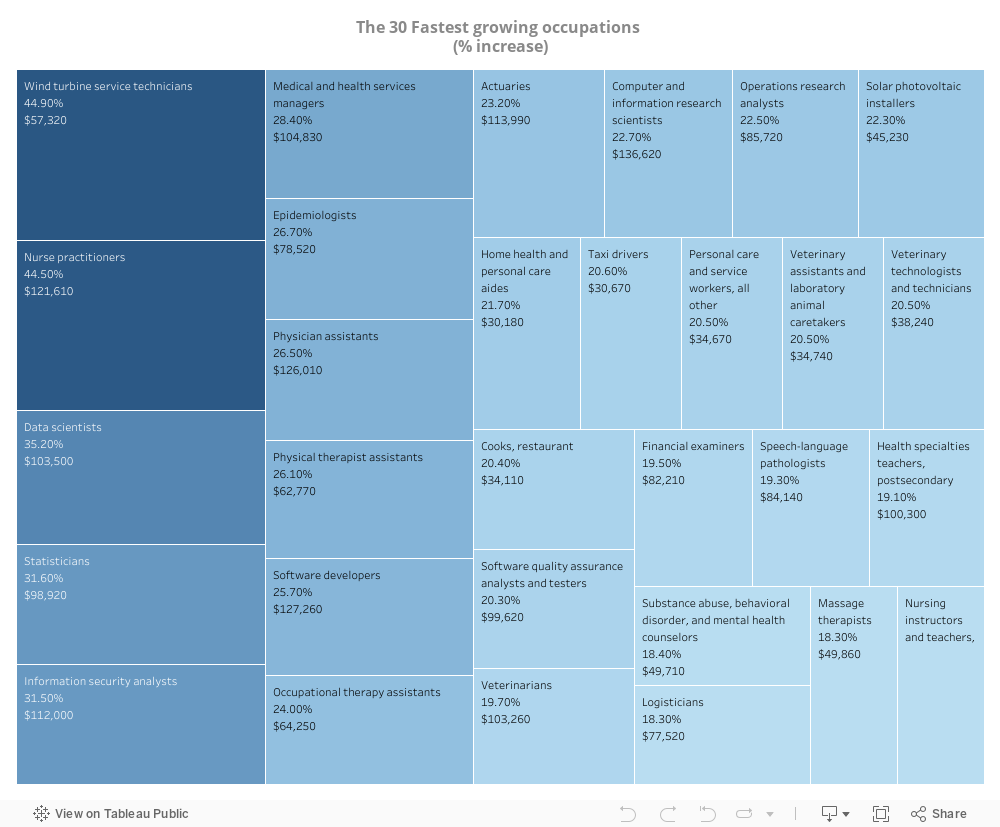
The fastest growing occupations
Now, let’s look more closely at the specific job titles with the highest percent growth, and let’s examine the median 2022 wage for these job titles. The top 3 places are: Wind Turbine Service Technicians, Nurse Practitioners, and Data Scientists. This is not very surprising because we know from the previous graph that healthcare and tech jobs are on top of the list of the most growing professions. We also know from the Future of Jobs report by WEF that green jobs are expected to grow more rapidly than other jobs which explains the presence of Wind Turbine Service Technicians on the top of the list.
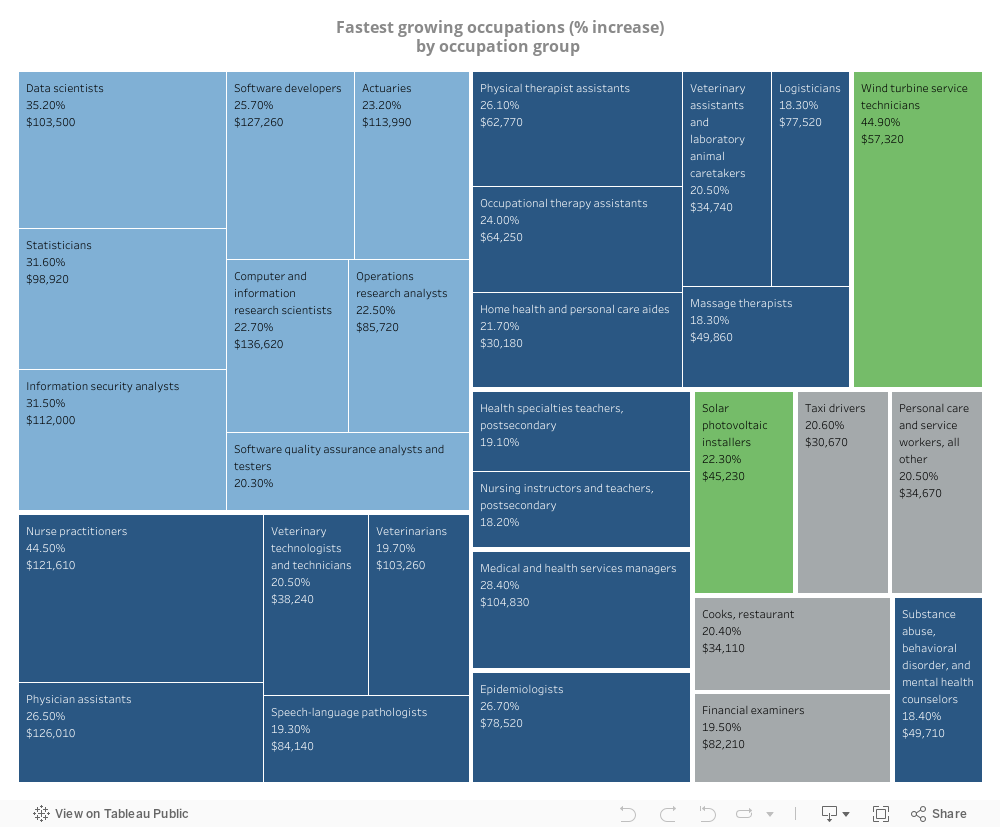
Healthcare, tech and green jobs dominate the list
If we reorganize the treemap by occupation group, we’ll realize that 26 of the fastest growing jobs come from one of three categories; healthcare jobs (16), technology jobs (8), and green jobs (2). Looking closer at the list above reveals that there is a big discrepancy in the median annual wage among the the 30 fastest growing jobs. Computer and Information Research Scientists make a median annual wage of $36,620 in 2022, while Home Health and Personal Care Aides make only $30,180.
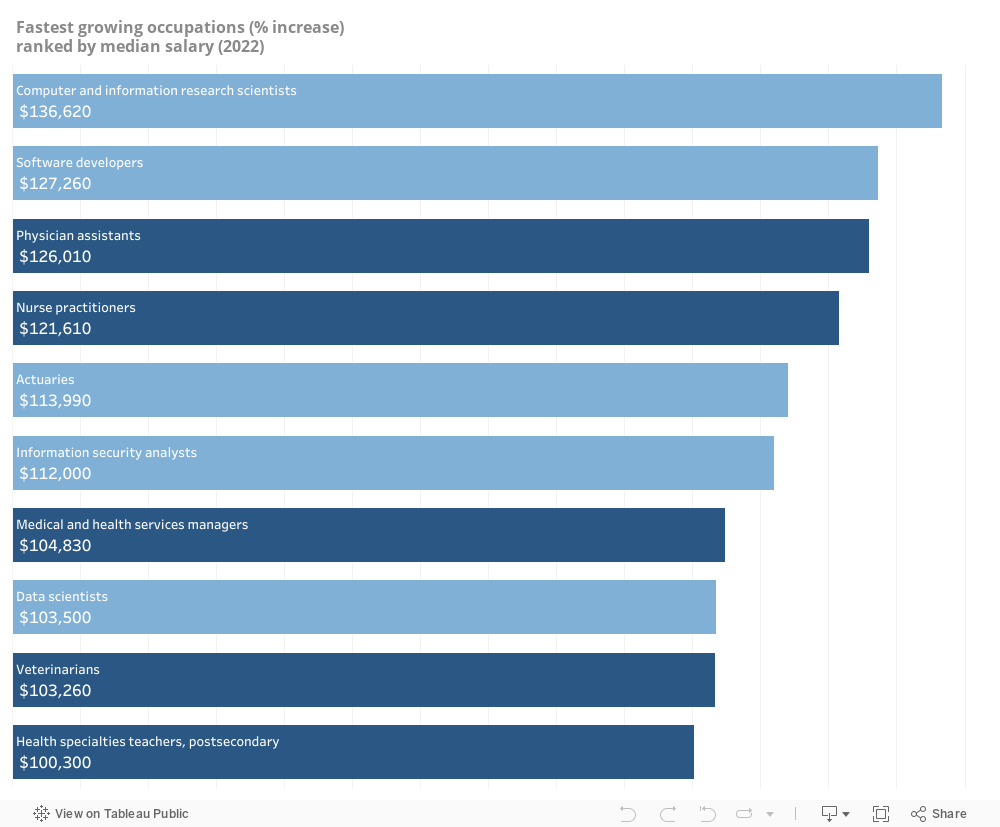
The top 10 paying jobs in the fastest growing occupations list
You are probably curious to know which fast growing jobs make the most money. Below is a list of the top 10 jobs in median annual wage among the 30 fastest growing jobs in the US. This list is now completely dominated by healthcare and tech jobs with equal share for both.
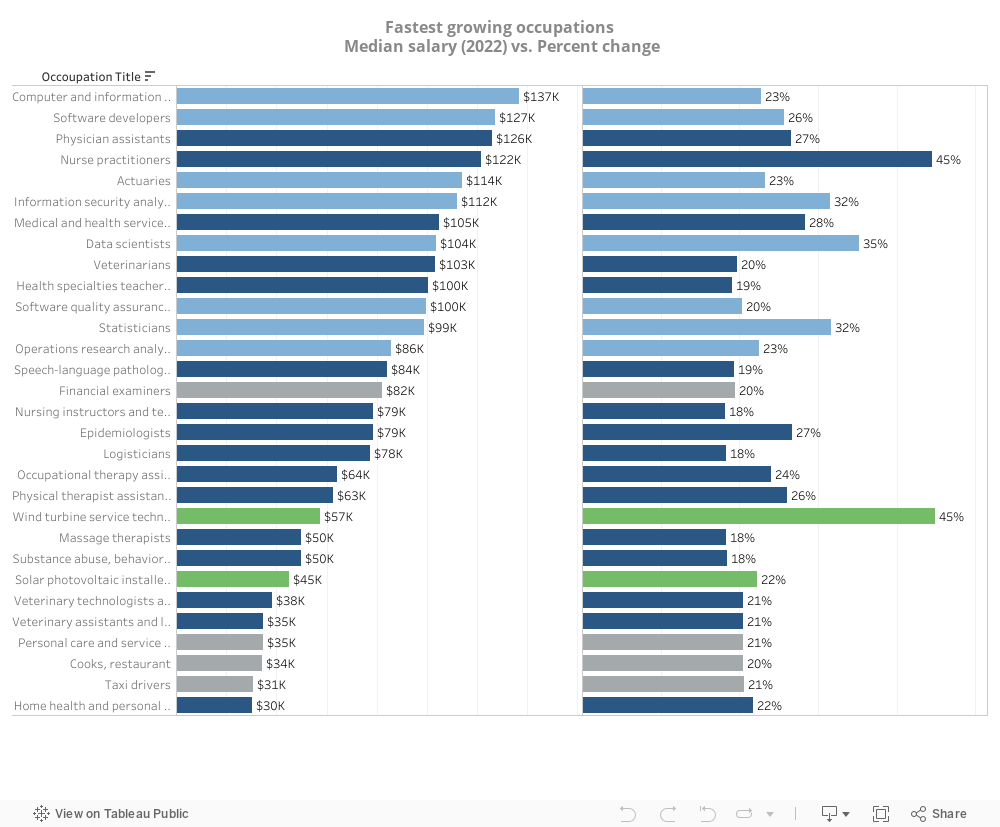
Below is the full list of the fastest growing jobs ordered from the highest median annual wage to the lowest, with the expected percent increase between 2022 and 2032. It looks like Nurse Practitioners will enjoy very high demand (45%) and a very high median pay ($121,610).
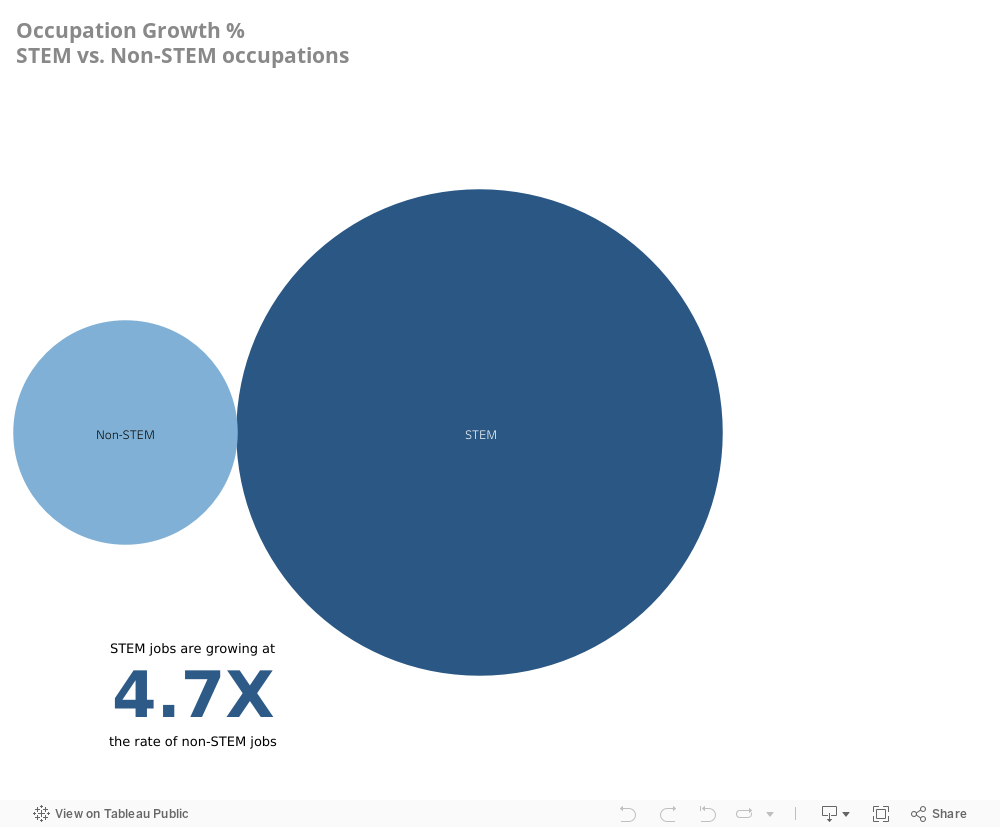
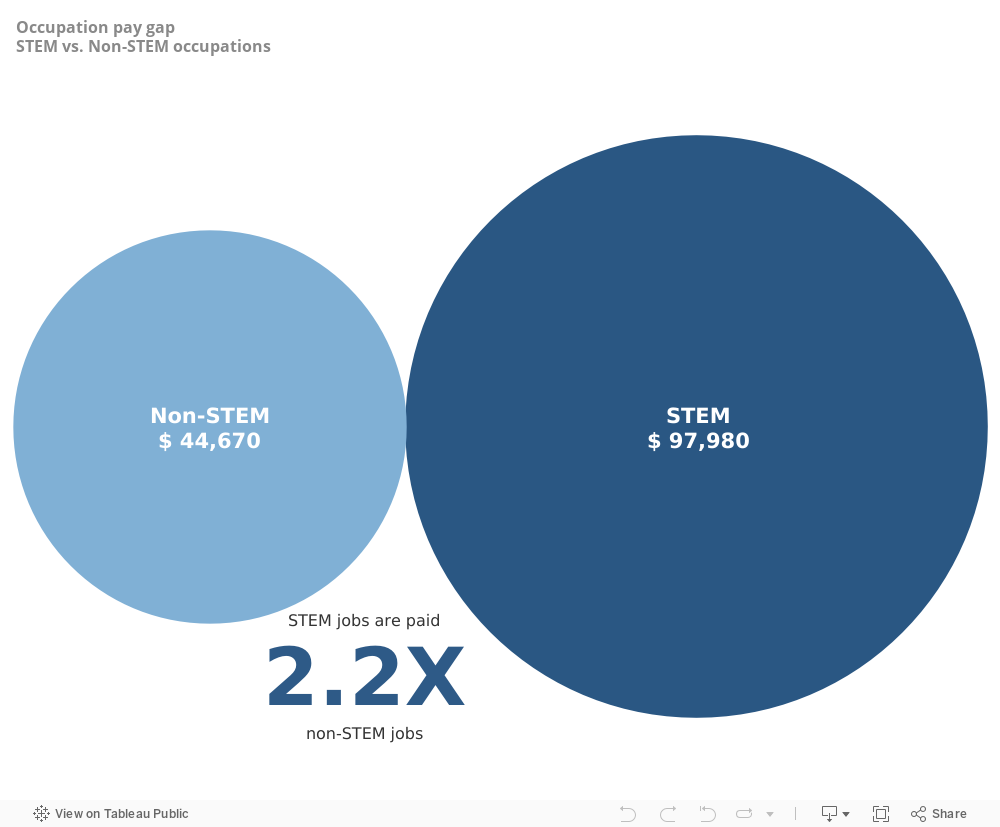
STEM vs no-STEM
It’s probably clear by now that there is a huge gap in demand and pay between jobs in Science, Technology, Engineering, and Mathematics (STEM), and non-STEM jobs.
STEM jobs are growing at 4.7X the rate of Non-STEM jobs.
STEM jobs are getting paid 2.1X as much as Non-STEM jobs.
It is in fact overwhelming to ask an 18-year old to choose his or her future career path, but isn’t that what happens when they write their college applications? Students are usually asked to select the major or at least the school (faculty) to which they would like to apply. While a student can always change his/her major in theory, things can get complicated in reality. Say a student is very interested in humanities and engineering. If the student decide to apply to a humanities major but later finds out about this pay gap between engineering and humanities after she is already enrolled in college, it may not be possible for her to transfer from the faculty of Arts and Sciences to the faculty of Engineering. So, it’s critical to provide students with all the information and allow them to take data-informed decisions that incorporate the future projections of the job market into consideration.
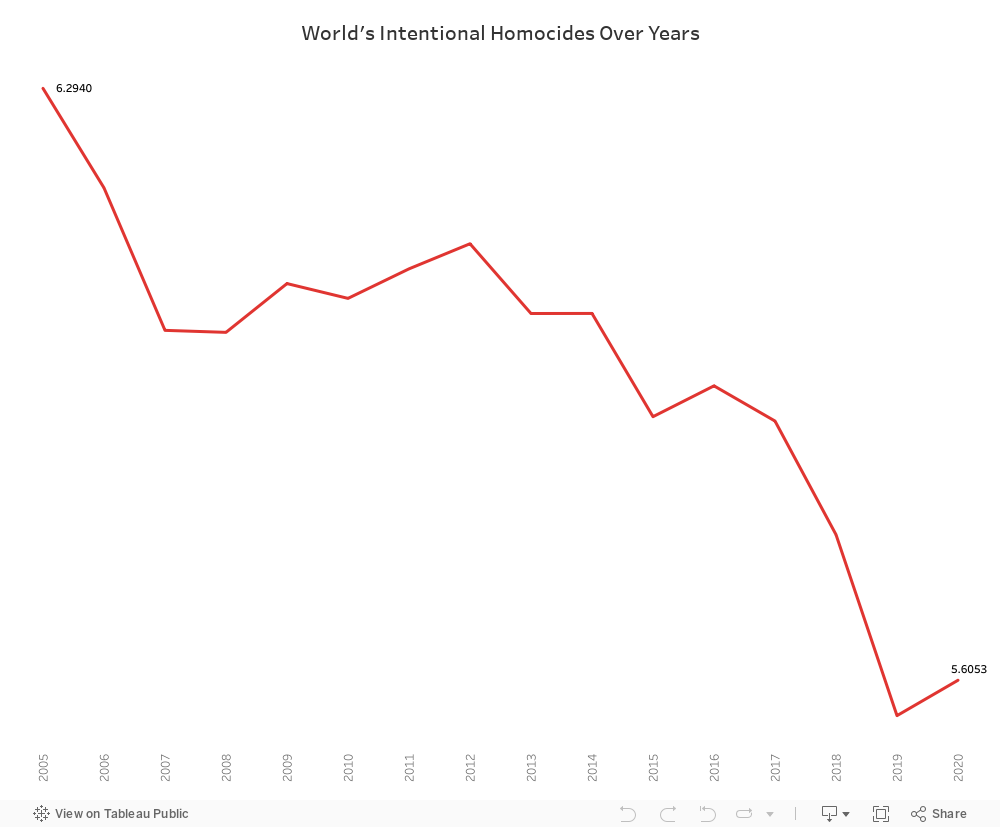
In the pursuit of a world marked by Peace, Justice, and Strong Institutions (SDG 16), there exists a formidable challenge that casts a shadow on our collective journey: intentional homicides. As nations strive for equilibrium and progress, this rising tide of violence threatens to disrupt the delicate balance sought under SDG 16, unraveling the fabric of our communities and hindering the path to justice.
The Unsettled World
Intentional homicides not only claim lives but shatter communities, leaving a trail of grief and despair in their wake. The impact reverberates beyond the immediate loss, affecting the very foundations of sustainable development. As we stand at the intersection of a quest for global justice, intentional homicides emerge as a stark reminder of the work yet to be done.
A Sign of Change
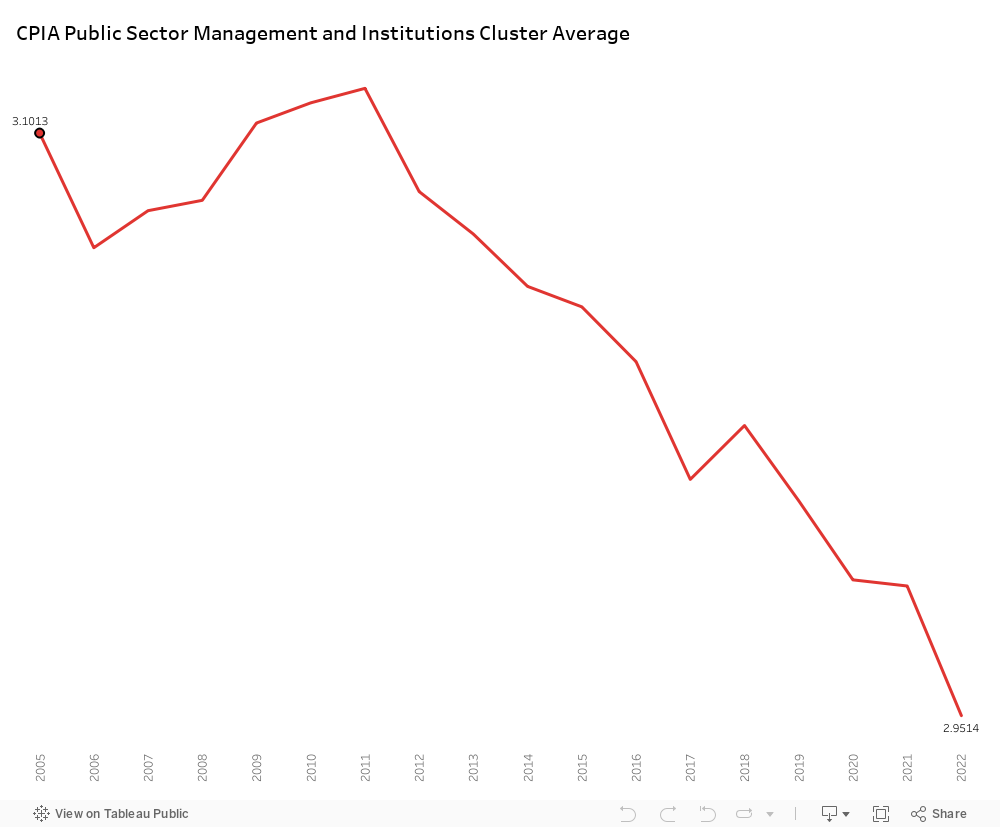
The CPIA (Country Policy and Institutional Assessment) Public Sector Management and Institutions cluster average provides an assessment of a country’s public sector quality, including aspects of governance and institutional strength. While this assessment doesn’t directly address homicides, improvements in public sector management and institutions can have indirect effects on reducing crime and promoting stability.
Countries with higher CPIA Public Sector Management and Institutions cluster average scores are likely to have more effective governance, transparent institutions, and better public administration. Such improvements can contribute to a stable environment, potentially discouraging criminal activities, including homicides. Strengthened institutions often lead to better law enforcement, judicial systems, and crime prevention strategies, indirectly impacting public safety.
Bold Steps
It’s our turn to help in implementing SDG 16. Let’s start drawing the peaceful world we always dreamed of by:
Advocating for Policy Reforms: Encourage comprehensive policy reforms that prioritize enhancing public sector management for increased transparency and responsiveness.
Promoting Anti-Corruption Measures: Emphasize the importance of anti-corruption measures within public institutions to ensure integrity and accountability.
Investing in Judicial and Legal Reforms: Support initiatives aimed at improving judicial and legal systems for fair and efficient justice.
Empowering Local Communities: Foster community engagement in decision-making processes, empowering citizens to actively participate in governance.
Championing Transparency with Open Data: Advocate for transparency through open data initiatives, making government data accessible for public scrutiny.
Enhancing Education and Training: Invest in education and training programs for public servants to elevate their skills and knowledge.
Encouraging Collaboration: Promote collaboration between government, civil society, and the private sector to address shared governance challenges.
Raising Public Awareness: Launch public awareness campaigns to inform citizens about the importance of strong institutions in ensuring justice and maintaining peace.