by yje08 | Nov 21, 2025 | Dashboard
Companies often evaluate performance by looking only at sales, assuming that high revenue automatically reflects strong results. However, sales can be misleading. Some categories generate impressive revenue but end up losing money, while others quietly drive the majority of profit. Relying on sales alone can lead to poor investments and inaccurate conclusions about category performance.
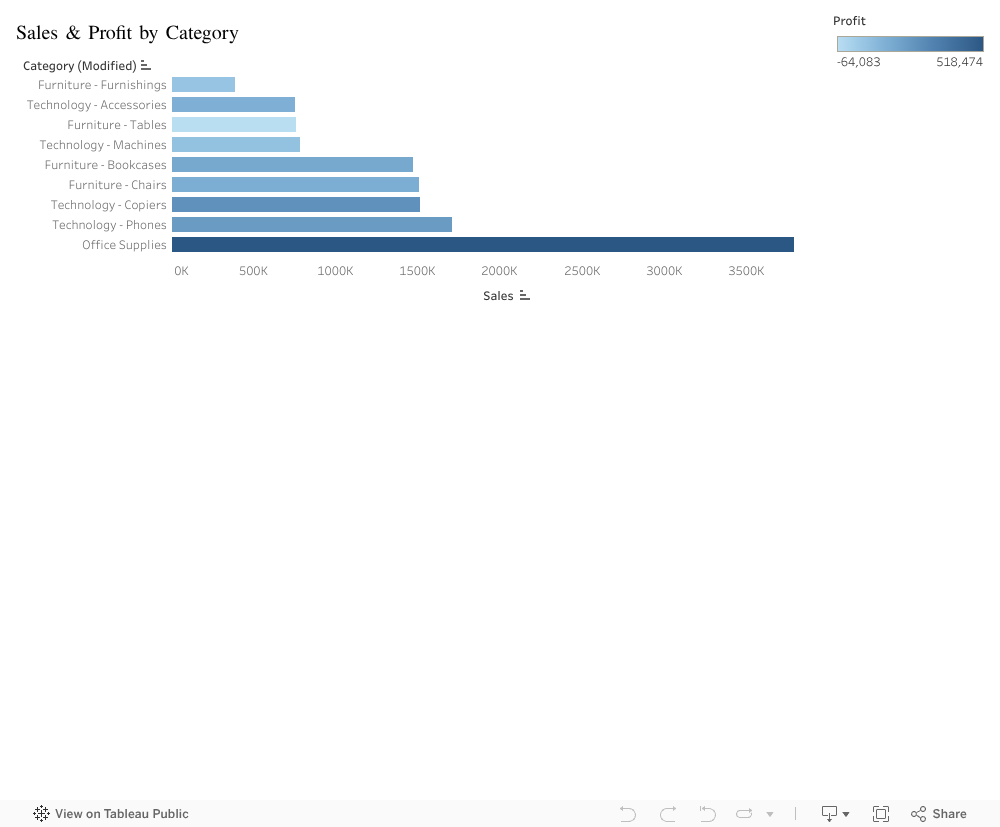
The dataset shows several categories, especially in Furniture, generating strong sales but very low or even negative profit. At the same time, categories with lower sales sometimes produce healthier margins.
Analyzing sales and profit together helps reveal which categories actually create value and which ones drain resources.
The data shows that Office Supplies and Technology consistently generate positive profit, even when their sales levels vary. Furniture categories, however, show a mismatch: moderate demand but weak profitability, suggesting high costs or inefficient pricing strategies.
Comparing sales and profit makes it clear which categories support overall performance and which ones weaken it. Categories with strong sales and strong profit promote growth, while those with high sales but low profit reduce financial strength.
High revenue does not guarantee strong performance. The business should reassess low-profit categories, especially in Furniture, and prioritize categories that consistently generate positive profit. Focusing on profitability rather than sales volume leads to more informed and sustainable decisions.
by cam27 | Nov 19, 2025 | Uncategorized
 When we first began reviewing the company’s profitability across subcategories, one issue kept resurfacing: some segments were growing steadily, while others quietly chipped away at our overall performance. We suspected that a few subcategories were dragging profit down, but we needed a clear, visual way to identify which ones.
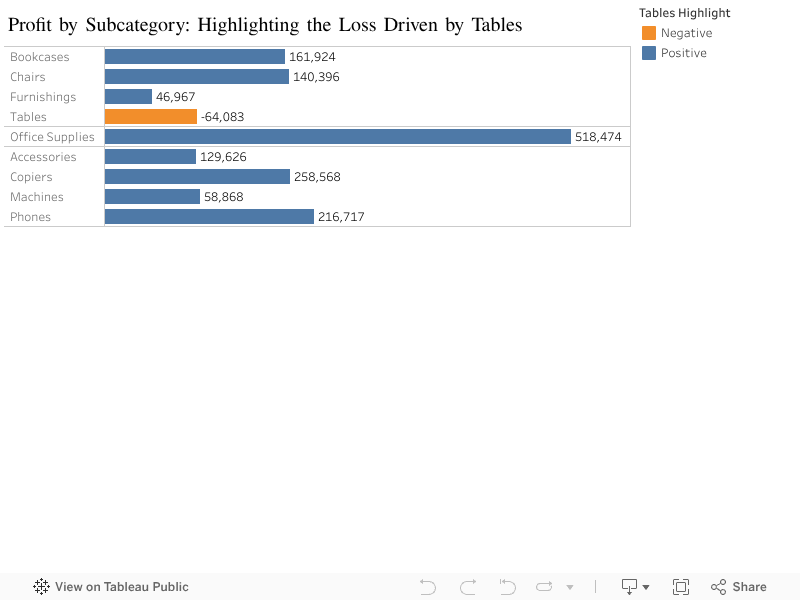
That led us to build a simplified profit-by-subcategory chart, removing unnecessary clutter and focusing only on the message that mattered. Once visualized, something became immediately clear: while most subcategories contribute positively to profit, Tables are the only one with a significant negative profit, sitting at a loss of around 64,000. By contrast, categories like Copiers and Office Supplies deliver strong, healthy profit levels, forming the backbone of our performance.
What makes this finding important is that it highlights a very specific point of leakage in an otherwise positive portfolio. Without a visual breakdown, this loss could easily be buried under the stronger-performing categories. But by isolating each subcategory and color-coding the negative performer, the issue becomes impossible to miss.
In other words, this visualization isn’t just a chart — it’s a diagnostic tool. It points directly to where strategic attention is needed. Should we reassess pricing? Review supplier costs? Consider reducing discounts or adjusting inventory? Tables clearly require deeper investigation to understand why they are underperforming while similar categories such as Chairs, Bookcases, and Furnishings show stable or positive profit outcomes.
This insight gives us a starting point, not an ending. With Tables clearly flagged as the outlier, we now know exactly where to begin our analysis, and we can allocate time and resources efficiently instead of combing through dozens of product lines blindly.

by dse19 | Nov 20, 2023 | Uncategorized
Introduction
Imagine you have a business of your own. Consider it a dream come true to have it thrive. Now, as an entrepreneur, what would you care about most for your business’s future? As a matter of fact, you can respond to this question with a multitude of answers, and all of them will converge to having a viable business, which becomes so through profits, which are achieved through SALES!
For the purpose of realizing the importance of sales to a business, we dive in this blog into the sales performance of a US based company belonging to the food and beverage sector and operating its three contemporary coffee-shop like stores within the busiest state in the United States, New York.
The company has 4 facilities, 1 main office and 3 customer facing stores (store 2, 3, and 4).
Overall Sales Performance
Our focus is to dissect and understand the sales trends and patterns that have emerged over the past two years, shedding light on the company’s growth, challenges, and opportunities.
The company’s sales trajectory exhibited a notable improvement in the first half of the years 2017 to 2018, indicating a successful adoption of growth strategies during this period. However, an interesting pattern emerged in the latter half of these years. The sales figures, initially showing distinct growth, began to converge towards approximately the same numbers in the second halves of both years. This dichotomy of divergence and subsequent convergence underscores the necessity to dig deeper into the analysis, understanding the underlying factors that led to this trend and identifying strategies to ensure consistent growth during upcoming years.
Sales Performance by Store
To further our understanding of the underlying patterns, rather than aggregating results of all stores, the sales performance of each store is studied separately throughout 2017 and 2018, offering a meticulous examination of sales figures, customer demographics, and quarterly trends. The objective is to uncover hidden challenges and propose a comprehensive action plan for sustained improvement.
Inadequacy of Store 2 Performance
In 2017, Store 2 reported sales of $281,000, which experienced a positive growth trajectory, reaching $322,000 in 2018. While indicative of progress, it’s essential to juxtapose these figures with the more robust performances of Store 3 and Store 4, recording $555,000 and $564,000 in 2017, and $637,000 and $638,000 in 2018, respectively.
In our analysis of growth percentages, Store 2 demonstrated a notable growth rate of approximately 14.6%. This rate is closely aligned with the growth rates of Stores 3 and 4, which reported rates of approximately 15% and 13%, respectively. However, it’s important to clarify that while Store 2’s growth percentage is similar to that of Stores 3 and 4, the key distinction lies not in these percentages, but in the actual growth amounts measured in US Dollars. This crucial aspect will be further explored in our upcoming detailed analysis.
While Store 2 is on a positive growth trajectory, there’s an evident opportunity to fortify its position by strategizing to match the sales amounts of its counterparts.
Customer Demographics and Value
The company’s overarching target demographic is the 40-60 age group, a segment known for its purchasing power and brand loyalty as shown in the below visualization. This age group forms the core customer base across all company stores.
However, when delving into the performance specifics, it becomes evident that Store 2 is underperforming in engaging this crucial demographic compared to its sister stores.
A closer look at customer value reveals intriguing patterns. The consistent presence of 2,131 low-value customers (smaller transactions in amount) across all stores and both years raises the question of whether there’s untapped potential among this segment. Concurrently, the identification of 119 high-value customers (larger transactions in amount) accentuates an opportunity for targeted strategies to cultivate and retain these valuable patrons.
In Store 2, a specific area of concern is the notably weak number of low-value customers compared to other stores. Addressing this issue is crucial for the store’s overall performance.
New Customer Acquisition
Store 2 consistently attracted fewer new customers each month compared to the more robust acquisition rate observed at Store 3. With respect to store 4, it is attracting the lowest number of customers per month; nevertheless, the impressive performance of store 4 suggests it is approaching market saturation, much faster than store 2.
The gap in new customer acquisition at Store 2 signals an urgency to investigate and enact strategies aimed at elevating foot traffic and expanding the customer base.
Monthly Purchase per Visiting Customer
Store 2’s performance in terms of monthly purchase per visiting customer presents a notable area for improvement. Store 2 records the lowest customer contribution among its counterparts. This finding is particularly concerning when juxtaposed with the stronger performance of Stores 3 and 4 in the same metric.
The need for improvement in monthly purchase per customer at Store 2 highlights potential areas for strategic intervention. Focusing on upselling and enhancing the overall in-store experience could be key in encouraging customers to spend more during each visit. Addressing this gap is crucial for Store 2 to not only align with the performance of its sister stores but also to optimize its revenue potential from every customer interaction.
Proposed Solutions Overview
Boosting Store 2’s market presence requires innovative and effective strategies. Here, a three-pronged approach is presented: an engaging social media campaign, impactful influencer collaborations, and a customer-enticing loyalty program. Each strategy is crafted to not only enhance brand visibility but also to deepen customer engagement and drive sales.
1. Social Media Campaign
- Objectives: Increase brand awareness on Instagram, Facebook, Twitter; drive online traffic to Store 2.
- Strategy: Post visually engaging content, use polls and quizzes, encourage user-generated content.
- Schedule: Regular, strategically timed posts; use a unique campaign hashtag for visibility and engagement.
2. Influencer Collaboration
- Criteria: Select local influencers aligned with Store 2’s image.
- Terms: Offer exclusive promotions for influencers’ followers; request content showcasing products.
- Performance: Track success using referral codes/links and engagement metrics.
3. Loyalty Program
- Components: Points system for purchases, exclusive discounts, personalized offers.
- Launch: Announce via social media, email, and in-store materials; use in-store signage for visibility.
- Staff Involvement: Train staff to engage customers about the program and provide technical support.

Recommendations
Elevating Store 2’s success hinges on a mix of dynamic strategies: targeted seasonal marketing, establishing a customer feedback loop, forming strategic local partnerships, leveraging data-driven decision-making, and enhancing the in-store experience. These approaches aim to boost sales, expand the customer base, and improve overall satisfaction. This segment delves into how each method can effectively transform Store 2’s business approach.
1. Seasonal Marketing Strategies
Develop seasonal marketing campaigns to capitalize on peak shopping periods and mitigate sales fluctuations. Tailor promotions and incentives to match customer behaviours during different quarters.
2. Customer Feedback Loop
Establish a robust feedback loop to gather insights from customers on their seasonal preferences and expectations. Leverage this feedback to tailor products and services to seasonal demands.
3. Collaborative Partnerships
Explore partnerships with local businesses and influencers to create synergies that drive foot traffic and broaden the customer base.
4. Data-Driven Decision Making
Invest in data analytics tools to gain deeper insights into customer behavior. Utilize this data to make informed decisions on product placement, pricing, and marketing strategies.
5. In-Store Experience Enhancement
Investigate and enhance the in-store experience, considering factors such as store layout, ambiance, and product presentation. An inviting and immersive environment can positively impact customer perception and satisfaction.


by Leila Choueiri | May 7, 2020 | Visualization
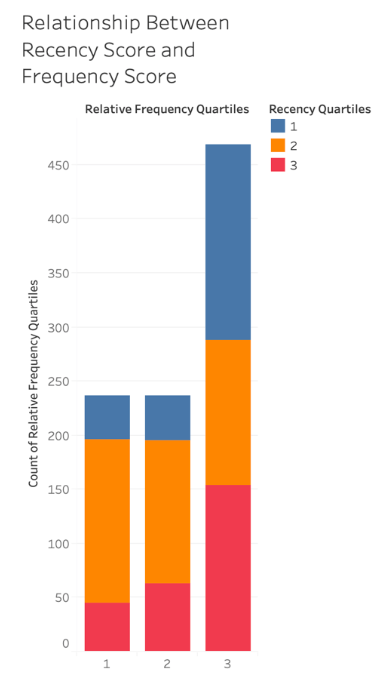
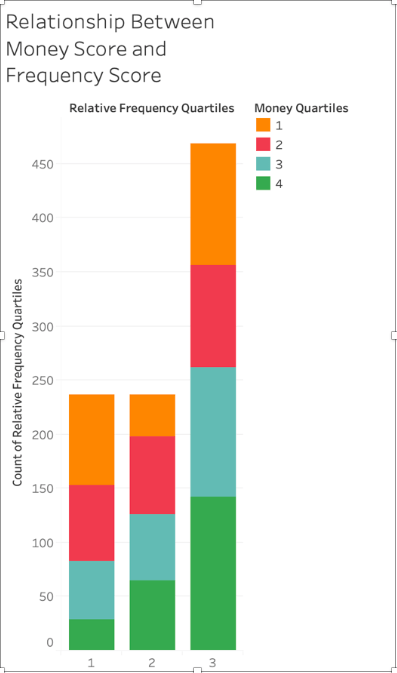
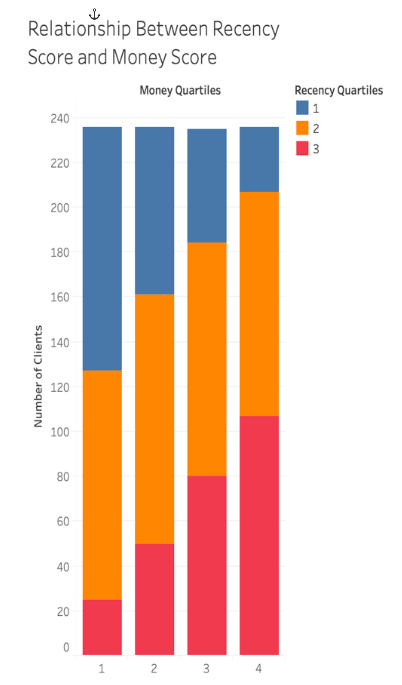
While working on the Sales Call Cycle of a private distributor in Lebanon, we generated the following graph to analyze our clients’ contribution to total revenues. As we observe in the diagram depicting the relationship between the recency score and money score, the clients with higher money scores also have a higher percentage of recency. Those with recency scores of 2, always appear in every money score band. This is probably due to three reasons, in the past year business has not been optimal and only the larger institutions can order consistently, this could also be why this is also the case for why clients with money scores of 3 and 4 most commonly order frequently. The second probable reason is that company keeps a closer eye on larger institutions, so when management realizes that a large client has not ordered in a while, they tend to follow up and get an order. The final reason is that smaller companies tend to run out of business at a much higher rate than their larger counterparts. These businesses might either have ordered once and ran out of work or couldn’t pay their fees on time, and were dropped as a result. For the relationship between recency scores and frequency scores, it makes logical sense that those who have a high frequency have a higher probability of being more frequent. The amount of low recency and high frequency clients that exist is cause for concern. These are frequent clients that haven’t ordered in a while, so there is something unusual about their behavior. For this reason, the company allocated a new sales call cycle to trigger those businesses.
by Rosa Azar | May 4, 2020 | Visualization
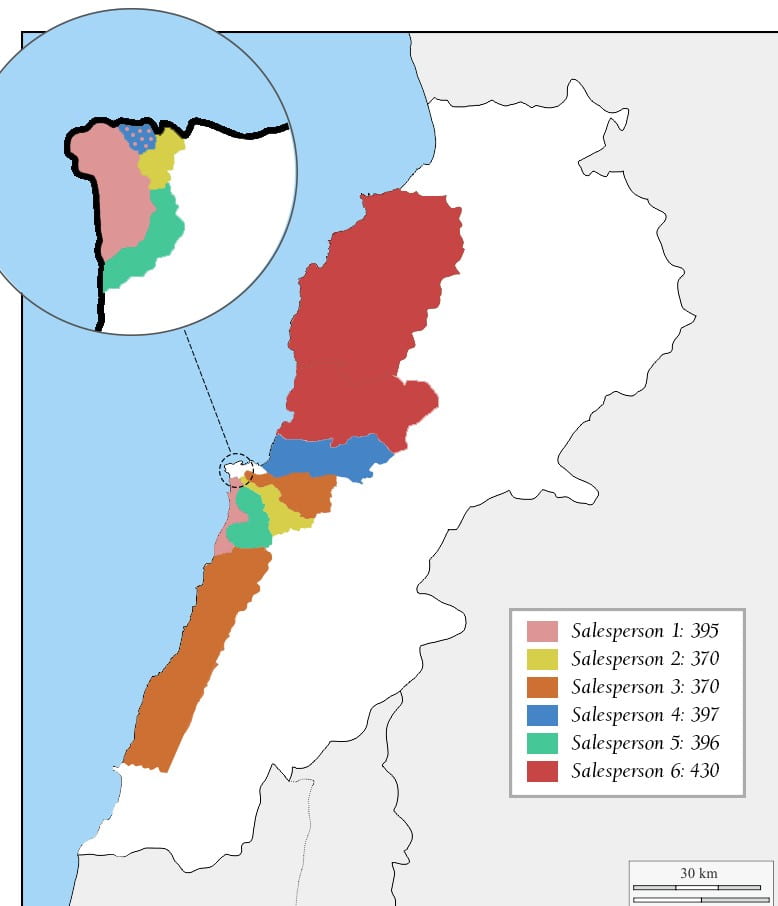
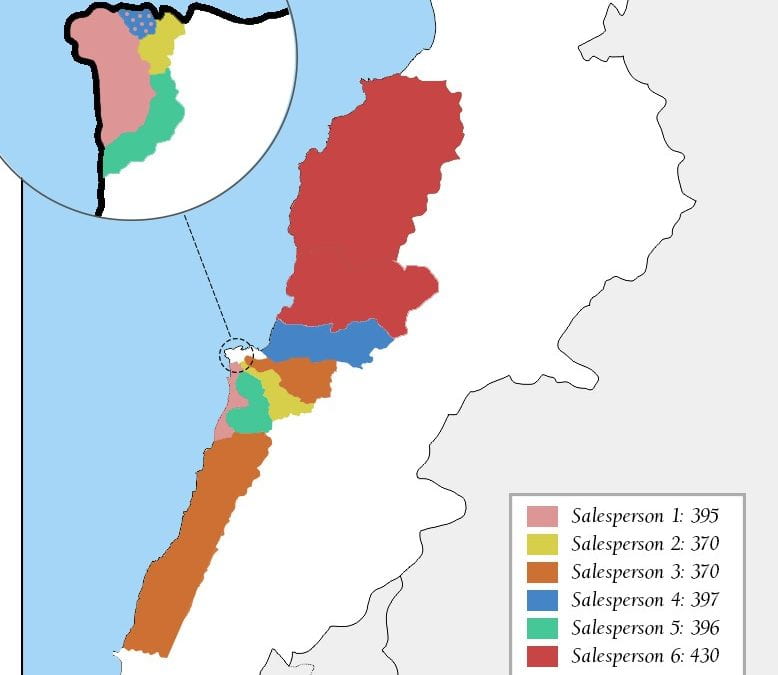
As part of the final project, it was interesting to see the regional allocation of the salesperson. The first visual shows how many visits to the client should be made for each region.

The second visual shows the allocation of the salesperson according to regions as well as the number of visits required. With 2,358 visits to make and with five clients per day, we can say that we will need six salespeople (2358/75) and some will have to see more than five clients per day on some days. This just means at least one day a week they will have to see one or two more existing customers rather than meet with new ones.