Salesperson Regional Allocation
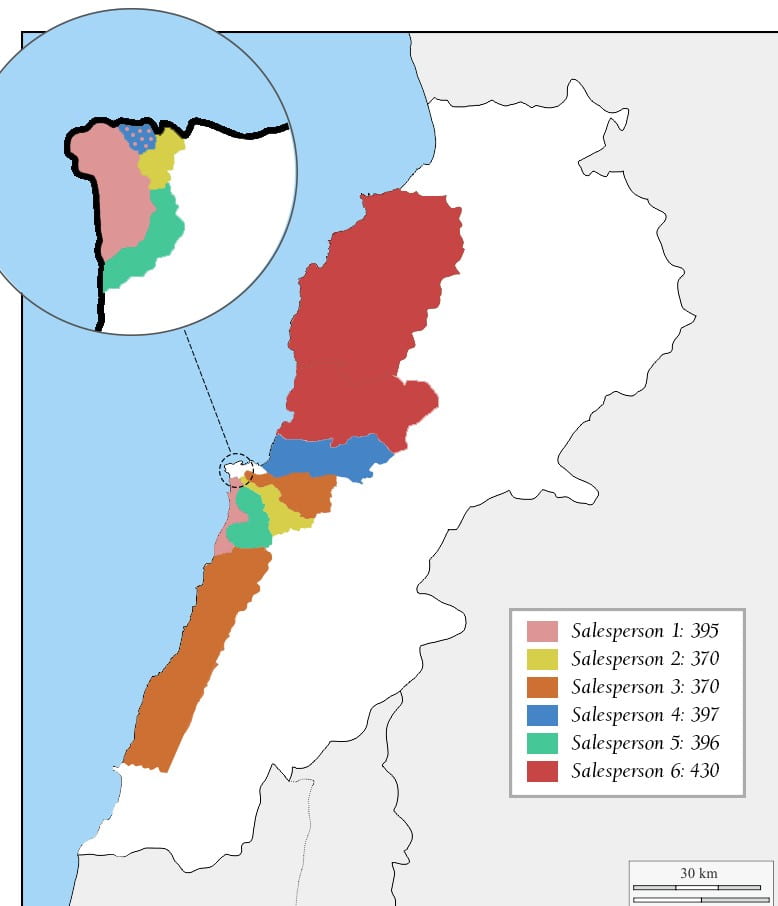
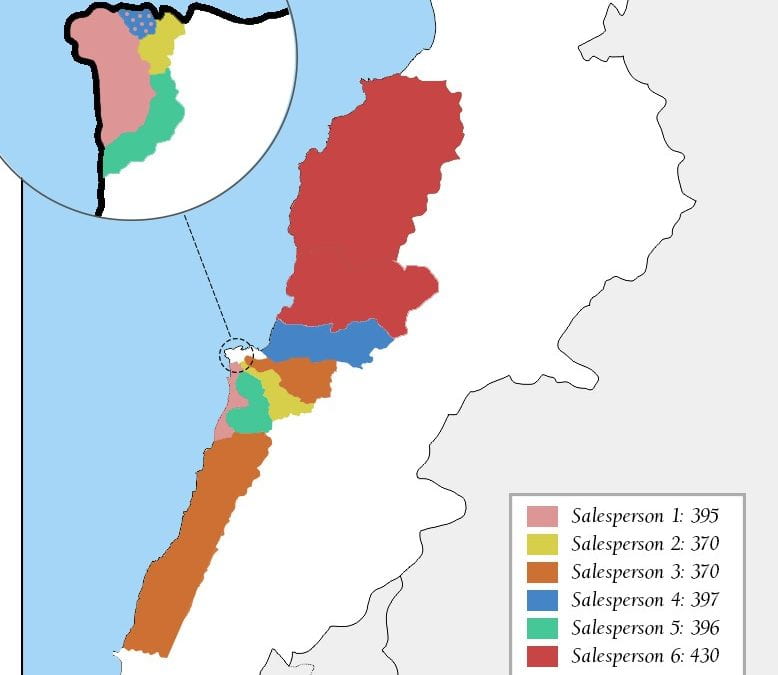
As part of the final project, it was interesting to see the regional allocation of the salesperson. The first visual shows how many visits to the client should be made for each region.

The second visual shows the allocation of the salesperson according to regions as well as the number of visits required. With 2,358 visits to make and with five clients per day, we can say that we will need six salespeople (2358/75) and some will have to see more than five clients per day on some days. This just means at least one day a week they will have to see one or two more existing customers rather than meet with new ones.