Sweet Insights: Understanding ChocoStory Through Seven Years of Data
How Data Visualization Revealed the Real Issues Behind the Instability in the Performance of ChocoStory
Launched in 2018 in Verdun (Beirut), ChocoStory quickly gained popularity: a prime location, strong foot traffic, and the owners’ network. The store combines walk-in chocolate items products with experiences like chocolate workshops and a museum.
However, when we first examined ChocoStory’s performance, one thing was immediately clear: growth wasn’t steady. Sales would surge, only to drop sharply right after, and this pattern kept repeating every year.
That raised a key question. Why did the business grow in some periods but lose momentum just as quickly? This pointed to structural issues rather than simple seasonality.
Our approach is simple but powerful: use data to understand how market dynamics, customer preferences, and internal costs shape ChocoStory’s inconsistent performance. We used a series of visuals that helped us walk through the timeline and understand what was affecting the numbers.
- Understanding the Swings in Performance
The first step was mapping both sales and net profit from their opening in 2018 until the present.
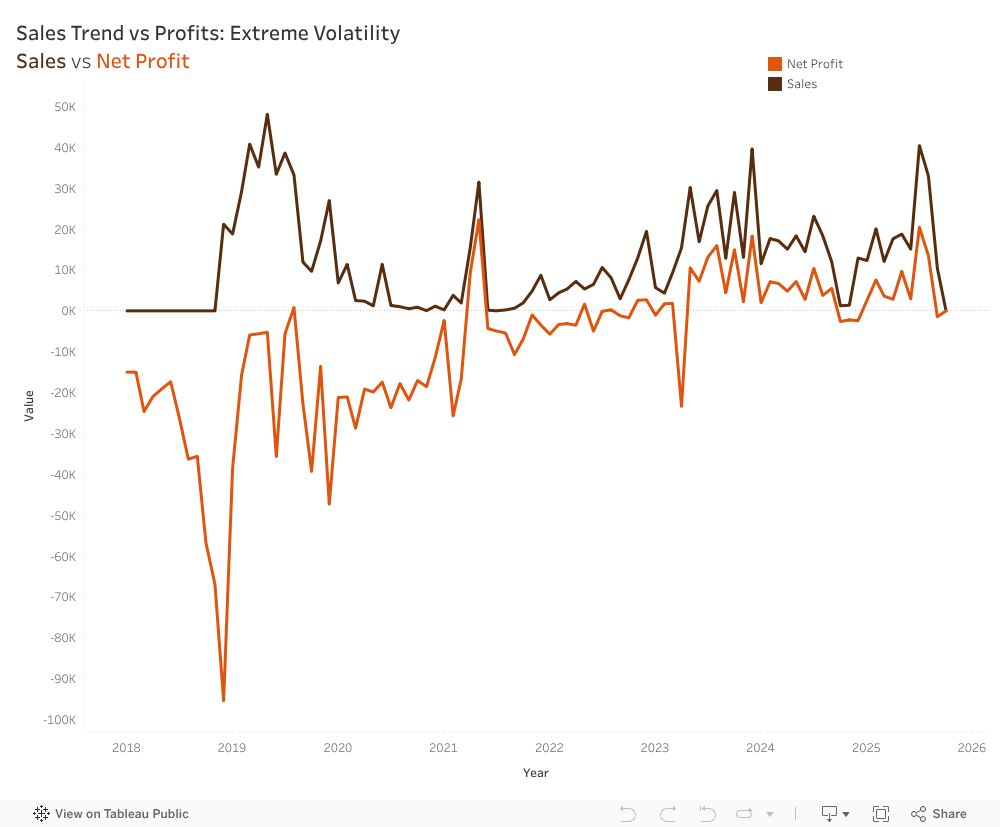
This revealed a cycle of volatility that repeats year after year, showing how heavily the business relied on peak seasons. Net profits follow the exact same pattern as Sales, almost like a shadow, just consistently lower. Profitability relied entirely on sales peaks rather than efficient operations, meaning any drop in demand immediately pushed the company into a loss.
- How External Events Influenced the Numbers
Looking across the years, it became clear that ChocoStory’s performance was closely tied to what was happening around it.
- The early period was steady, but the situation changed fast.
- Covid-19: Foot traffic reliance backfires; digital gap hurts.
- Port Explosion: Supply chain chaos; no quick adaptation.
- Relocation: Short-term dip. strong rebound; smart move.
- War 2023: Instability returns; resilience tested.
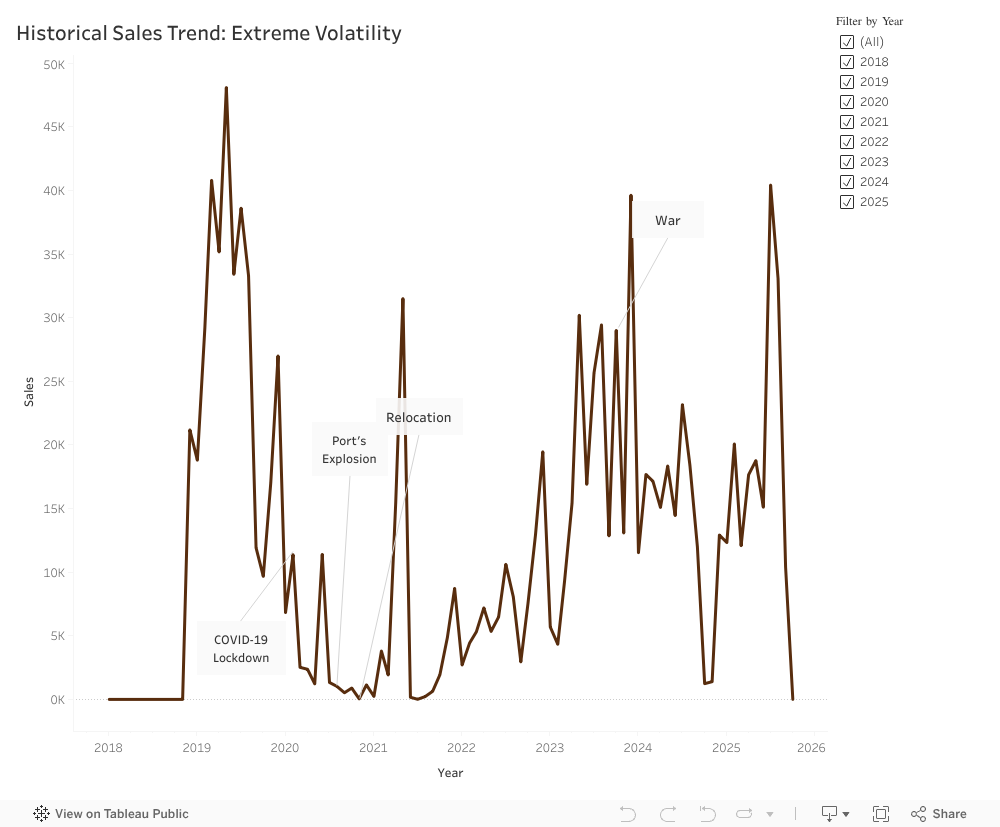
Disruptions will happen, but their impact depends on how equipped the business is to handle them. Too often, ChocoStory reacted slowly or only partially.
- What the Cost Structure Revealed
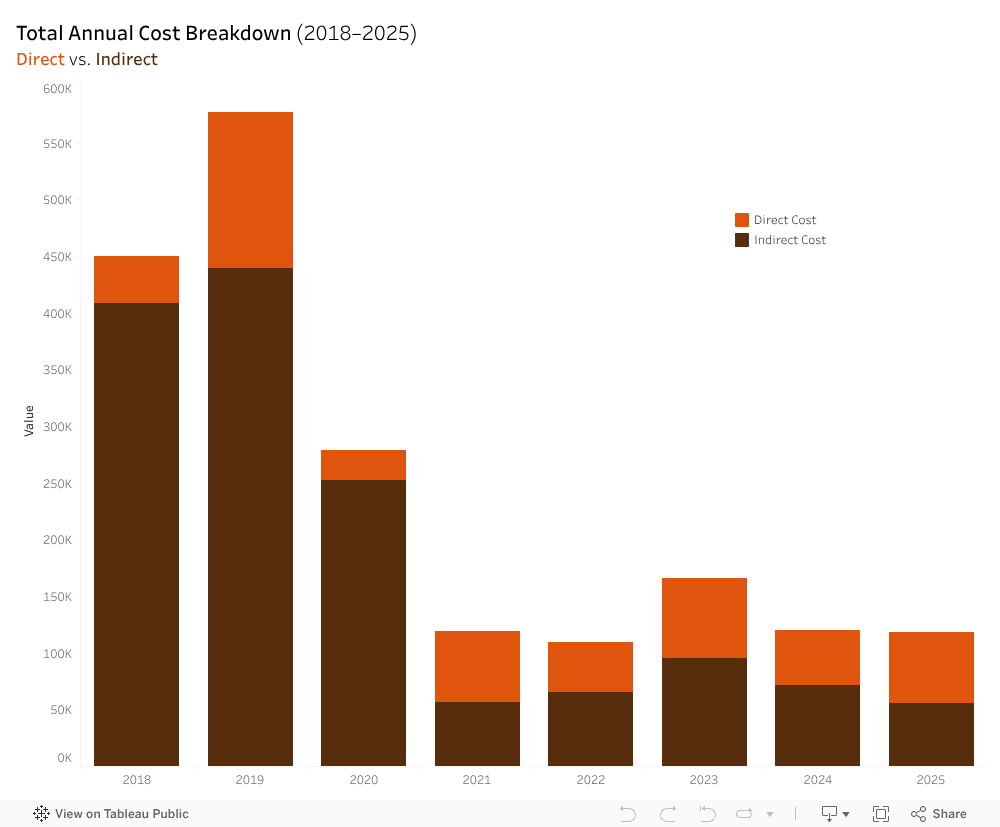
At first glance, ChocoStory’s expenses looked normal, but when they were broken down into the direct and indirect costs stacked barchart, a different reality emerged. Before 2021, direct costs (workshop materials, chocolate ingredients, packaging, etc.) were relatively stable. Indirect costs, however (rent, utilities, electricity, etc.), fluctuated heavily, with not enough revenues to break even.

The total expenses vs net profit line chart showcased two lines behaving in a symmetrical pattern. When expenses rose, profits dropped. Likewise, when expenses fell, profits increased. This approximate symmetry highlighted a deeper issue: ChocoStory had almost no safety margin. With indirect costs absorbing such a large share of total expenses, the business was operating with a net profit loss. It was only after the 2021 relocation that the gap between the lines narrowed down, and ChocoStory began breaking even. However, they were unable to sustain an upward profit trend beyond break even.
4. Rethinking the Product Portfolio
ChocoStory offers a wide range of chocolate items. There are 206 products, compared to just 28 service offerings.

At first glance, this creates the impression of a product-led business, assuming they generate enough profits compared to operational weight. Yet, comparing the revenue generated by each proves otherwise:

Based on that chart, it becomes clear that products generated around LBP 4.5B only, while services reach LBP 11B. The highest revenue contributors were the services (workshops and museum) indicating that ChocoStory operates more as an experience-driven destination and less like a traditional chocolate shop.
- Visibility and Online Presence
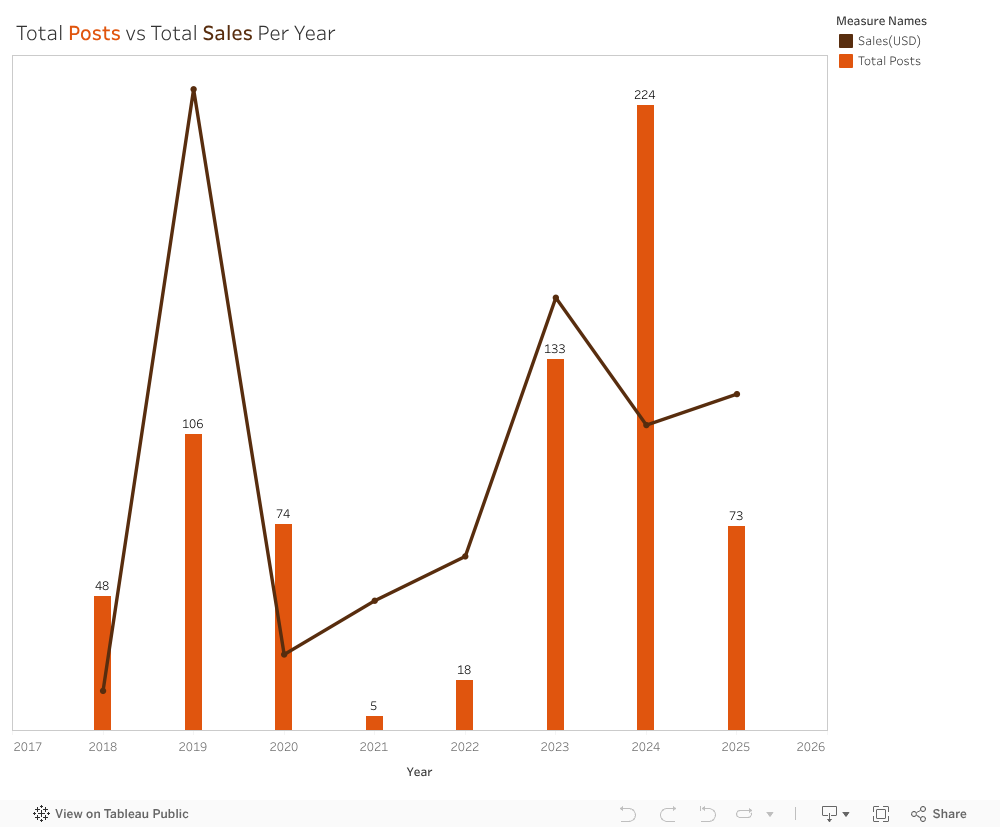
We reviewed the platforms because visibility on social media affects how easily customers find and engage with the business. We looked at posting activity across Instagram, Facebook, and Threads from 2018 to 2025 and compared yearly posts with yearly sales. Activity varied widely. In 2021, only five posts were published during the relocation period, which aligned with the lowest sales in the dataset. Posting increased again in 2023 and peaked in 2024, but sales did not return to 2019 levels, when posting was more moderate. We also noted that ChocoStory was not active on TikTok, despite it being a major discovery platform for local experiences.
Our wider analysis showed a clear gap in engagement by content type. A workshop-and-museum video reached more than 784,000 views, while a seasonal product post received 37 likes. This showed that experience-focused content resonated far more than product photos. Taken together, the results suggest that visibility shifted across the years, and that content type mattered more than posting frequency.
A Clearer Path Forward
ChocoStory’s main challenge isn’t the chocolate, it’s not understanding its customers. Our team recommended concentrating on the audiences that naturally fit the workshop experience, especially children between 4 and 14. Schools and camps can create a steady flow of visits throughout the year. Simplifying the product list can reduce operational strain and help redirect attention to the experiences that matter most.
During our visit, the ChocoStory team confirmed that these insights aligned with their own observations. They plan to reduce the number of products, strengthen communication around the workshops, and develop a more structured marketing plan.
This analysis showed how much can be learned from placing data into clear visuals. Trends that look confusing in raw numbers become understandable once they are visualized. ChocoStory faced several disruptions from outside events, but many challenges also came from how the business was structured. With a clearer view of what drives performance, the company can now build on its strengths and create more stable growth.