by Mohammad Radwan El Dana | May 5, 2020 | Visualization
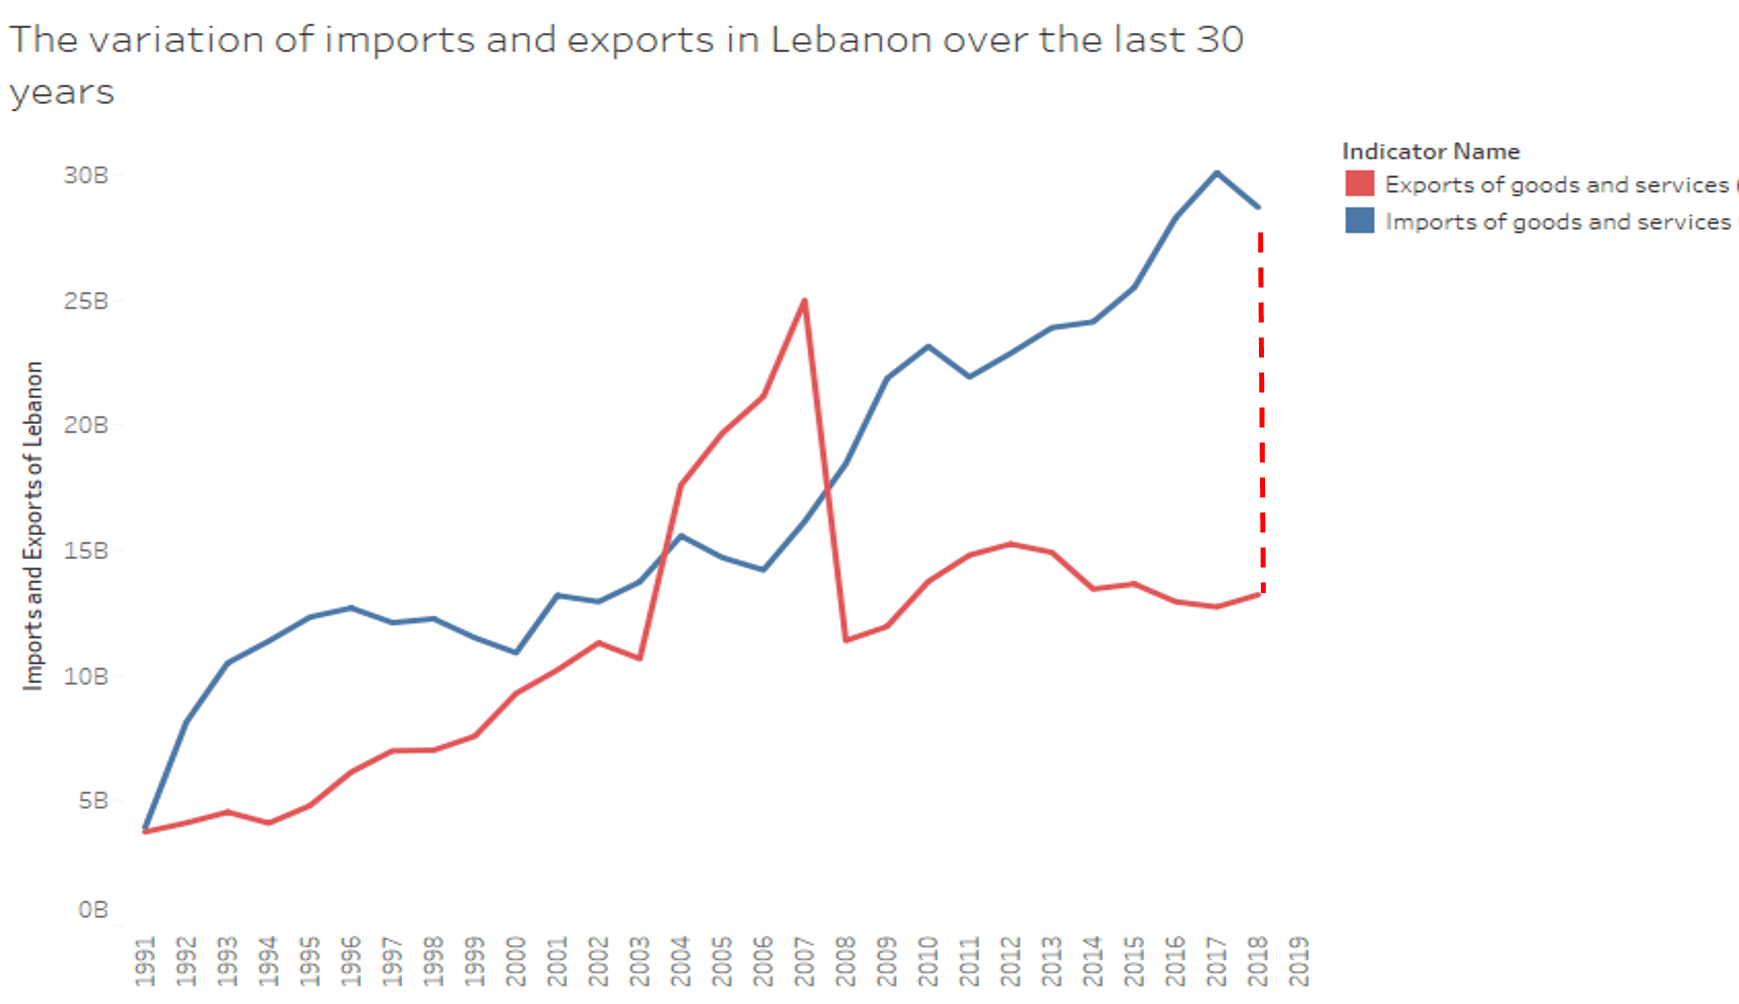
The devaluation in the Lebanese currency has risen as Lebanon is suffering from the most severe economic problem since the civil war. As we know, Lebanon has huge depts. which forms over 150% of the national GDP, the third highest in the world. Adding to it, the gap between the exports and the imports of good and services in Lebanon which is widening in the recent years. Knowing that the Central Bank is providing 85% dollars for commodity imports, the US dollar is becoming scarce in the market. I can say that boosting the current economic downturn would require us to BUY Lebanese products.

by Ghufran Haidar | May 5, 2020 | Dashboard, Visualization
The following dashboard gives a complete image of the vital statistics in Lebanon starting year 1999 till the year 2018. It can be seen that the number of births has increased over the past few years by approximately 74 percent (top visual). However, during the same period, the number of deaths has increased slightly. The drastic increase in the number of births and yet slight increase in death rate call for further analysis of factors contributing to this improvement such as economic indicators, health care system and other relevant factors. What is worth noting, however, is that the number of divorces have doubled during the same time period. In comparison, the number of marriages has slightly increased between the years 1999 – 2018.
The following dashboard further shows a break down of these four variables (births, deaths, marriages, and divorces) by city and year. Beirut, the capital of Lebanon, has maintained the lowest number of births throughout the years (1999 – 2018). Interestingly, however, North Lebanon has had the highest number of vitals across all four variables throughout the same time period. Bekaa, on the other hand, had a relatively high marriage and divorce rate.
On a separate note, Lebanon has maintained an equal number of births and deaths across both genders throughout the same period (1999 – 2018).
Note that the dashboard is highly interactive. To maximize your experience, please view in full-screen and use filters by year and city as well as highlight by city.

by Ahmad Tekriti | May 5, 2020 | Visualization
My morning dark coffee was mixed lately with the sorrowful news regarding the collapse of the Lebanese economy. People are losing their jobs, their purchasing power, and even their hope to rise again. I felt for a couple of times that we are powerless and it’s the time to accept that hope is only a way to package the melancholic truth.
In my attempt to find any light inside the deep dark hole that we are inside, I remembered the metaphor of Lebanese phoenix that I heard about during the 2006 July war. Phoenix is the bird who can arise from the aches according to Greek mythology. Beirut, the capital of the old country, like the phoenix, was rebuilt more than seven times according to legend. So, to strengthen the glimpse of hope with actual reality, I searched for a recent stage where Lebanon was rising. I surprised when I found that between 1950 and 1974, Lebanon was in a golden stage with a GPD per capita is greater than many developed counties nowadays! So, my current concern becomes while drinking my morning coffee is how we can make the Lebanese phoenix rise again?
Note: I created this graph using tableau software based on the data from Maddison Project Database 2018.
by Rosa Azar | May 4, 2020 | Visualization
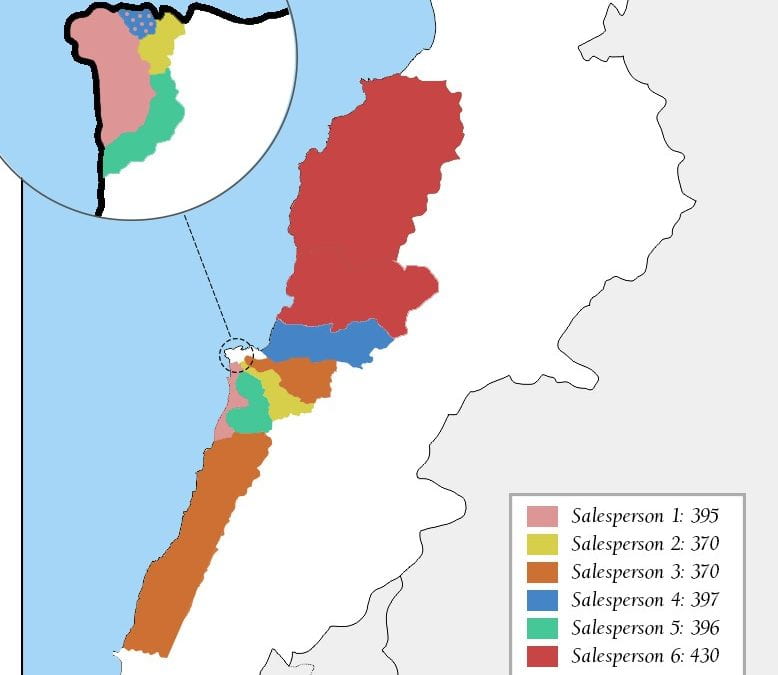
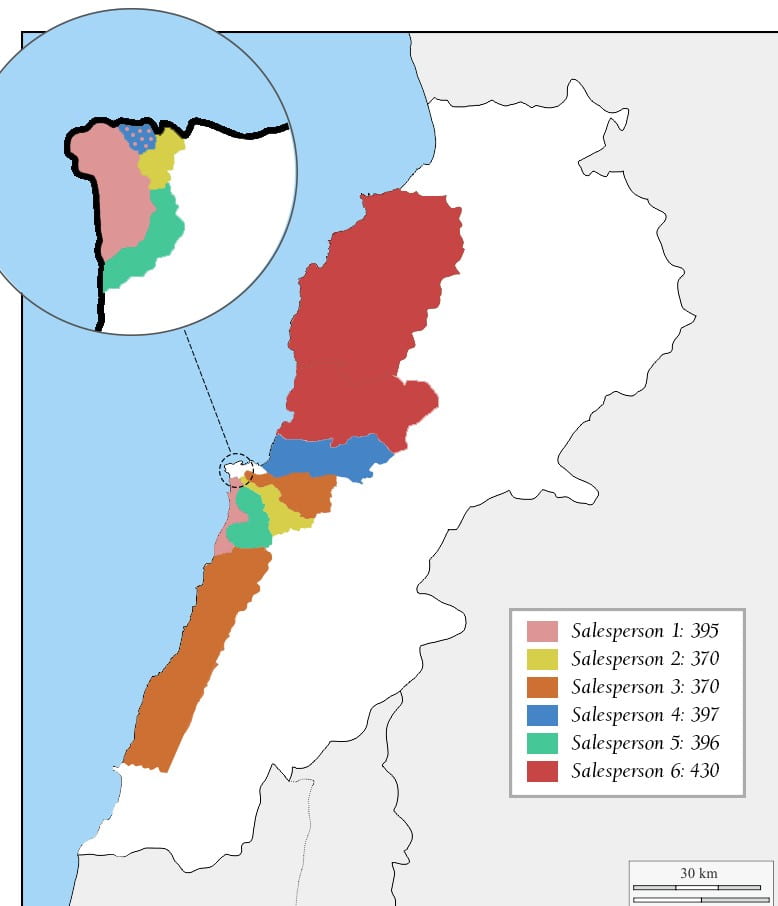
As part of the final project, it was interesting to see the regional allocation of the salesperson. The first visual shows how many visits to the client should be made for each region.

The second visual shows the allocation of the salesperson according to regions as well as the number of visits required. With 2,358 visits to make and with five clients per day, we can say that we will need six salespeople (2358/75) and some will have to see more than five clients per day on some days. This just means at least one day a week they will have to see one or two more existing customers rather than meet with new ones.
by Tarek El khayat | May 4, 2020 | Visualization
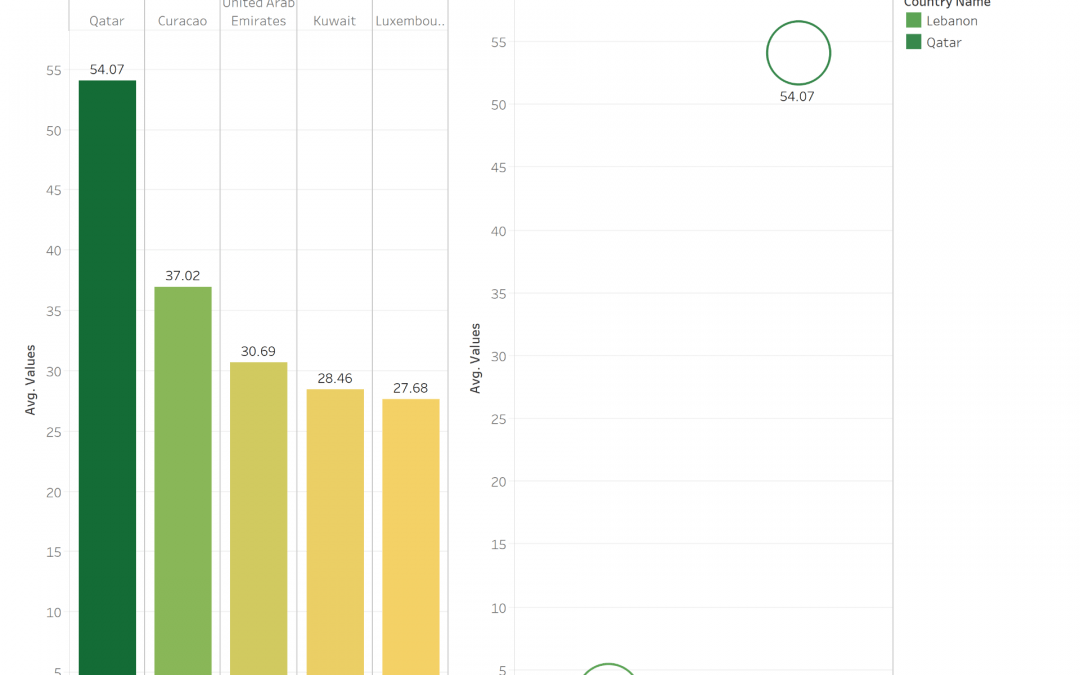
CO2 emission is one of the important factor that is destroying our planet and causing diseases, global warming …
The Graph shows the Top 5 countries with higher CO2 Emission and shows that QATAR take the lead in the world and the Arab region