by cse13 | Nov 21, 2025 | Dashboard, Visualization
Samer is a 58-year-old shop owner in Baabda.
He has diabetes and hypertension, and like many others living with chronic conditions, he spent the early months of the pandemic in quiet fear. He followed every guideline, avoided unnecessary outings, and even closed his shop early just to stay safe.
As I began working with data on chronic disease prevalence across Lebanon, I kept thinking about people like Samer; individuals whose health risks existed long before COVID-19 arrived. It made me wonder:
Do districts with more people like Samer also end up reporting more COVID-19 cases?
At first, the logic seemed simple:
more chronic conditions should mean higher vulnerability, and higher vulnerability should mean more cases.
But once I visualized the data, the story turned out to be more complicated than that.
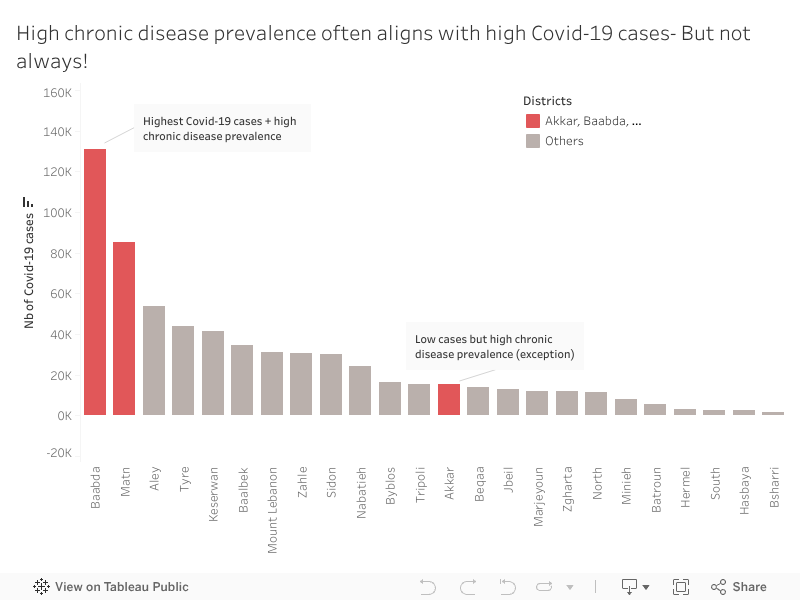
When we look at Baabda, Samer’s home district, the pattern is exactly what we expect.
Baabda and Matn have a high chronic disease prevalence which explains why they recorded the highest number of COVID-19 cases. These districts appear in red in the visualization because they represent the expected relationship:
high chronic disease prevalence accompanied by high COVID-19 case counts.
Most other districts show the same downward pattern: fewer chronic illnesses tend to come with fewer reported infections.
It’s the straightforward story we anticipate.
Until one district breaks it.
While exploring the data, Akkar immediately stood out.
Unlike Baabda or Matn, Akkar shows relatively low COVID-19 case numbers despite having a high prevalence of chronic diseases.
At first glance, this shouldn’t happen. But Akkar tells a different health story.
Akkar is less dense, has fewer specialized medical centers, and mobility patterns differ.
But an important social factor also played a role: many residents initially believed COVID-19 was “just a flu”, something exaggerated, not dangerous. Because of that, people were far less likely to get tested, especially when symptoms were mild or unclear.
So, the low case numbers may not reflect low infections, they reflect low detection.
Akkar shows us that vulnerability isn’t only biological or medical. Sometimes it’s cultural, structural, or tied to trust in the health system itself.
That was the moment when the visualization stopped being merely a chart and became a real narrative.
People like Samer live in districts where both chronic disease and COVID-19 risks were high and highly visible.
But in Akkar, people with the same medical vulnerabilities faced a quieter, more hidden risk, one that doesn’t always show up in official numbers but still shapes their health outcomes.
This is the heart of the story: patterns tell us what usually happens, but exceptions reveal what we might be missing.
Understanding these mismatches matters.
High-case, high-risk districts like Baabda and Matn may need more hospital capacity and emergency planning.
High-risk, low-case districts like Akkar may need earlier outreach, awareness campaigns, and accessible screening, especially in communities that may initially resist testing.
If we focus only on case counts, we risk overlooking communities that need protection long before outbreaks become visible.
When I think back to Samer, closing his shop early every night, hoping to stay healthy, I’m reminded that data becomes meaningful when it reflects real people.
In public health, the story doesn’t live only in the trend.
It lives in the exception.
Because that’s where we discover the next challenge before it appears.

by tmt19 | Nov 20, 2025 | Dashboard, Team Project, Visualization
Launching La Table is more than opening a restaurant, it’s making a meaningful, long-term investment. With limited savings, choosing the wrong location would turn a dream into a risk. To avoid guessing, I turned to data.
The goal was simple: find a town in Lebanon where visitors (locals and tourists) already show strong interest, yet the restaurant market remains underserved.
Lebanon’s tourism and investment patterns often move in opposite directions. Some towns attract visitors but receive no development, while others receive projects despite having little demand.
For a new restaurant, this imbalance makes it difficult to know where genuine opportunity lies. I needed a location that is not saturated or speculative, but strategically overlooked.
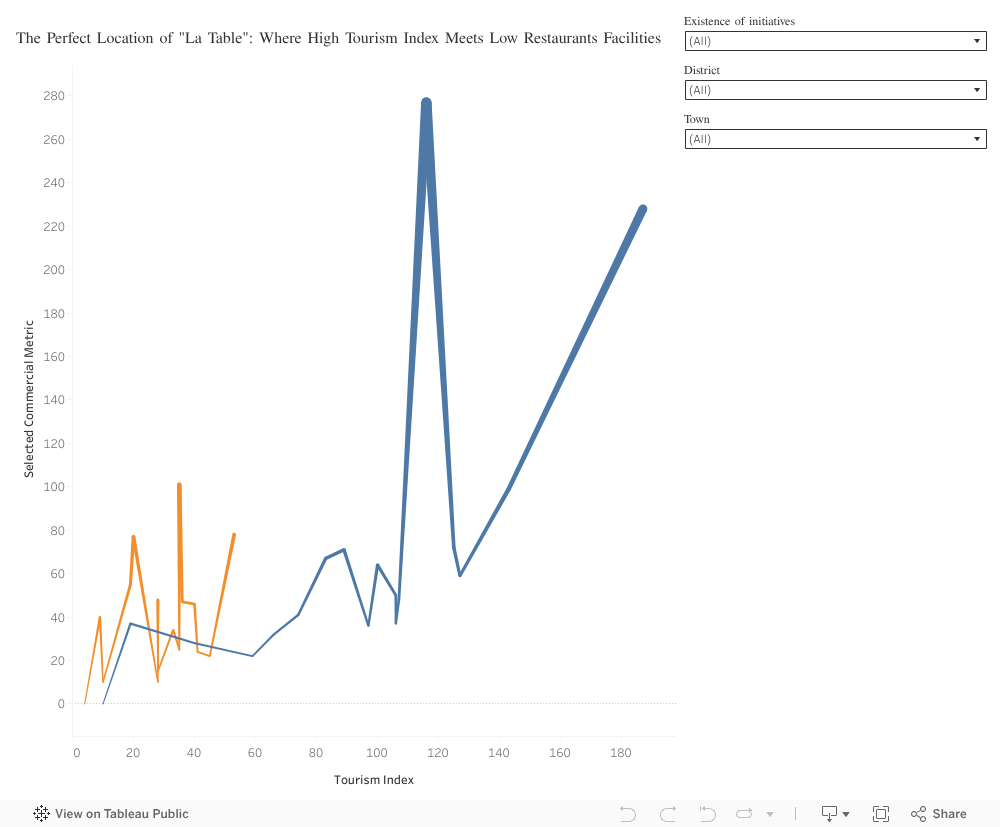
Step 1: Scanning the Chaos for Opportunity – Lebanon as a whole
The national view shows two categories:
High-tourism towns with no initiatives (Blue): attractive but saturated with existing restaurants.
Funded towns with low tourism (Orange): received investments but struggle with attracting visitors.
We’re looking for a true blue diamond: a high-potential (human intuition), high-traffic location (tourism index), with unserved demand (number of restaurants, 0 project initiated).
Step 2: The first zoom – Targeting Zgharta
We must narrow the focus from the whole country to a high-potential region. We start by targeting the beautiful Zgharta District.
Safe option: a district away from saturation (low competition) yet rich in natural beauty and tourism interest (mid to high). It becomes the logical next step for deeper exploration.
(Action for Viewer: Please use the District filter and select Zgharta District.)
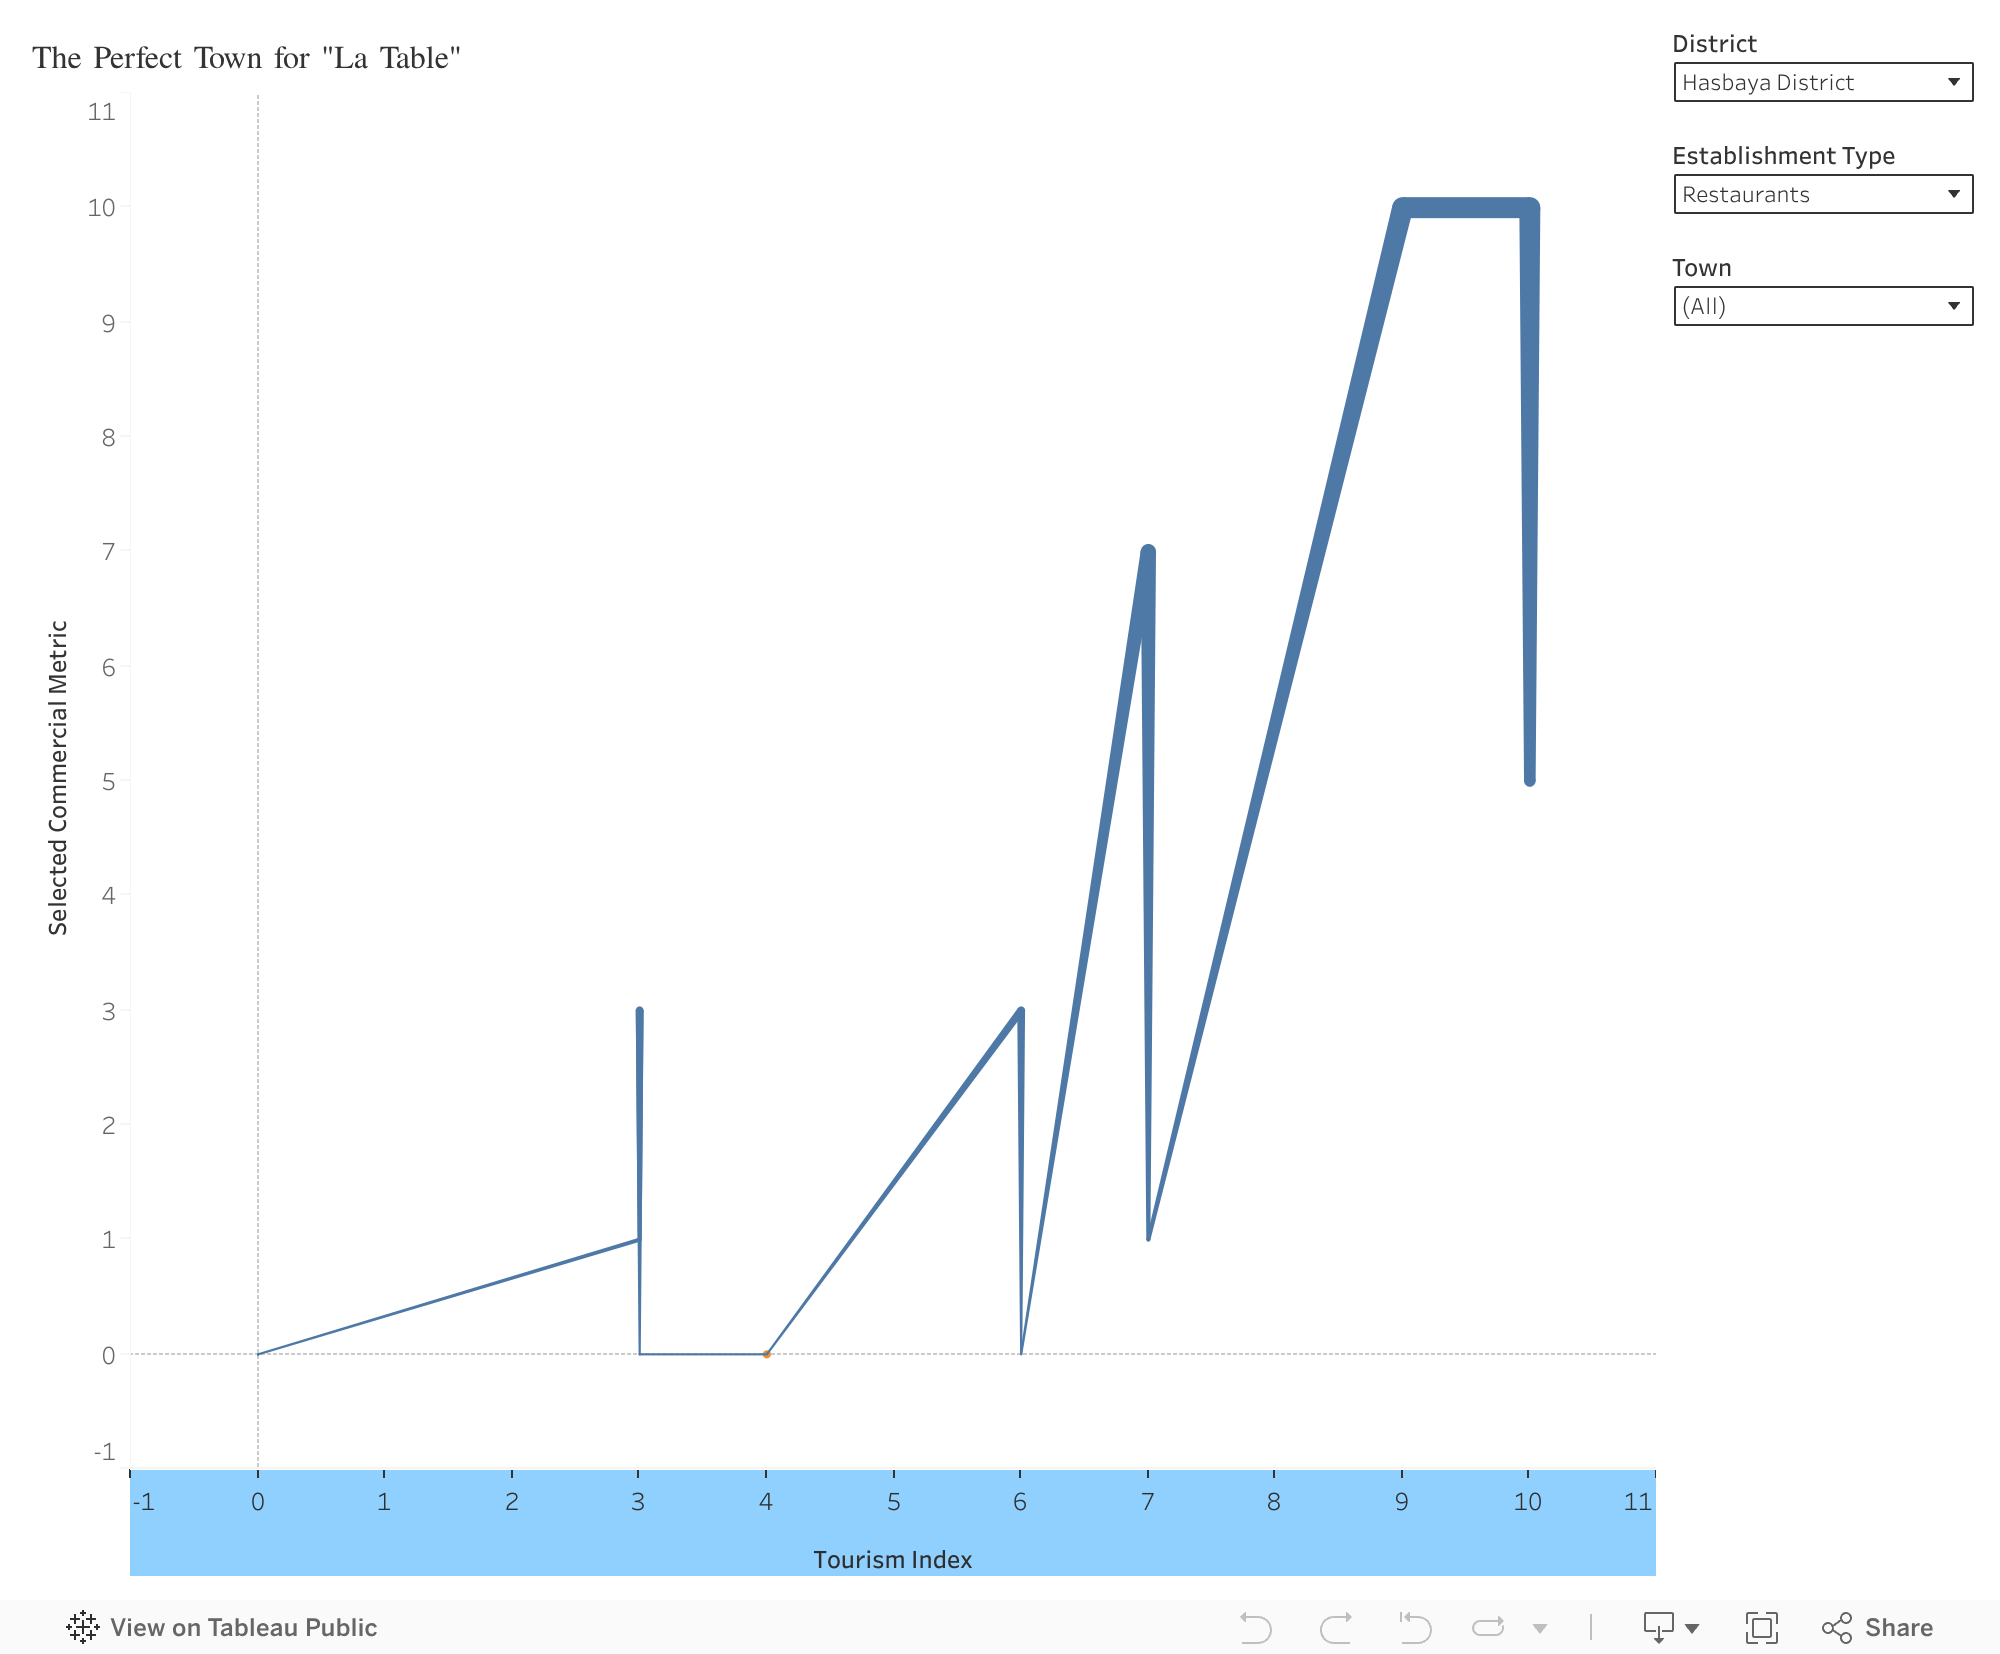
Step 3: The second zoom – Finding the Restaurant Gap
One town rises above the rest:
Beit Obeid, Zgharta District
- High tourism demand (index: 9).
- Low supply: few restaurants exist (1 restaurant), minimal competition.
- No recent initiatives, meaning the opportunity remains untouched.
Visitors are already coming, but the market has not responded. This is exactly the type of gap a new restaurant should fill.
In Beit Obeid, high demand, low competition, and authentic natural beauty come together, making it a place where La Table can truly belong and elevate the town’s charm. By moving from a national overview to a focused district analysis, the data revealed a location where potential and opportunity meet.
But beyond numbers, choosing Beit Obeid reflects vision, intuition, and respect for place.
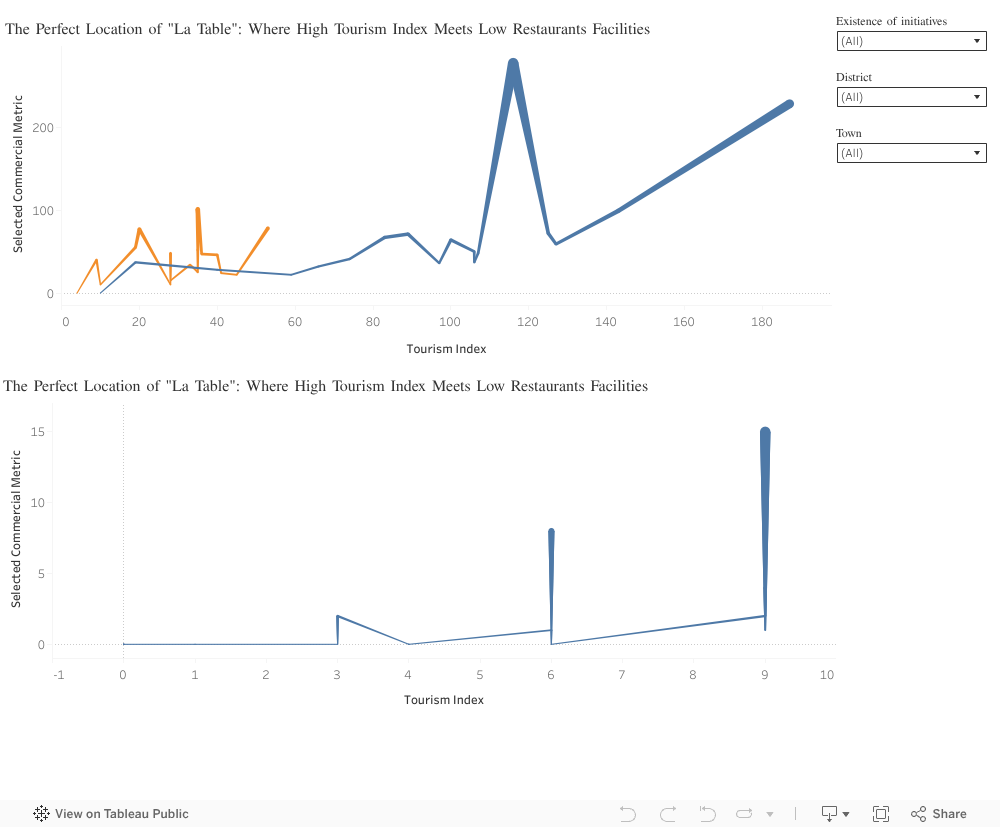
Overall view:

by rmg18 | Nov 20, 2025 | Uncategorized
 Lebanon’s landscape is full of cultural, historical, and natural assets, yet tourism development across the country remains uneven. Using the UNDP Tourism Readiness dataset (1,136 towns across 25 districts), this analysis uncovers where Lebanon’s hidden tourism opportunities are and which regions lack the infrastructure to support them.
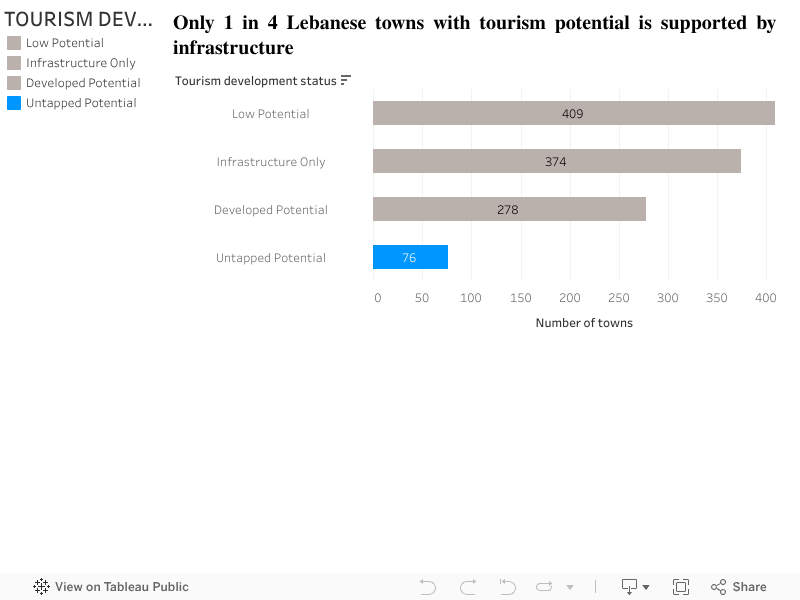
Tourism Potential Exists, But Not All Towns Are Developed
To understand tourism readiness, every town can be classified into one of four groups:
- Developed Potential: Towns with both potential and infrastructure
- Untapped Potential: Towns with potential but no infrastructure
- Infrastructure Only: Towns with infrastructure but no identified potential
- Low Potential: Towns with neither
Right away, a key insight emerges:
A considerable number of Lebanese towns have meaningful tourism potential but lack the infrastructure required to activate it.
This simple breakdown highlights that tourism potential is widespread across the country, but not always supported by visitor services such as guest houses, cafés, or restaurants.
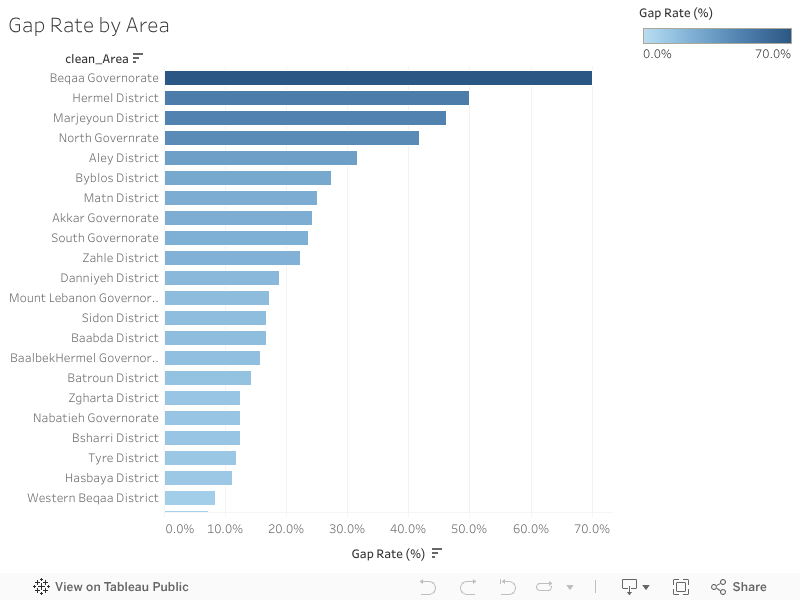
Some areas have much larger gaps than others
When looking at infrastructure gaps by area, the differences become clearer. Some districts have potential but very little tourism infrastructure to go with it.
In particular,
show some of the highest gap rates. These places have attractions and natural assets, but not enough facilities to support tourism activity. Meanwhile, districts like Mount Lebanon and Byblos are more developed and have infrastructure that aligns better with their tourism activity.
This chart makes it easier to see which areas are lagging behind and where new investment could make a real difference.
What this means for tourism planning
- Putting the insights together, a simple pattern appears:
- Many towns across Lebanon do have tourism potential
- But a noticeable share of them don’t have the infrastructure to support visitors
- The largest gaps show up in specific districts, not everywhere
- Improving basic services in these places could unlock new opportunities
Instead of focusing only on areas that are already popular, these findings suggest that Lebanon has several underdeveloped regions that could become strong tourism spots if they receive proper attention.
Conclusion
Lebanon already has the natural and cultural foundations for tourism. The challenge isn’t a lack of potential, it’s the uneven distribution of infrastructure.
By identifying where the gaps are, the data gives a clear starting point for planners, municipalities, and anyone interested in local development. Investing in infrastructure in high-potential but underserved towns could help bring more balance to Lebanon’s tourism map and open opportunities in regions that are currently overlooked.