What if the hours children spend scrolling every day are quietly shaping how anxious they feel — and even how well they perform in school?
Using a cross-sectional dataset of Lebanese students aged 8–14, this analysis explores the relationship between daily screen time, anxiety, gender, outdoor play, and academic performance.
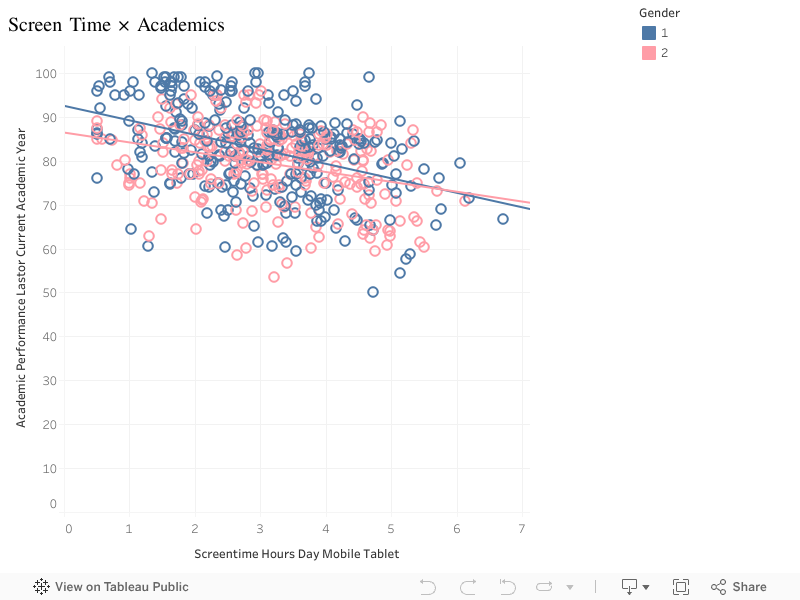
1. How Much Screen Time Do Children Get?
Most students spend 2–4 hours/day on mobile or tablet devices, but a noticeable group reaches 5–7 hours. This suggests a segment exposed to high digital consumption.
2. Anxiety Levels Are Widely Spread
Anxiety scores range from 10 to 100, with most students clustering around 40–55. A significant minority shows severe anxiety.
3. More Screen Time = More Anxiety
A clear positive correlation emerges:
As screen time increases, anxiety rises across both boys and girls.
This relationship remains strong even when controlling for age.
4. Gender Differences Are Small but Present: Girls show slightly higher anxiety and slightly higher screen time. But the trend lines for both genders are almost identical — meaning screen time, not gender, is the main driver.
5. Anxiety Reduces Academic Performance: Students with higher anxiety tend to have lower academic scores, with a noticeable decline past anxiety scores of 60.
6. Screen Time Reduces Academic Performance (Slightly): More screen time is associated with lower grades, although the effect is weaker compared to anxiety.
7. Outdoor Play Offers a Small Protective Effect: More outdoor playing hours slightly reduce anxiety, suggesting a helpful intervention.
Conclusion
Across the dataset, a consistent pattern emerges:
More screen time → higher anxiety → weaker academic performance.
Encouraging even small reductions in daily screen use — or adding more outdoor time — can help protect children’s mental well-being.
If you lived in Lebanon during the summer of 2015, you remember the smell before you remember the headlines. The waste crisis seeped into every street, every balcony, every bus ride. Mountains of uncollected trash became part of the landscape, and for a moment it felt as if the country itself had stopped breathing.
Nearly a decade later, that memory hasn’t faded, not because it’s distant, but because it never fully left. Today, we still step out for a walk and brace ourselves for the familiar sting of a garbage pile baking under the sun. We navigate around dumped furniture abandoned on sidewalks, pass corners where torn bags reveal forgotten clothes, and catch the lingering scent of waste that has become an unwelcome companion in many public spaces.
Lebanon’s waste crisis did not begin in 2015, and it certainly didn’t end there. But that moment marked a turning point, a reminder of how fragile our systems are and how urgently we need solutions that last.
The waste problem goes back way before 2015, and as a response to it, arcenciel started working towards sustainable practices in Lebanon that led to the creation of its Environmental Program.
In a country where waste is burned in the open, dumped along riverbeds, or left to rot in overflowing landfills, arcenciel has spent decades building powerful systems that protect both people and the environment through four units within its Environment Sector: DERE (Solid Waste Recycling), DEHO (Hospital Waste Treatment), the Social Boutique (circular economy initiative for clothing waste), and the Brocante (circular economy initiative for unwanted furniture and household items).
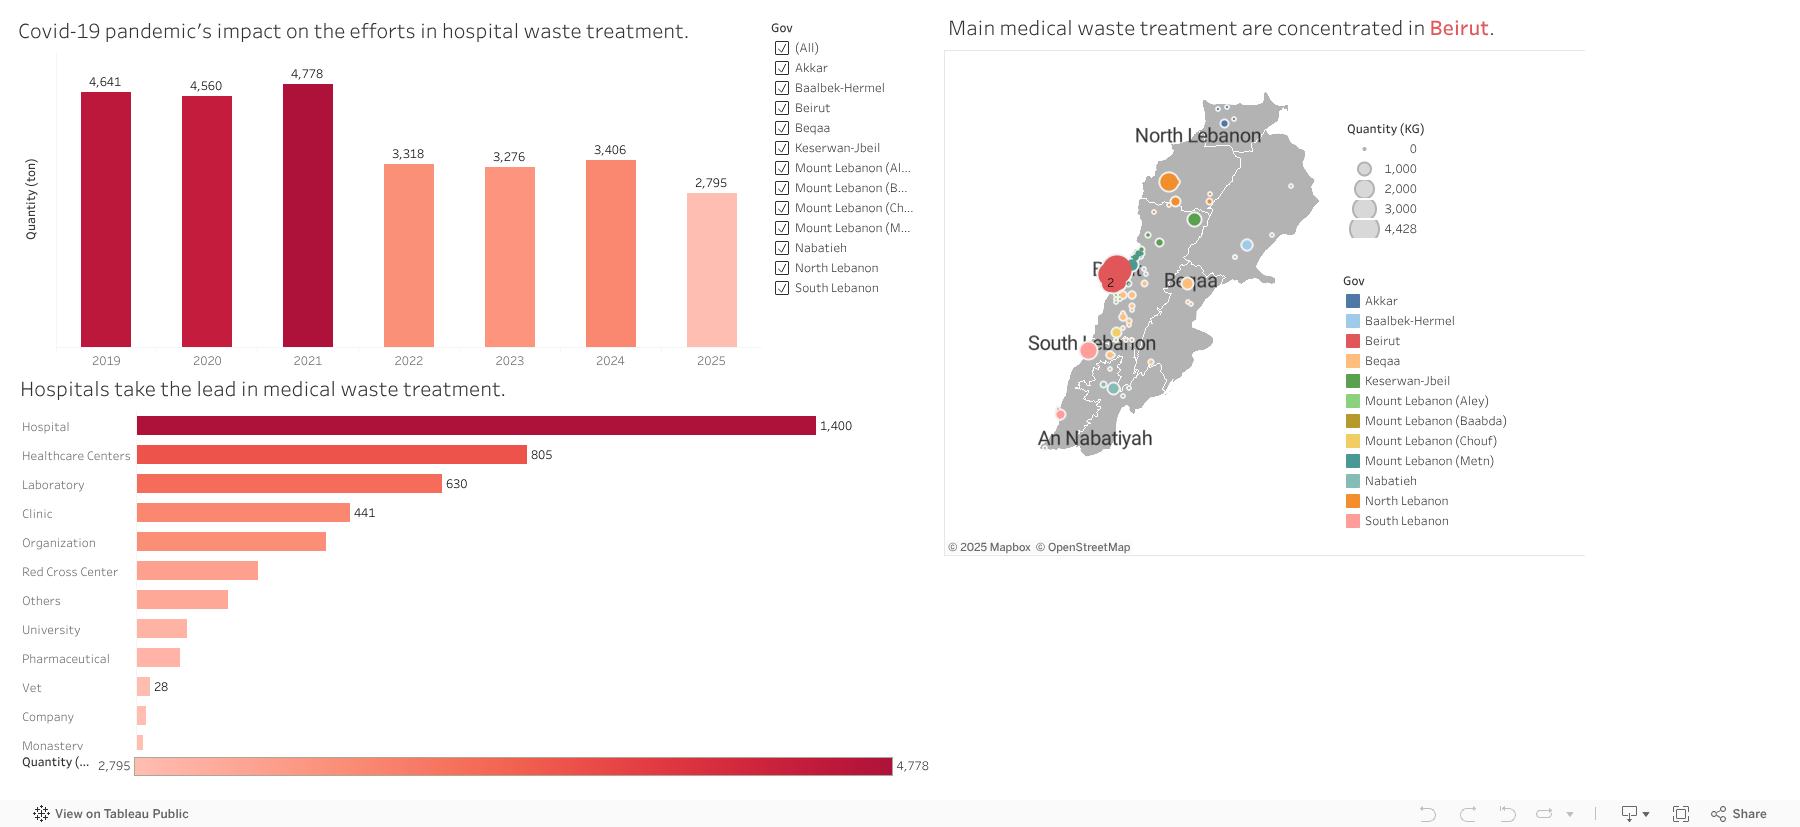
1. DEHO: Saving Lives During the Pandemic
arcenciel operates specialized facilities that collect, sterilize, and shred infectious medical waste, converting it into non-hazardous material suitable for regular disposal.
When we looked at the timeline of medical waste in Lebanon, one pattern immediately stood out. Between 2019 and 2021, the curve shoots upward, a sharp peak that mirrors the most intense years of the COVID-19 pandemic. In those years, DEHO handled record quantities of medical waste, reaching nearly 4,700 tons. Behind those numbers were packed hospital corridors, nonstop testing, and the global scramble for disposable protective equipment.
But the story shifts after 2022. As the pandemic slowly loosened its grip, medical waste volumes began to fall. By 2025, at least up to mid-October, the total had dropped to around 2,795 tons, signaling a gradual return to more typical levels.
The client landscape tells its own part of the story. Unsurprisingly, hospitals dominate, making up the largest share of medical waste generators, around 1,400 institutions. They’re followed by healthcare centers, labs, and clinics. Yet one detail we hadn’t expected emerged quietly in the data: veterinary practices. There are only 28 of them in the system, but they still appear as steady contributors to DEHO’s operations, a reminder that “medical waste” extends beyond human healthcare.
On the map, another pattern comes into focus. The brightest cluster sits right where you’d expect, Beirut, home to the country’s biggest hospitals and medical centers. Mount Lebanon forms a secondary ring, and beyond that, smaller dots scatter into Bekaa and the North. The geography of medical waste, it turns out, closely follows the geography of healthcare itself.
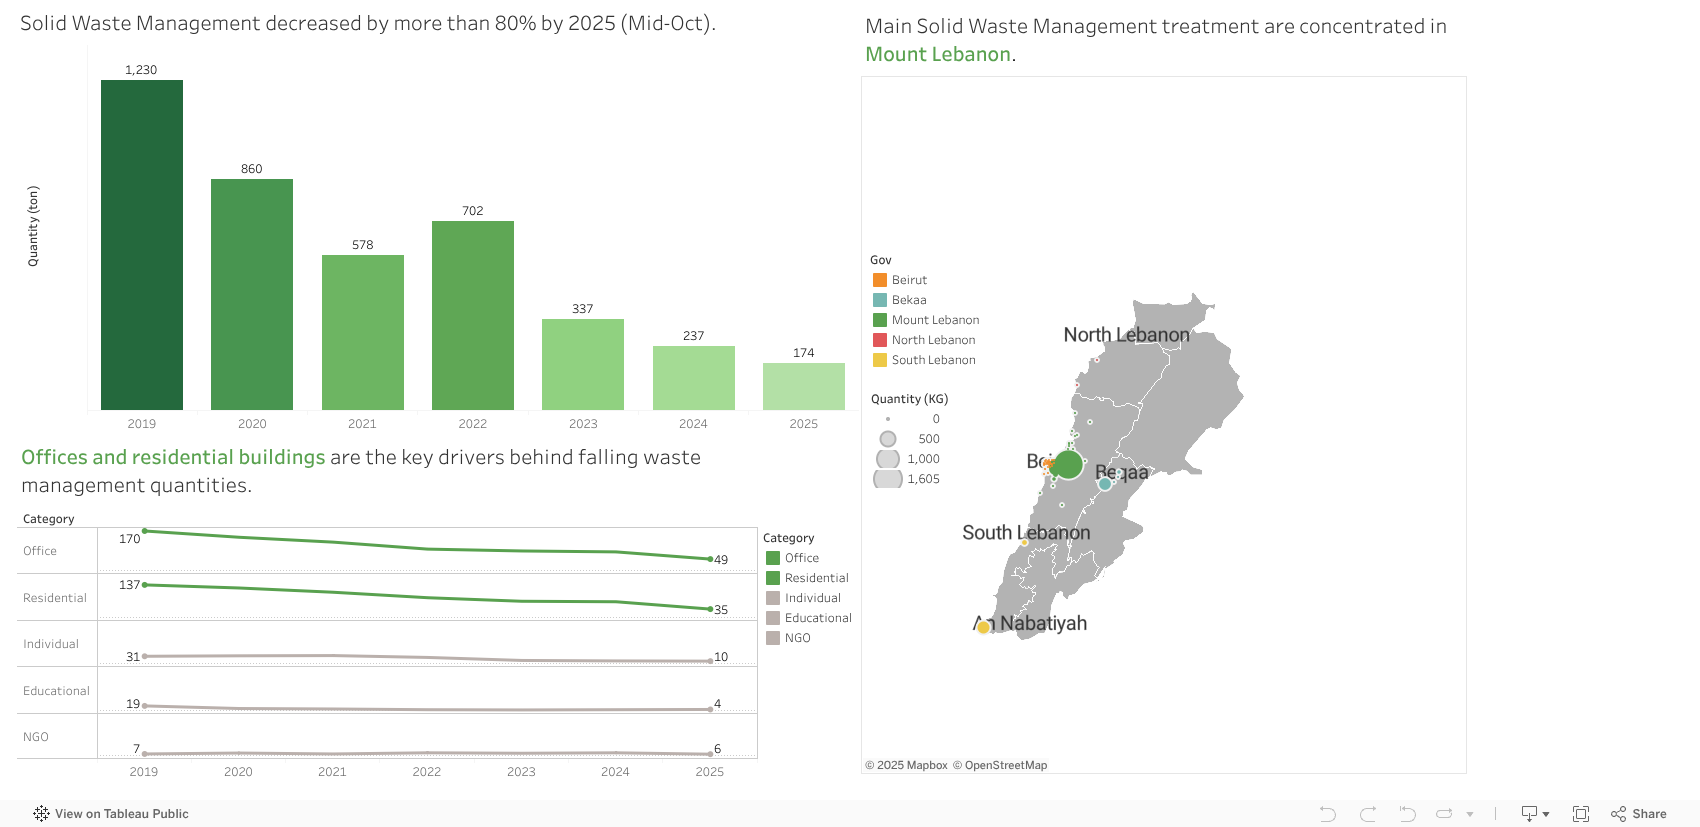
2. DERE: The Decline of Solid Waste Recycling
For many people, arcenciel’s Rolling Caps project is the first thing that comes to mind when they think about recycling, a simple act of collecting plastic caps that grew into a nationwide habit. But as we dug deeper into the DERE dataset, it became clear that the story of solid waste management goes far beyond bottle caps. It is, in fact, a story of quiet decline.
Between 2019 and mid-October 2025, the amount of solid waste managed by arcenciel fell by more than 85%, from 1,230 tons to just 174 tons. This isn’t a sudden dip; it’s a steady, multi-year decline that signals a deeper shift in how waste is being generated, sorted, and collected in Lebanon.
The drop becomes even clearer when looking at who’s producing this waste. Offices and residential buildings, once the core of the system, have significantly pulled back. Office clients shrank from 170 to 49, and residential buildings from 137 to 35. NGOs and individuals stayed relatively stable but remain small contributors, while educational institutions almost disappeared from the client base altogether. The trend points to a broader decline in organizational participation in recycling practices.
Spatially, most activity is concentrated in Mount Lebanon, with far less taking place in Beirut and very little in the Bekaa. This pattern mirrors our survey responses, suggesting similar geographic trends in both waste generation and public engagement.
For many, the Rolling Caps project remains the most memorable symbol of arcenciel’s recycling efforts, a simple initiative that caught national attention. Yet the data shows a more complex reality: solid waste management has been steadily shrinking, reminding us of the work needed to rekindle participation and rebuild trust in sustainable systems.
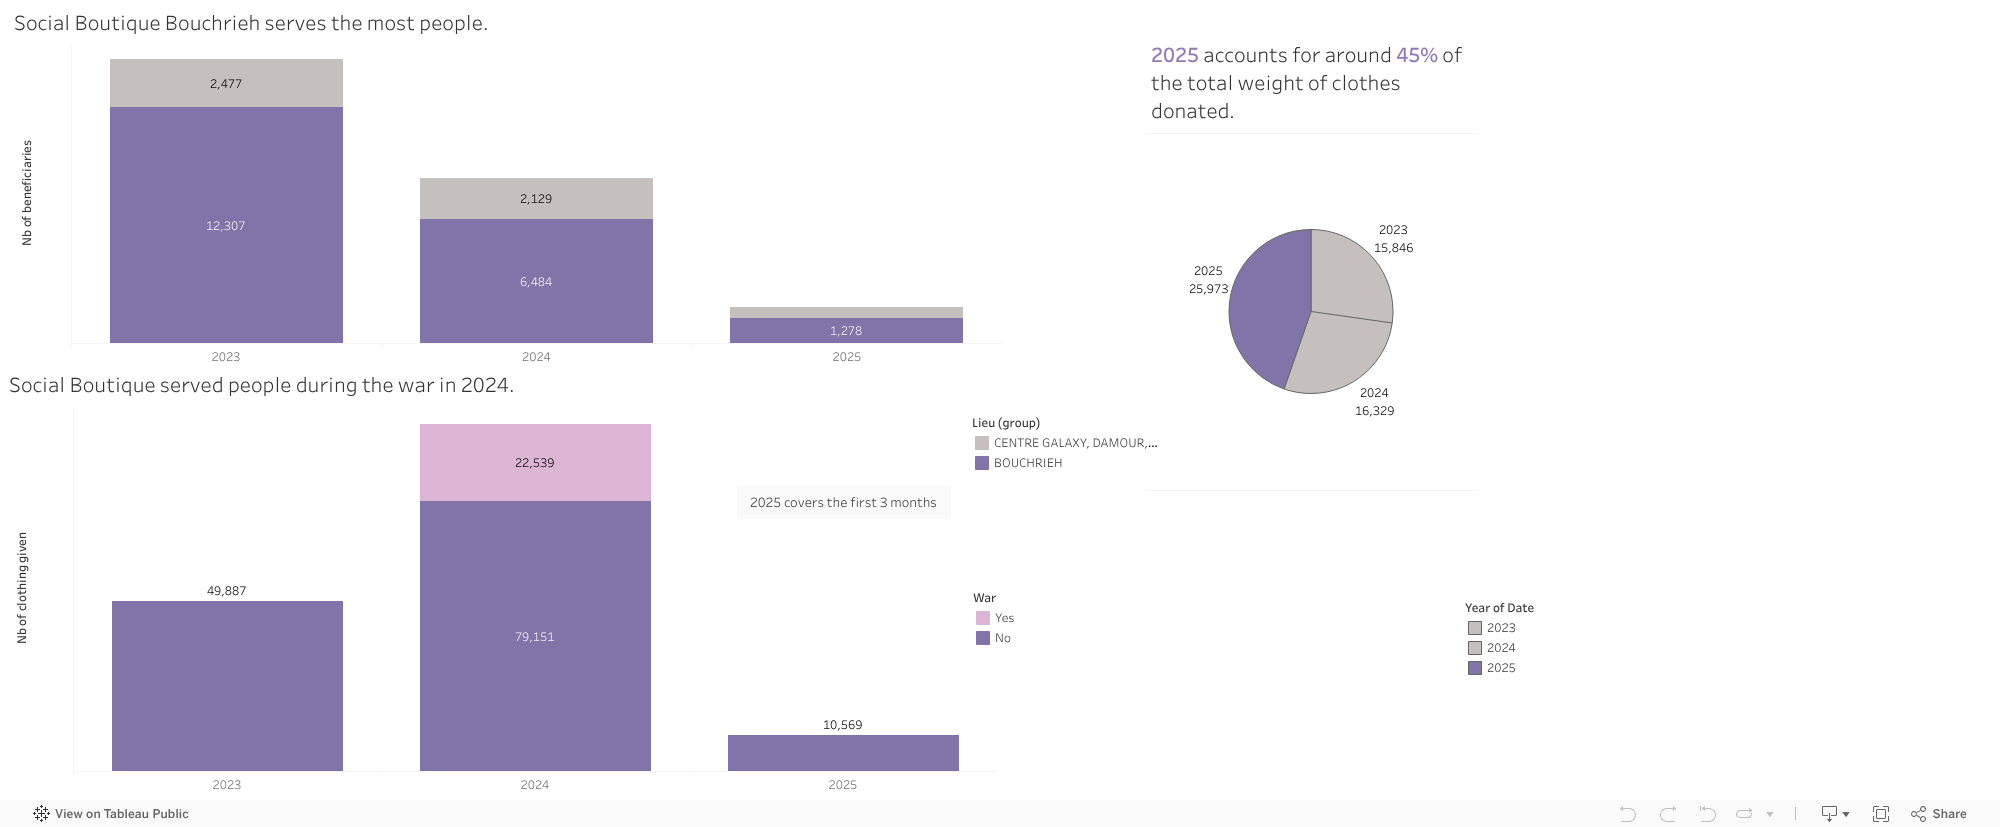
3. Social Boutique: Clothing Donations as a Social Lifeline
If DERE shows us how waste declines, the Social Boutique shows us how resources circulate. At its heart, the boutique is a simple but powerful idea: clothing donated by the public is sorted, repaired, and redistributed to families who need it most. What arrives as a bag of used clothes leaves as warmth and support.
From 2023 to 2025, the data reveals an interesting pattern. Even though 2025 only includes records up to mid-October, it already accounts for an unusually large share of the total clothing weight collected, suggesting early-year surges or improvements in how donations are handled. The Bouchrieh center stands out as the busiest hub, serving more than 12,000 people in 2023 and over 6,000 in 2024, with Zahlé and Galaxy following behind at smaller but meaningful scales.
One spike in the data is impossible to ignore: in late 2024, over 22,000 clothing items were tagged as war-related. These represent urgent distributions during October to December, when thousands of families were displaced and in need of immediate support.
But the Social Boutique’s impact isn’t just in the items it collects it’s in the people who make it all work. The team is mostly women, many from vulnerable backgrounds, including women with disabilities. Through steady employment and community support, they turn donated clothes into a lifeline for others, becoming key players in Lebanon’s circular economy.
4. Brocante: Furniture Reuse and the Circular Economy in Action
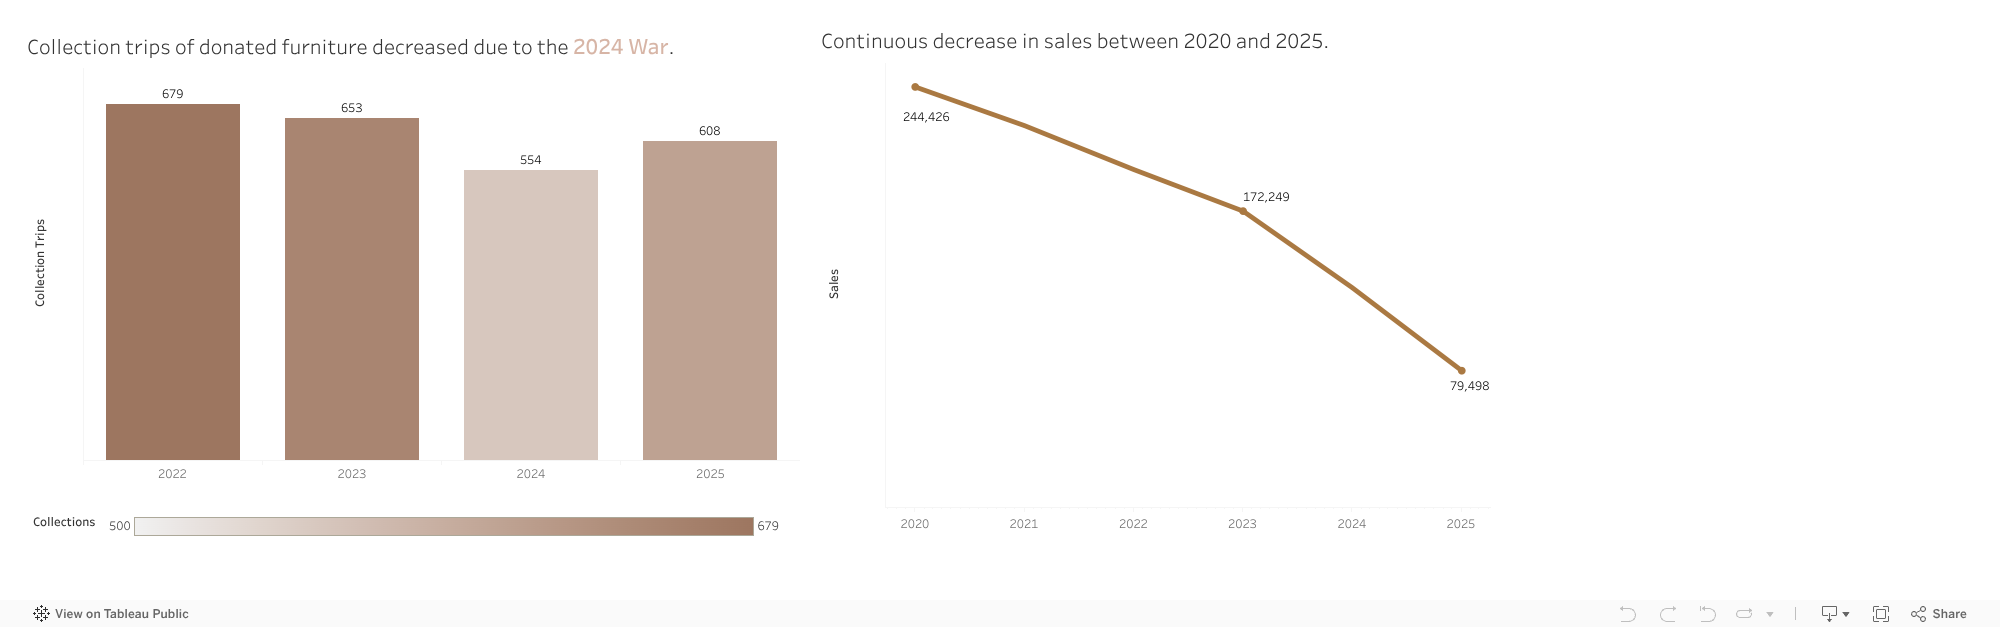
The Social Boutique tells the story of clothing, then the Brocante tells the story of furniture, the heavy, bulky pieces that often end up on sidewalks or abandoned during crises. Instead of becoming waste, these items enter arcenciel’s circular economy: collected from homes, repaired when needed, and resold at accessible prices to support the organization’s sustainability. Furniture often ends up on sidewalks, in empty lots, or in landfills, but the Brocante transforms these discarded items into opportunities. The collection trip data reveals patterns shaped by Lebanon’s crises. Trips declined during 2024, reflecting war-related mobility challenges, but rose again in 2025.
The data shows a mixed pattern in collection activity. Between 2022 and 2025, the number of collection trips, each representing at least one donated furniture or household item, fluctuated. Trips dropped from 679 in 2022 to 554 in 2024, before rising again to 608 in 2025 (with data only until October). The dip in 2024 isn’t random; it mirrors the disruptions of the 2024 war, when mobility, relocations, and donation patterns were heavily affected.
Sales, however, tell a clearer story. From 2020 to 2025, total revenue from Brocante items steadily fell from 244,426 USD to 79,498 USD. But this decline isn’t about fewer donations or lower demand. As the Environment Sector lead explained, it reflects an operational gap: the closure of the Galaxy Mall showroom in December 2024 and the delayed opening of the new Zalka Eco Hub in April 2025. With no physical space to sell items for several months, early 2025 shows a sharp drop in revenue, a logistical pause rather than a weakening of the model.
Despite these fluctuations, the Brocante remains a cornerstone of arcenciel’s approach to circularity, turning what might have become trash into both environmental and financial value.
Recycling at home and giving your recyclables to arcenciel
Donating clothes or furniture
🗺️ Collection points are available at all 10 arcenciel centers across Lebanon.
📧 For large quantities of recyclables, furniture, or clothing, contact: info@arcenciel.org
What about the future?
If the present reflects the weight of Lebanon’s challenges, the future reflects the power of what its communities can achieve when circularity, inclusion, and sustainability are not just ideas, but everyday practice. And this future is not theoretical, it is already beginning, one recycled bottle, one hospital partnership, one donated chair, and one empowered individual at a time.
Lebanon’s hospitality industry has endured some of the toughest years in its history. COVID emptied hotels and restaurants almost overnight. The economic collapse made it difficult for businesses to operate amid power cuts, fuel shortages, and soaring costs. More recently, regional tensions have slowed travel and pushed many southern and rural destinations into survival mode.
Yet the latest tourism data shows something important. The treemap reveals that most hotels remain concentrated in districts like Matn, Keserwan, and Byblos. At the same time, the tourism index shows that some of the most appealing destinations for visitors are elsewhere. Tripoli, Western Beqaa, Hasbaya, and Nabatieh all rank high in tourism experience despite having far fewer hotels.
This gap between where tourists want to go and where hospitality infrastructure actually exists is one of Lebanon’s biggest lost opportunities. It reflects years of underinvestment made worse by crisis after crisis.
But it also points to a clear path forward. Investing in roads, stable electricity, clean water, internet connectivity, and the preservation of cultural and natural sites would immediately boost the capacity of high-potential regions. Strengthening infrastructure beyond Beirut and Mount Lebanon would unlock new jobs, revive local economies, and distribute tourism revenue more evenly across the country.
Lebanon does not need to rebuild its appeal. It needs to rebuild the foundation that allows hospitality to grow. With the right infrastructure, the regions that tourists already love can finally receive the investment they deserve.
Lebanon’s economic collapse has slowly reshaped everyday life, but nowhere has the crisis felt more personal than in the price of food. For years, Lebanese households lived with relatively stable costs, where a grocery list looked more or less the same from one month to the next. But as the currency began losing value, that balance shattered, and the cost of essential goods started rising in ways no one could ignore.
To understand just how severe this shift was, I looked at the Consumer Price Index (CPI) from 2000 to 2024 – specifically comparing Food CPI with the General CPI. The visualization embedded below helps reveal the full story behind the surge.
For almost two decades, both lines lie nearly flat. Prices were predictable. Inflation existed, but it was slow and manageable. Then, around 2019-2020, everything changed. As the Lebanese pound depreciated, overall inflation began climbing steadily. But food prices did not simply follow that upward trend – they broke away entirely and started rising at a much steeper, more dramatic rate.
In the highlighted portion of the visualization, the gap between the two lines grows quickly and aggressively. General CPI increases significantly, but Food CPI skyrockets. This divergence reflects more than numbers: it captures the moment when essential goods became unaffordable for many families. Imported food items, already sensitive to exchange-rate fluctuations, adjusted more slowly at first and then surged as sellers fully priced goods in dollars. What used to be routine purchases suddenly became financial shocks, forcing households to change diets, reduce quantities, or shift to cheaper alternatives.
This widening gap explains why the crisis is felt most intensely in the supermarket aisle. Food, being a daily necessity, exposes the full weight of inflation in a way other categories cannot. The data reveals that while inflation affected every part of life, it was food prices that redefined the crisis for Lebanese people.
Understanding this pattern is crucial because it highlights where intervention is most needed. Transparent pricing, stable exchange rate mechanisms, and stronger support for local production can reduce vulnerability to future shocks. The visualization makes one thing clear: when food prices rise much faster than everything else, the impact is immediate, widespread, and deeply human.
Lebanon’s inflation story is still unfolding, but recognizing how and why food prices broke away from the general trend is an important step toward rebuilding stability. The gap in the chart is more than a statistical difference – it represents the lived reality of households trying to keep up with a crisis that reshaped even the most basic necessities.
For years, Lebanon appeared to be defying gravity. As we rebuilt from the civil war, our external debt climbed steadily, reaching over $70 billion. But look closely at the blue line in the chart below.
Our reserves (the blue line) seemed to keep pace with our debt (the red line). This created a sense of security; for every dollar we owed, we seemed to have a dollar in the vault. But this correlation was an illusion. The reserves weren’t built on productivity; they were built on the very debt we were accumulating. We were borrowing to pay the interest on what we had already borrowed.
The Turning Point (2018–2019)
The story takes a dark turn in 2018. Notice the divergence in the first chart: Debt continued its upward march, hitting nearly $80 billion, while reserves began a steep decline. The “leakage” had begun. Money was flowing out faster than it could come in.
But where was the money coming from, and why did it stop?
The Tap Runs Dry
The bar chart below reveals the culprits behind the crash. For nearly a decade, commercial banks (the green bars) were the engines of this debt machine, pouring billions into the system.
Then came the shock. In 2019, the green bars didn’t just shrink—they flipped. Commercial bank lending turned negative, representing a massive contraction and capital flight. At the same time, the bond market (orange bars), which had been a steady source of cash, flatlined.
Conclusion
The data tells a tragic 3-minute story: A decade of debt-fueled growth created a fragile bubble. When the banks pulled the plug in 2019, the illusion shattered, leaving a nation with $70 billion in debt and a reserve tank running on empty. As we look to the future, any recovery plan must start by acknowledging these red and green bars—the undeniable accounting of a system that consumed itself.