When COVID-19 began spreading across Lebanon, not all towns were affected in the same way. Some communities were already carrying another burden long before the pandemic arrived: chronic diseases such as hypertension, diabetes, and cardiovascular conditions. This raised an important question: did towns with more chronic illness also experience higher COVID-19 case numbers?
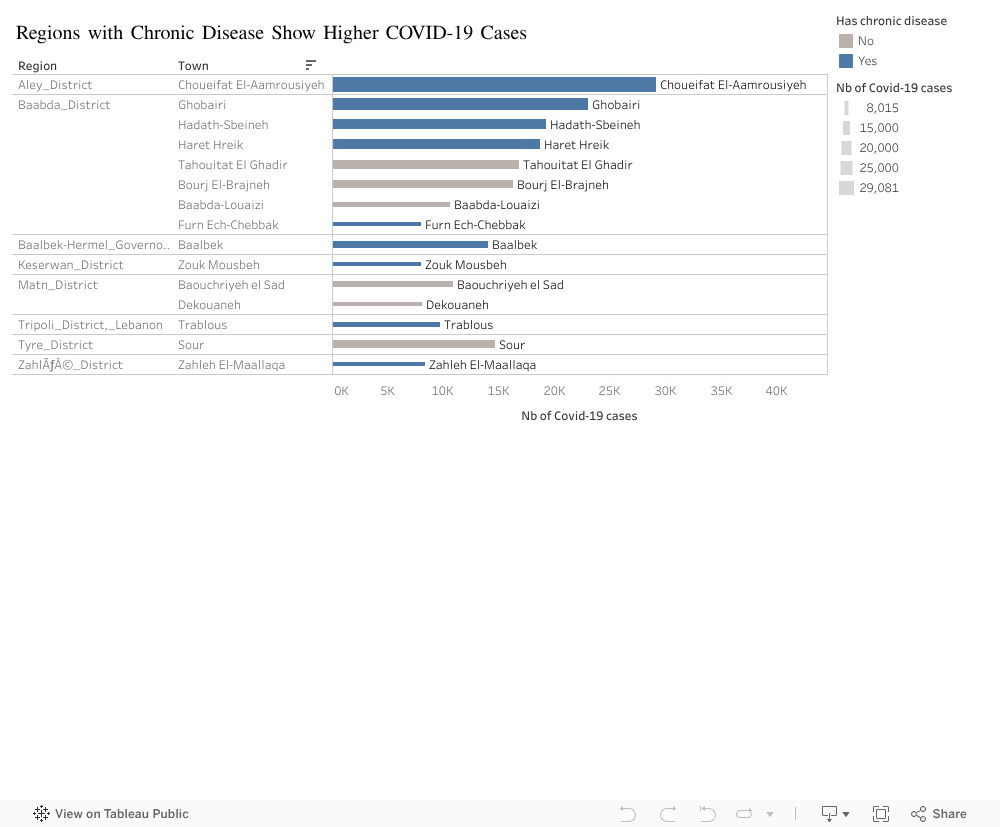
To explore this, I visualized the relationship between chronic disease presence and the total number of COVID-19 cases across Lebanese towns. The visualization below compares towns with and without chronic disease burdens, making it easy to see which communities were hit hardest as shown below.
As the bars reveal, the towns shown in blue — those with chronic disease — consistently appear at the top of the ranking. Choueifat, Ghobeiri, Hadath-Sbeineh, Haret Hreik, and Tahouitat El Ghadir stand out with significantly higher COVID-19 case counts. By contrast, towns represented in grey, with no chronic disease reported, tend to have lower case numbers and cluster toward the bottom of the list.
This pattern suggests that the pandemic amplified pre-existing vulnerabilities. Towns where chronic diseases were more common may also have had denser populations, older residents, more complex healthcare needs, or other structural factors that made containment more difficult. Although this visualization does not prove direct causation, the correlation is clear and consistent.
Understanding these disparities is crucial for future public-health planning. Communities carrying a dual burden — high chronic disease prevalence and elevated infection rates — would benefit from targeted support, improved access to care, and early intervention strategies. The visualization serves as a reminder that pandemics do not impact all towns equally, and that underlying health conditions can shape the trajectory of a crisis in powerful ways.
Samer is a 58-year-old shop owner in Baabda. He has diabetes and hypertension, and like many others living with chronic conditions, he spent the early months of the pandemic in quiet fear. He followed every guideline, avoided unnecessary outings, and even closed his shop early just to stay safe.
As I began working with data on chronic disease prevalence across Lebanon, I kept thinking about people like Samer; individuals whose health risks existed long before COVID-19 arrived. It made me wonder: Do districts with more people like Samer also end up reporting more COVID-19 cases?
At first, the logic seemed simple: more chronic conditions should mean higher vulnerability, and higher vulnerability should mean more cases.
But once I visualized the data, the story turned out to be more complicated than that.
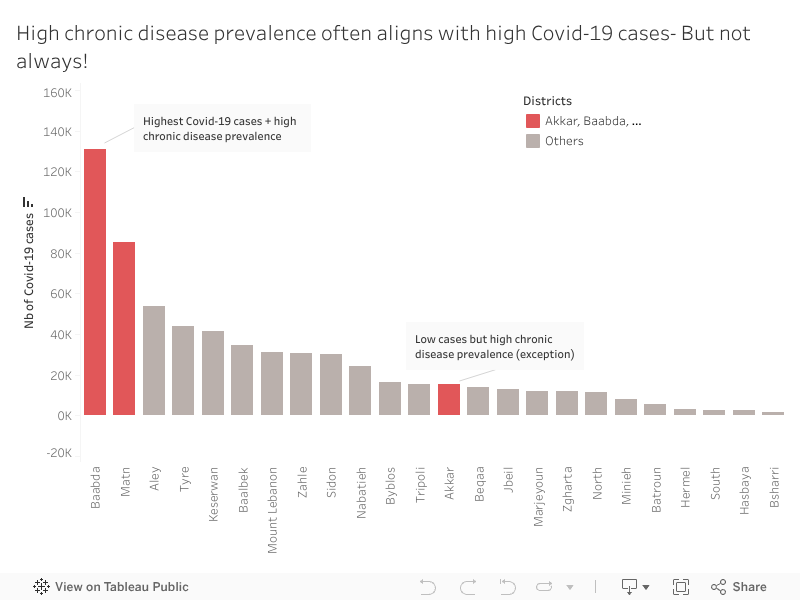
When we look at Baabda, Samer’s home district, the pattern is exactly what we expect. Baabda and Matn have a high chronic disease prevalence which explains why they recorded the highest number of COVID-19 cases. These districts appear in red in the visualization because they represent the expected relationship: high chronic disease prevalence accompanied by high COVID-19 case counts.
Most other districts show the same downward pattern: fewer chronic illnesses tend to come with fewer reported infections. It’s the straightforward story we anticipate.
Until one district breaks it.
While exploring the data, Akkar immediately stood out. Unlike Baabda or Matn, Akkar shows relatively low COVID-19 case numbers despite having a high prevalence of chronic diseases. At first glance, this shouldn’t happen. But Akkar tells a different health story.
Akkar is less dense, has fewer specialized medical centers, and mobility patterns differ. But an important social factor also played a role: many residents initially believed COVID-19 was “just a flu”, something exaggerated, not dangerous. Because of that, people were far less likely to get tested, especially when symptoms were mild or unclear.
So, the low case numbers may not reflect low infections, they reflect low detection. Akkar shows us that vulnerability isn’t only biological or medical. Sometimes it’s cultural, structural, or tied to trust in the health system itself.
That was the moment when the visualization stopped being merely a chart and became a real narrative.
People like Samer live in districts where both chronic disease and COVID-19 risks were high and highly visible. But in Akkar, people with the same medical vulnerabilities faced a quieter, more hidden risk, one that doesn’t always show up in official numbers but still shapes their health outcomes.
This is the heart of the story: patterns tell us what usually happens, but exceptions reveal what we might be missing.
Understanding these mismatches matters. High-case, high-risk districts like Baabda and Matn may need more hospital capacity and emergency planning. High-risk, low-case districts like Akkar may need earlier outreach, awareness campaigns, and accessible screening, especially in communities that may initially resist testing.
If we focus only on case counts, we risk overlooking communities that need protection long before outbreaks become visible.
When I think back to Samer, closing his shop early every night, hoping to stay healthy, I’m reminded that data becomes meaningful when it reflects real people. In public health, the story doesn’t live only in the trend. It lives in the exception. Because that’s where we discover the next challenge before it appears.
“ When it comes to health, your ZIP code matters more than your genetic code ” – Dr. Tony B. Iton
The Healthcare Scene in Lebanon
Rami spent the majority of his life in Aley, Choueifat El Aamrousiyeh, a quiet town where people know each other all throughout the area. When Covid-19 began spreading in Lebanon, he assumed that his location would be relatively safe in terms of health implications. After all, the news was primarily focused on Beirut.
During peak months, Rami started hearing about his neighbors testing positive at a pace he certainly did not expect. Meanwhile, his cousin Leila, who lives close by in Kahhaleh, hardly knew anyone infected. They were both in the same region, but faced entirely different risks.
Rami’s worry and stress levels grew a lot, especially for his elderly parents with chronic conditions. If Covid spread in his town at a fast pace, would they be able to get help in time? Would testing and vaccination centers be available in close proximity to where they live? Would nearby hospitals be overwhelmed with full capacities?
Leila and Rami’s experiences reflect what many Lebanese families endure. Two households in the same region, but different towns, had completely different stress levels regarding the readiness of healthcare emergency responses.
Health Patterns in Lebanon: What the Data Reveals
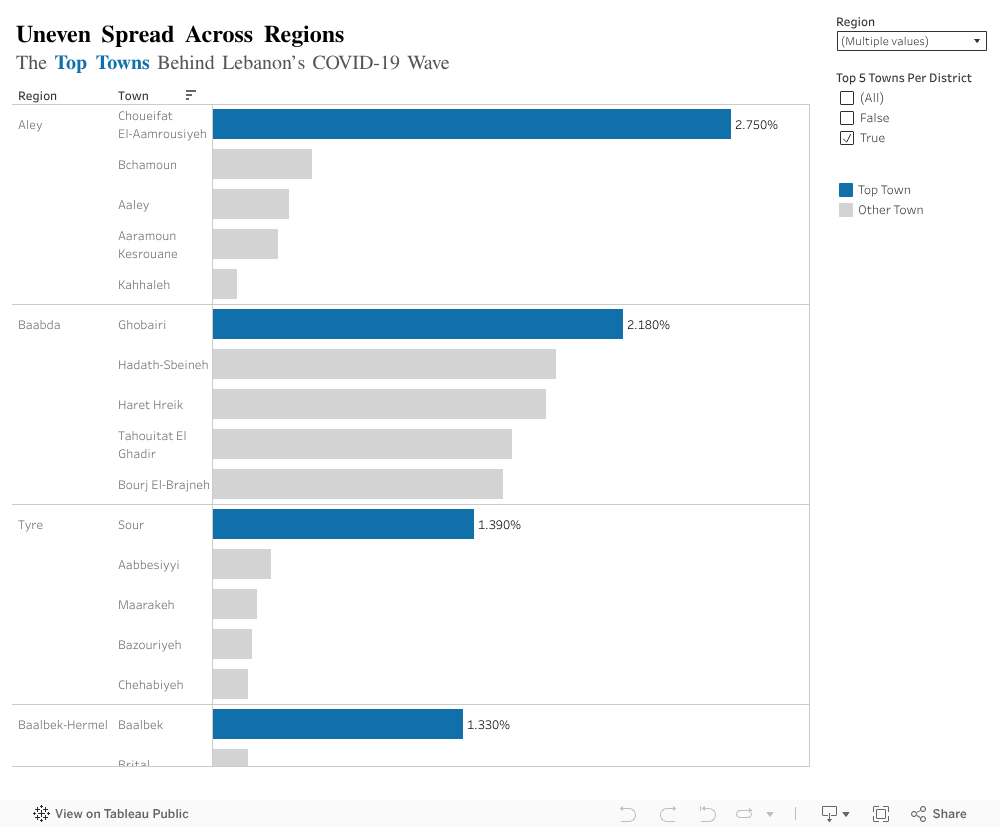
We tend to think of public health at the regional level, but covid behaved more so at a town level per region. This exposed imbalances that are not usually explored. Top town per region with the highest contribution to the total national case count revealed unexpected results:
In Aley (region), Choueifat Aamrousiyeh alone accounted for 2.75% of all cases in the country.
In Baalbek-Hermel, Baalbek alone stood out with 1.33%, which is much higher than surrounding towns.
The remaining regions showed similar patterns: one or two towns carried the majority of cases.
What Does This Mean Exactly?
People like Rami, who happen to live in a high risk town, experienced a completely different pandemic from people in towns just a few kilometers away. This is likely to repeat in the future if another major healthcare crisis hits the country.
Moving Forward, What Can Be Done?
Prioritize hotspot towns: testing centers, clinics, and awareness campaigns should start where case data shows concentration, not where population is highest.
Build local readiness plans: Instead of generic region level plans, towns with higher infection percentages need specific preparation steps (rapid testing, temporary isolation centers, and community awareness).
Use data driven action plans: Covid case percentages help identify where outbreaks are likely to happen again. If regions plan smarter, hospitals and clinics face less chaos.
Strengthen communication and public awareness: Towns with consistently high rates should receive ongoing health messaging to prevent repeat scenarios.
The Key Takeaway
By understanding how Covid-19 was not distributed proportionately across towns, we can finally design smarter, more effective responses. This applies not only to pandemic/epidemics, but to any future public health threat in Lebanon.
During the peak of the COVID-19 pandemic back in 2021, waking up to news of people passing away due to symptoms complications became the norm, but in the midst of the overwhelming news, one man’s story hit us hard. His name was Nader, a 46-year-old from Baabda, a man known for his loud laugh, strong coffee, and long Friday lunches with friends. We knew him as the “office guy”; he was in fact there for everyone, until the day when his lungs failed him. He caught COVID, the symptoms escalated quickly. Within days, his oxygen levels dropped, and despite being admitted to the hospital, the virus was already overpowering a weak cardiovascular system. Everyone was in shock, since Nader was just in his mid-40s, and we expected he’d beat the virus easily. But once the doctors informed us he didn’t make due to his overworked cardiovascular system, we understood it was beyond COVID-19, and not only Nader’s lungs have failed him, but a whole lifestyle and healthcare system.
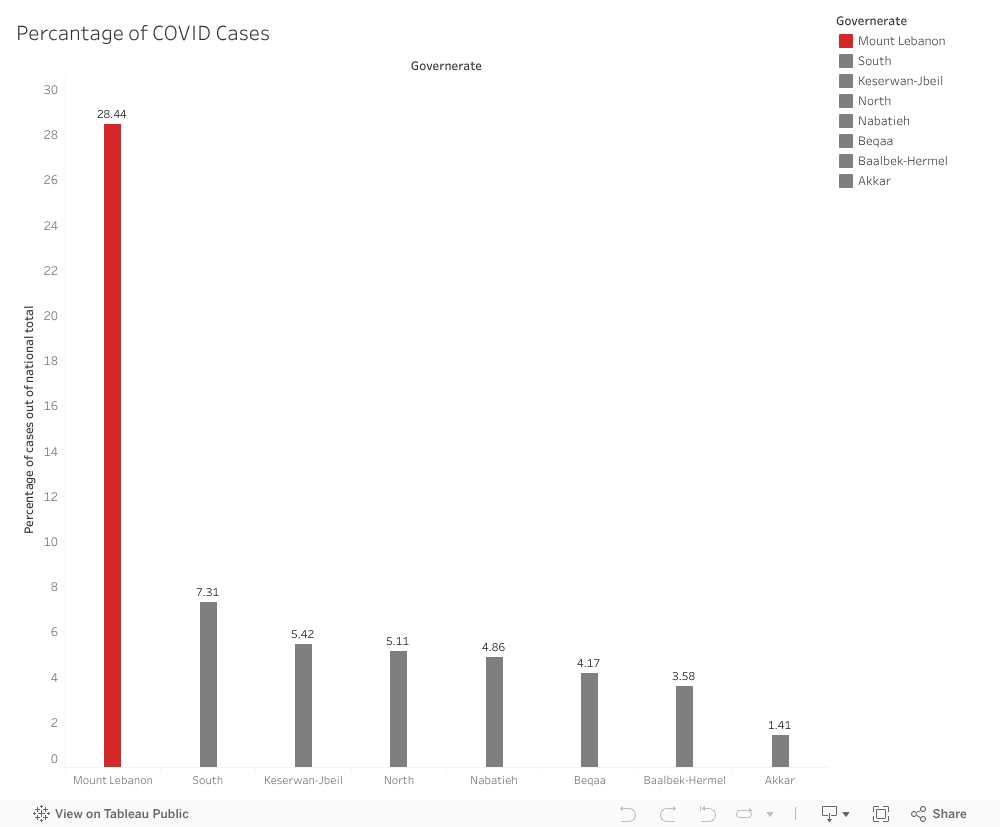
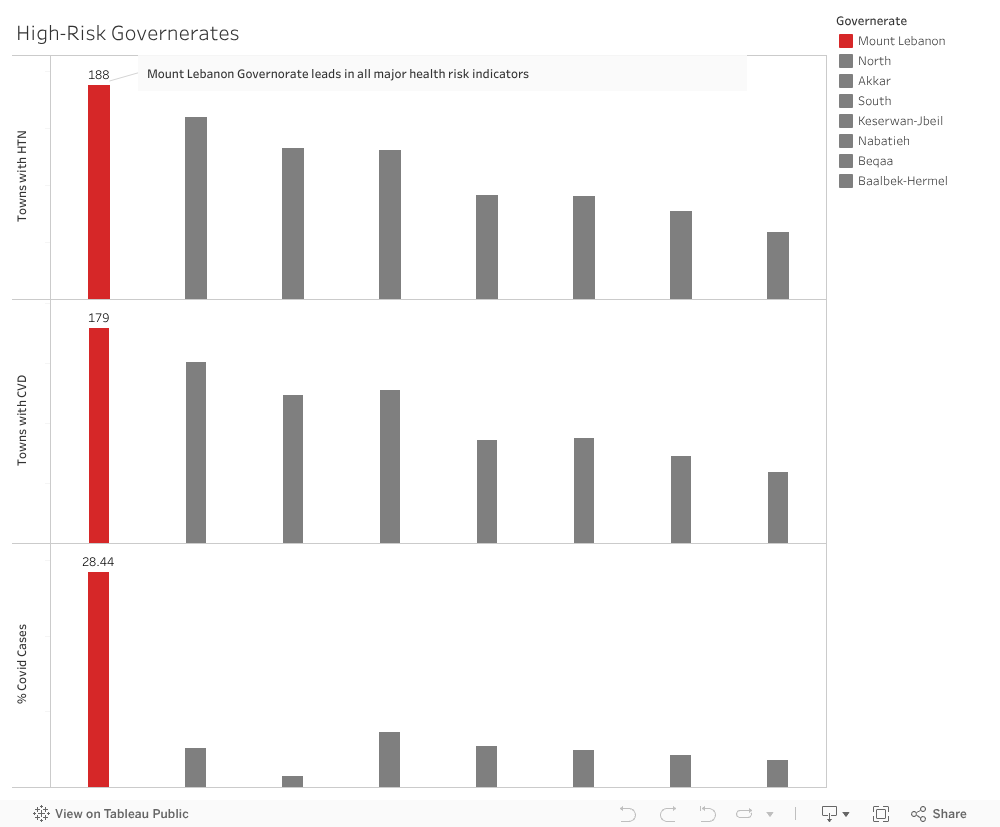
This raised a bigger question for us: Which areas in Lebanon have unusually high levels of chronic disease that make its residents more at risk during crises? To explore this, we analyzed health data across governorates, focusing on cardiovascular disease (CVD) and hypertension (HTN). We first explored how the percentage of COVID-19 cases out of national totals was distributed, with Mount Lebanon leading in this area.
To understand further the extent of the health risk, we compared these chronic disease patterns to COVID cases in all Lebanese Governorates. What we saw flagged Mount Lebanon as a hight risk Governorate as it has the regions with the highest burden of CVD and HTN also recorded the highest COVID cases. This means that in these areas, the symptoms of COVID-19 will be exacerbated by the existing chronic disease, which leads to more complicates and higher hospitalization rates.
The highest-risk governorate being Mount Lebanon isn’t only about pandemic response. It’s about addressing the silent epidemic of chronic disease that makes future health crises even more dangerous. Based on our analysis, we believe it’s time to expand early screening programs, increase community-level hypertension detection, and strengthen preventive care. Preventative measures are needed so that the most vulnerable groups are able to cope with unprecedented health emergencies. If we focus on prevention now, we can reduce risk and help ensure that stories like Nader’s don’t repeat themselves.
Charting Progress: Vietnam’s GDP, Trade, and Industrial Growth (2010-2022)
The years 2010 to 2022 have seen stability and expansion in Vietnam’s economy. The visual shows the economic dynamics of the nation over a ten-year period, highlighting the GDP growth rate annually, which highlights the country’s resilience in the face of regional and international difficulties. Additionally, it draws attention to the consistent contribution of trade to GDP, which reflects Vietnam’s growing influence on the international scene. The graph also shows the manufacturing and industrial sectors’ expanding and considerable influence on the economy, indicating a move toward modernization and industrialization. Vietnam’s strategic economic policies and strong reactivity to shifting economic conditions are demonstrated by this data narrative.
Established policies like the Doi Moi economic reform, which laid the foundation for Vietnam’s market-oriented strategy, supported the country’s economic resilience in the face of global problems in 2020. Furthermore, during a turbulent time, Vietnam’s commerce was supported by the government’s strategic application of free trade agreements, such as the EU-Vietnam Free commerce Agreement (EVFTA) and the Comprehensive and Progressive Agreement for Trans-Pacific Partnership (CPTPP). During the epidemic, this strategy and programs like the National Foreign Direct Investment Strategy for 2021–2030 supported growth and cushioned the economy. Following the COVID-19 epidemic, Vietnam’s National Assembly passed Resolution 43 in 2022, which was a comprehensive package meant to revive the country’s economy. To lessen the burden on businesses, specific measures included a 2% reduction in VAT and CIT deductions. A significant budget, almost US$15 billion, was set aside for modernization, infrastructure development, and healthcare advancements. In addition, the government offered favorable loans to support company recovery together with social security subsidies for job creation and training. These focused monetary and fiscal policies were essential in launching Vietnam’s economy’s post-pandemic recovery. The Vietnam Briefing addresses the effects and extent of these policies in detail.
Seizing the Momentum: Vietnam’s Path Forward
In times of global unpredictability, Vietnam’s resilience and economic expansion bear witness not just to its excellent policymaking but also to the unwavering dedication of its people and leadership. One issue still stands as we consider this dynamic economy’s amazing journey: how can the international community use Vietnam’s achievements as a model to strengthen its own economy? The search of creativity and teamwork together holds the key to the solution. Using Vietnam’s experience as a model, let’s consider how we may use these ideas to face our own issues with the same determination and bravery.