by egh13 | Nov 19, 2025 | Uncategorized
Introduction
Tourism in Lebanon is often celebrated for its beautiful landscapes, cultural heritage, and vibrant towns. But behind these well known attractions lie a more practical question: which towns are actually equipped to support tourism on a daily basis? To explore this, I created a dashboard comparing Lebanese towns based on the number of restaurants and cafes, the number of hotels, and an overall Tourism Score that ranks towns according to their tourism readiness. Instead of relying on impressions or reputation, the data reveals how tourism infrastructure is truly distributed across the country. The results highlight unexpected leaders, surprising gaps, and a clearer understanding of which towns are prepared to welcome visitors and which ones still lack the necessary services.
Key Insights from the Dashboard
-
Only a few towns offer a complete tourism ecosystem
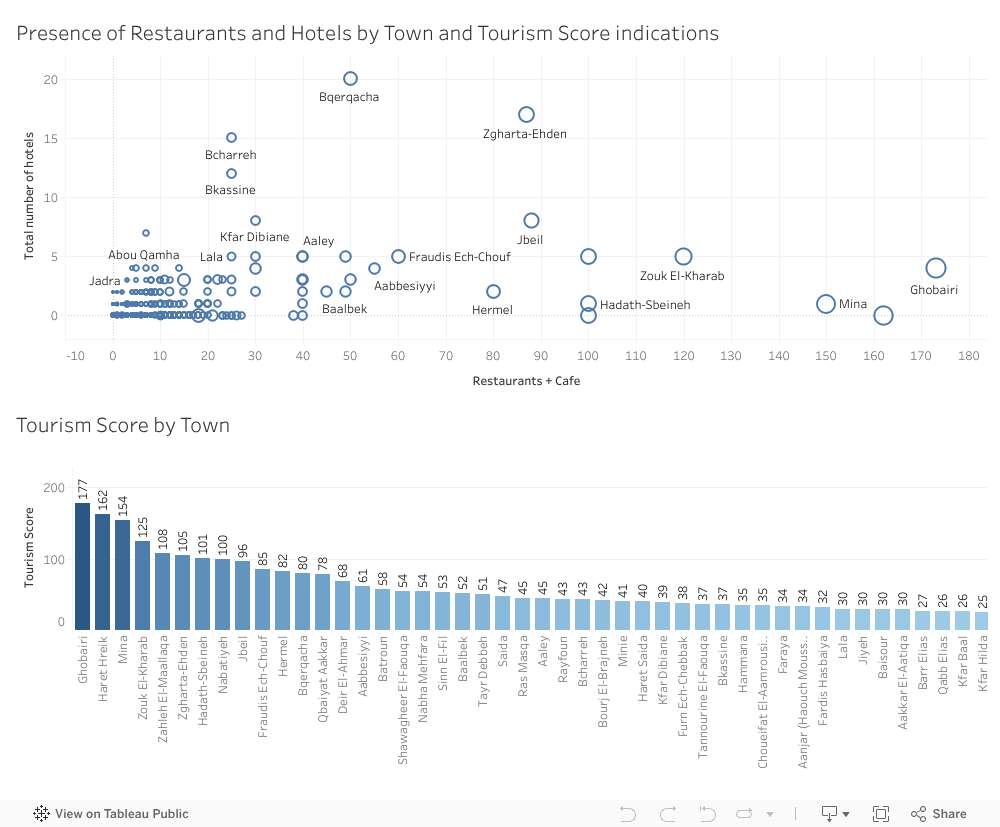
The scatterplot shows that just a small number of towns have both high numbers of restaurants and cafes and multiple hotels. Towns such as Zgharta–Ehden, Bcharreh, and Bqerqacha stand out because they have a balanced mix of services that can support both short-term and overnight visitors.
-
Ghobairi and Mina show strong activity but limited overnight capacity
On the far right of the scatterplot, Ghobairi and Mina appear with very high numbers of restaurants and cafes but almost no hotels. This suggests strong commercial and visitor activity but mainly in the form of day visits rather than extended stays. Their dense hospitality presence raises their tourism scores even though accommodations are limited.
-
The Tourism Score reveals unexpected top-ranking towns
The Tourism Score bar chart shows that the towns with the highest tourism potential are not always the ones typically associated with tourism. Ghobairi ranks first with a score of 177, followed by Haret Hreik and Mina. Meanwhile, popular tourist towns such as Zahle, Jbeil, and Zgharta–Ehden perform well but do not lead the ranking. This shows that infrastructure, more than reputation, determines tourism readiness.
-
Most towns have very limited tourism infrastructure
A large cluster of points near the origin of the scatterplot shows that most Lebanese towns have fewer than 10 restaurants and almost no hotels. These towns may rely on nearby hubs or seasonal tourism, but they lack the facilities needed to attract or accommodate visitors consistently.
-
Urban density influences tourism scores more than geography
The data suggests that high-scoring towns tend to be commercially dense and urbanized rather than simply scenic or historic. This highlights the importance of services such as dining and accommodation options as the real foundation of tourism potential.
Conclusion
The dashboard reveals that tourism activity in Lebanon is unevenly distributed. A small number of towns dominate because they offer the right mix of infrastructure, while many others, despite natural or cultural advantages, lack the essential services needed to support consistent tourism. These findings point to two opportunities. First, towns rich in natural or cultural attractions but lacking infrastructure could benefit from targeted development. Second, high-scoring, service-dense towns can act as anchors for broader regional tourism strategies. Understanding these patterns through data helps support more balanced tourism development across the country and encourages investment where it can make the most meaningful impact.

by dse19 | Nov 20, 2023 | Uncategorized
Introduction
Imagine you have a business of your own. Consider it a dream come true to have it thrive. Now, as an entrepreneur, what would you care about most for your business’s future? As a matter of fact, you can respond to this question with a multitude of answers, and all of them will converge to having a viable business, which becomes so through profits, which are achieved through SALES!
For the purpose of realizing the importance of sales to a business, we dive in this blog into the sales performance of a US based company belonging to the food and beverage sector and operating its three contemporary coffee-shop like stores within the busiest state in the United States, New York.
The company has 4 facilities, 1 main office and 3 customer facing stores (store 2, 3, and 4).
Overall Sales Performance
Our focus is to dissect and understand the sales trends and patterns that have emerged over the past two years, shedding light on the company’s growth, challenges, and opportunities.
The company’s sales trajectory exhibited a notable improvement in the first half of the years 2017 to 2018, indicating a successful adoption of growth strategies during this period. However, an interesting pattern emerged in the latter half of these years. The sales figures, initially showing distinct growth, began to converge towards approximately the same numbers in the second halves of both years. This dichotomy of divergence and subsequent convergence underscores the necessity to dig deeper into the analysis, understanding the underlying factors that led to this trend and identifying strategies to ensure consistent growth during upcoming years.
Sales Performance by Store
To further our understanding of the underlying patterns, rather than aggregating results of all stores, the sales performance of each store is studied separately throughout 2017 and 2018, offering a meticulous examination of sales figures, customer demographics, and quarterly trends. The objective is to uncover hidden challenges and propose a comprehensive action plan for sustained improvement.
Inadequacy of Store 2 Performance
In 2017, Store 2 reported sales of $281,000, which experienced a positive growth trajectory, reaching $322,000 in 2018. While indicative of progress, it’s essential to juxtapose these figures with the more robust performances of Store 3 and Store 4, recording $555,000 and $564,000 in 2017, and $637,000 and $638,000 in 2018, respectively.
In our analysis of growth percentages, Store 2 demonstrated a notable growth rate of approximately 14.6%. This rate is closely aligned with the growth rates of Stores 3 and 4, which reported rates of approximately 15% and 13%, respectively. However, it’s important to clarify that while Store 2’s growth percentage is similar to that of Stores 3 and 4, the key distinction lies not in these percentages, but in the actual growth amounts measured in US Dollars. This crucial aspect will be further explored in our upcoming detailed analysis.
While Store 2 is on a positive growth trajectory, there’s an evident opportunity to fortify its position by strategizing to match the sales amounts of its counterparts.
Customer Demographics and Value
The company’s overarching target demographic is the 40-60 age group, a segment known for its purchasing power and brand loyalty as shown in the below visualization. This age group forms the core customer base across all company stores.
However, when delving into the performance specifics, it becomes evident that Store 2 is underperforming in engaging this crucial demographic compared to its sister stores.
A closer look at customer value reveals intriguing patterns. The consistent presence of 2,131 low-value customers (smaller transactions in amount) across all stores and both years raises the question of whether there’s untapped potential among this segment. Concurrently, the identification of 119 high-value customers (larger transactions in amount) accentuates an opportunity for targeted strategies to cultivate and retain these valuable patrons.
In Store 2, a specific area of concern is the notably weak number of low-value customers compared to other stores. Addressing this issue is crucial for the store’s overall performance.
New Customer Acquisition
Store 2 consistently attracted fewer new customers each month compared to the more robust acquisition rate observed at Store 3. With respect to store 4, it is attracting the lowest number of customers per month; nevertheless, the impressive performance of store 4 suggests it is approaching market saturation, much faster than store 2.
The gap in new customer acquisition at Store 2 signals an urgency to investigate and enact strategies aimed at elevating foot traffic and expanding the customer base.
Monthly Purchase per Visiting Customer
Store 2’s performance in terms of monthly purchase per visiting customer presents a notable area for improvement. Store 2 records the lowest customer contribution among its counterparts. This finding is particularly concerning when juxtaposed with the stronger performance of Stores 3 and 4 in the same metric.
The need for improvement in monthly purchase per customer at Store 2 highlights potential areas for strategic intervention. Focusing on upselling and enhancing the overall in-store experience could be key in encouraging customers to spend more during each visit. Addressing this gap is crucial for Store 2 to not only align with the performance of its sister stores but also to optimize its revenue potential from every customer interaction.
Proposed Solutions Overview
Boosting Store 2’s market presence requires innovative and effective strategies. Here, a three-pronged approach is presented: an engaging social media campaign, impactful influencer collaborations, and a customer-enticing loyalty program. Each strategy is crafted to not only enhance brand visibility but also to deepen customer engagement and drive sales.
1. Social Media Campaign
- Objectives: Increase brand awareness on Instagram, Facebook, Twitter; drive online traffic to Store 2.
- Strategy: Post visually engaging content, use polls and quizzes, encourage user-generated content.
- Schedule: Regular, strategically timed posts; use a unique campaign hashtag for visibility and engagement.
2. Influencer Collaboration
- Criteria: Select local influencers aligned with Store 2’s image.
- Terms: Offer exclusive promotions for influencers’ followers; request content showcasing products.
- Performance: Track success using referral codes/links and engagement metrics.
3. Loyalty Program
- Components: Points system for purchases, exclusive discounts, personalized offers.
- Launch: Announce via social media, email, and in-store materials; use in-store signage for visibility.
- Staff Involvement: Train staff to engage customers about the program and provide technical support.

Recommendations
Elevating Store 2’s success hinges on a mix of dynamic strategies: targeted seasonal marketing, establishing a customer feedback loop, forming strategic local partnerships, leveraging data-driven decision-making, and enhancing the in-store experience. These approaches aim to boost sales, expand the customer base, and improve overall satisfaction. This segment delves into how each method can effectively transform Store 2’s business approach.
1. Seasonal Marketing Strategies
Develop seasonal marketing campaigns to capitalize on peak shopping periods and mitigate sales fluctuations. Tailor promotions and incentives to match customer behaviours during different quarters.
2. Customer Feedback Loop
Establish a robust feedback loop to gather insights from customers on their seasonal preferences and expectations. Leverage this feedback to tailor products and services to seasonal demands.
3. Collaborative Partnerships
Explore partnerships with local businesses and influencers to create synergies that drive foot traffic and broaden the customer base.
4. Data-Driven Decision Making
Invest in data analytics tools to gain deeper insights into customer behavior. Utilize this data to make informed decisions on product placement, pricing, and marketing strategies.
5. In-Store Experience Enhancement
Investigate and enhance the in-store experience, considering factors such as store layout, ambiance, and product presentation. An inviting and immersive environment can positively impact customer perception and satisfaction.


by Karen Bassil | Apr 12, 2021 | Dashboard, Visualization
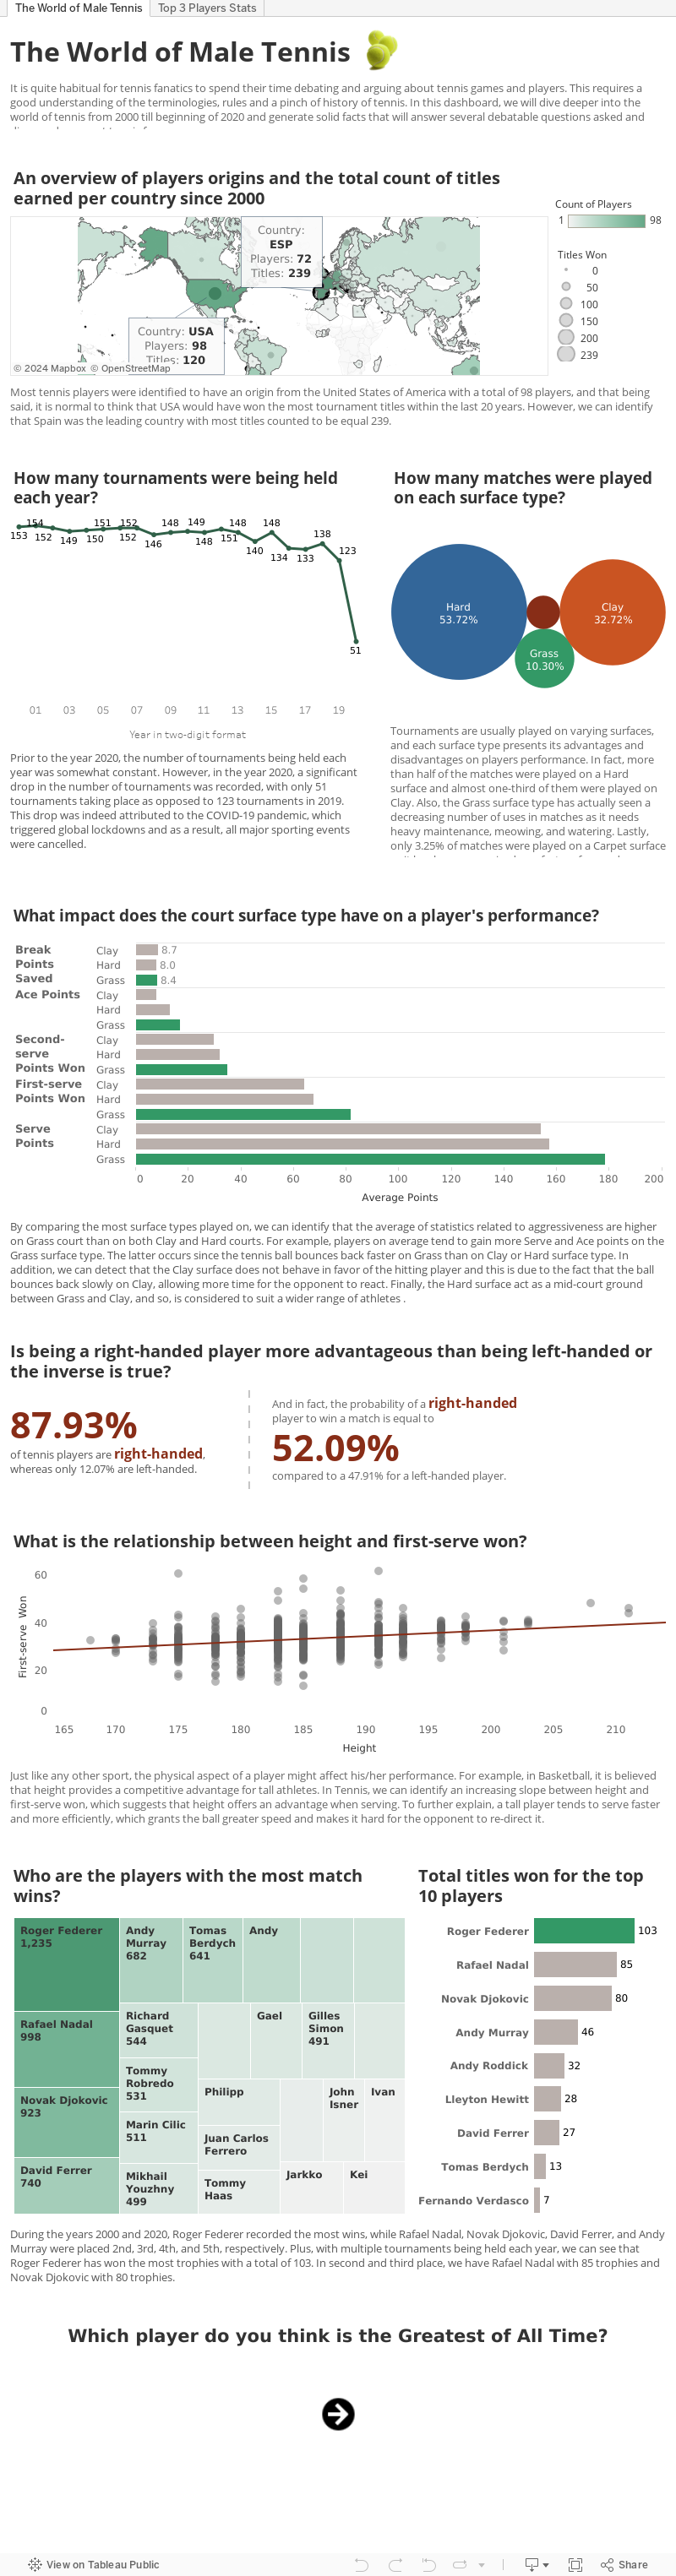
Tennis is an Olympic sport and is played at all levels of society, across all ages and practiced by many around the world. Tennis is played by millions of recreational players and is also a popular worldwide spectator sport. With the help of data covering all game metrics ranging from 2000 till the beginning of 2020, this project aims at generating some general insights about tennis, all while delving into the specifics of some of the most debated questions in the world of Tennis:
- Is a right handed player more advantageous than a left handed player?
- Does a player’s height impact their performance?
- Amongst the different types of fields (grass, clay, and hard), which player has the best performance and title wins?
- Who is the greatest Tennis player of all time?
This analysis is left open for debate among Tennis fans in the comments.
by Sirine Jaber | May 5, 2020 | Visualization
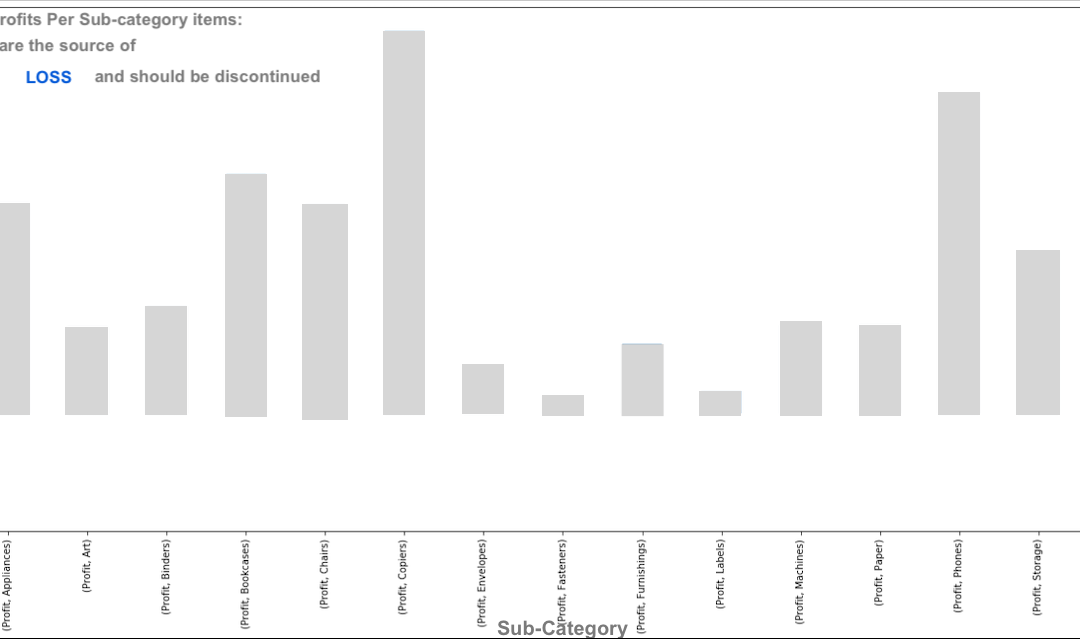
Looking at a super store data, managers are highly interested to have a clear view about their product lines and their relation to profits and losses.
For this reason a visualization of profits per product subcategories highlights the areas where high losses occur. This graph reflects the profits that each sub-category of items generates. It is clear that for this store, tables are losing and they are generating losses instead of profits. For this reason it is recommended to discontinue selling tables and Focus on other items generating high profits such as Copies and phones.