Navigating Insurance Challenges in Lebanon: A Strategic Roadmap
The insurance sector in Lebanon, like many of its economic facets, is navigating through a period of significant challenge and change. This crisis is rooted in political instability, economic downturns, and the aftermath of the Beirut port explosion in 2020, among other factors. These elements have collectively put unprecedented pressure on all sectors, including insurance, driving the need for strategic resilience and adaptation.
Lebanon’s insurance industry, historically robust and competitive within the region, has faced increasing pressures from several fronts. The devaluation of the Lebanese pound, hyperinflation, and the banking sector’s liquidity crisis have severely impacted the operational capabilities of insurance companies. Policyholders are finding it increasingly difficult to keep up with premium payments, while claims costs are rising due to the economic situation and inflation. Additionally, the regulatory framework and oversight of the insurance sector have been areas of concern, requiring enhancements to ensure stability and trust among policyholders.
Despite these challenges, the Lebanese insurance sector also showcases a remarkable capacity for resilience. Companies are exploring innovative strategies to navigate through the crisis, including digital transformation, product diversification, and revising pricing models to adapt to the economic context. Moreover, there’s an increasing focus on risk management and solvency to ensure long-term sustainability. This article showcases the portfolio insights of the company in the Property and Casualty department.
Balancing Premiums with Risk Exposure
Insurance is not a static field; risks evolve, and new risks emerge. Therefore, insurers must adapt by regularly reviewing their underwriting criteria, leveraging new data analytics technologies, and staying informed about changes in the environment that could affect the risk landscape. Furthermore, it’s vital for insurers to develop comprehensive risk mitigation strategies.
The emphasis on the importance of thorough underwriting before pricing an insurance policy cannot be overstated. Underwriting is the process where insurers assess and evaluate the risk associated with an insurance policy. The goal is to price the risk accurately, ensuring that premiums collected will cover the claims and the operational costs, while also allowing the insurer to make a profit.
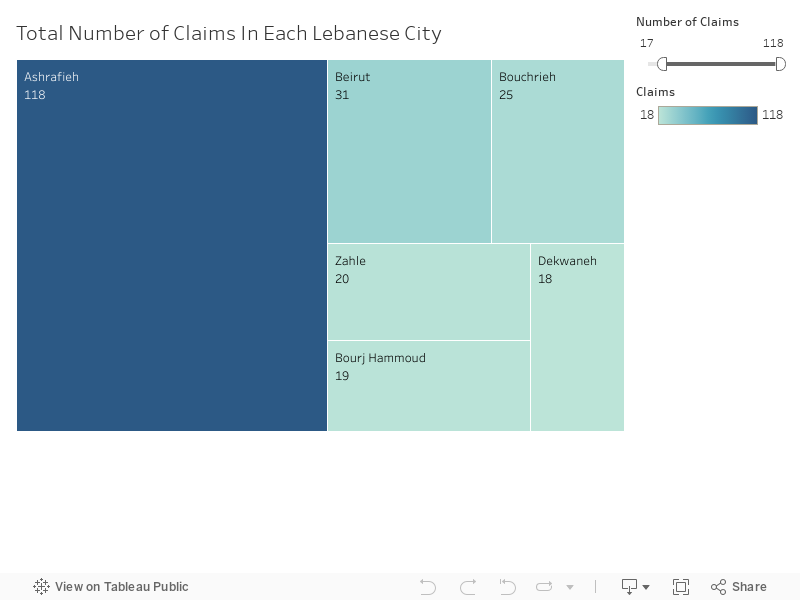
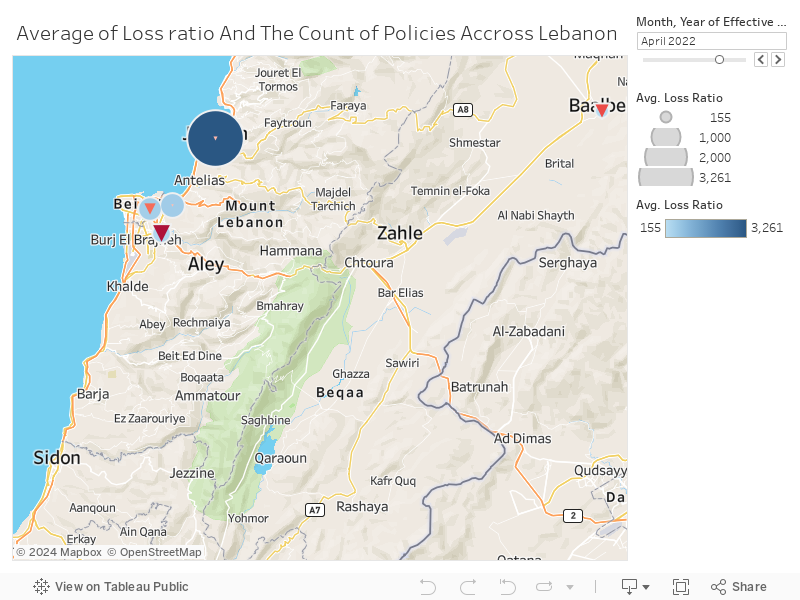
It is observed from regional data that the volume of insurance policies and the corresponding financial outcomes vary considerably. Some areas demonstrate a higher concentration of policies, indicating a robust customer base, while financial metrics suggest that premium levels do not consistently match up with the risks incurred. This variability highlights the importance of leveraging top-notch risk mitigation methods to enhance the sustainability and financial health of insurance operations.
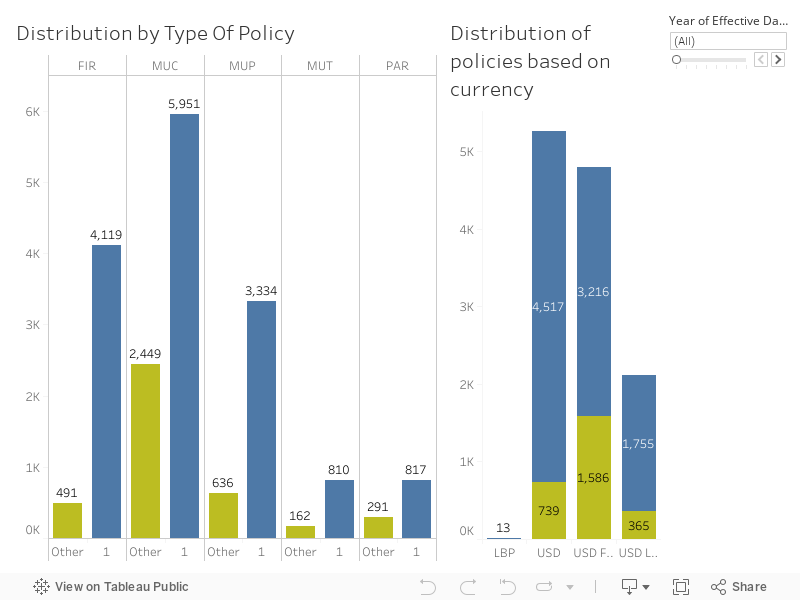
The data provides a clear view on the policies distribution within the company. The left graph, demonstrates the diversity in policy types offered, with ‘MUC’ related to all commercials type and emerging as the predominant category, accounting for nearly 6,000 policies in our portfolio. This indicates a robust demand for this particular insurance product line, suggesting that our underwriting efforts in this segment have been well-received by the market. In other hand the count of policeies issued from the head office is still significntly higehr than thos ein otehr branch suggesting taht and effort should be put to increase the roductivity there vene that during the past 5 years the policy has been increasing however the effort should be kept in order to maintain the portfolio of the company.
On the right, the second graph represent the Distribution of policies based on currency which presents a financial landscape shaped by currency dynamics, a crucial factor given Lebanon’s economic flux. The stark predominance of policies denominated nowadays is definitely the USD fresh keeping the LBP out of reach.This also reflects our strategic positioning to offer policies by providing a safeguard against hyperinflation and reinforcing the financial robustness of our portfolio.
Strategic Insurance Operations
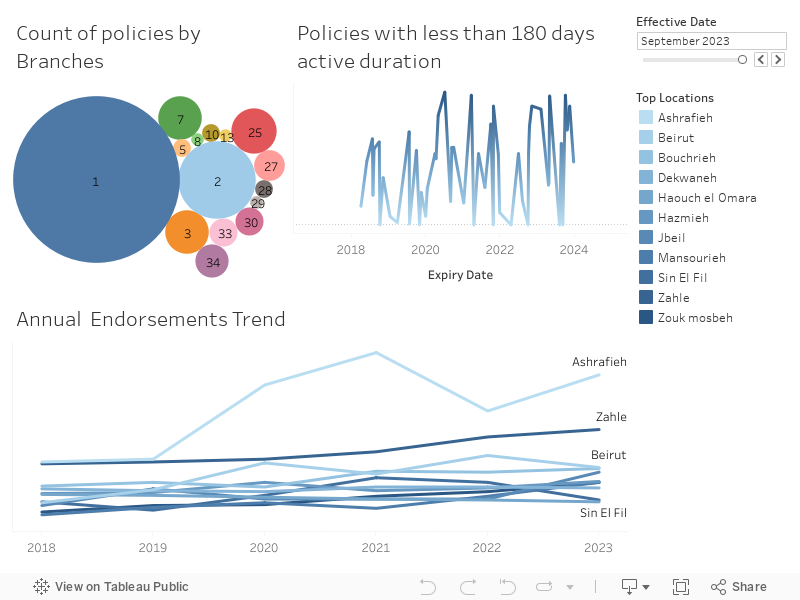
The company expanded its presence in Lebanon over the past years, establishing multiple branches to increase its portfolio. Despite the expansion, the headquarters significantly outperformed all other branches combined over the last five years, holding approximately 78% of the total policies.
The fluctuating trends of annual endorsements from 2018 to 2023 for the ten most insured risk locations, highlights the insurance behavior post the Beirut blast with a notable peak in Achrafieh and the strategic success reflected by the rising trend in Zahle. Complementing this, This comprehensive analysis underscores the importance of accurate data management and strategic branch placement in the dynamic landscape of insurance endorsements.
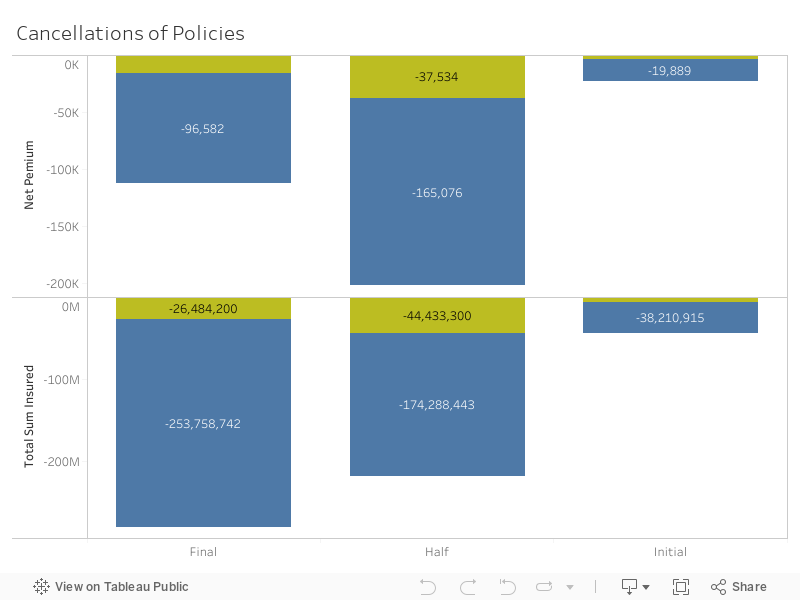
The analysis of short-term insurance policies has uncovered irregularities, especially policies with a recorded duration of zero days, pointing to possible data entry errors. This issue emphasizes the critical need for system improvements to ensure data accuracy and to implement a detailed tracking feature for the reasons behind policy cancellations. Such enhancements are particularly crucial in light of a recent incident involving a disputed policy issued in September 2023, which could have led to complications in claim processing.
Strategic Data-Driven Enhancements
To navigate the complexities of the Lebanese insurance market, it’s recommended to enhance system capabilities, focus on strategic locations with high engagement potential, and continuously analyze policy data to inform decision-making. With these strategies in place, the company is poised to better manage risks, optimize its portfolio, and maintain its leadership position in Lebanon’s insurance sector. The extensive data repositories maintained by insurance companies are invaluable for Data Analysts and Data Scientists. They provide a rich foundation for constructing sophisticated predictive models and developing automated tools that enhance efficiency and streamline daily operations effectively.
Imagine being a young teenager, just trying to navigate the ups and downs of growing up. Now picture facing daily taunts, threats, and even physical harm from your peers. This is the harsh reality for many adolescents and pre-adolescents who fall victim to bullying.
For a full two years, Johnny, a 13-year-old, suffered as his classmates treated him badly. They harassed him for money, forced him to drink unpleasant things like weeds and detergent-laced milk, physically assaulted him in the restroom, and even went so far as to put a string around his neck treating him around like a pet. When questioned about their actions, the bullies admitted they targeted Johnny simply because they found it entertaining! (newspaper clipping presented in Olweus,1993, p.7). (1)
This brief newspaper clipping paints a grim picture of the cruelty that children and adolescents can exhibit until our day towards each other under specific circumstances. It highlights the harrowing reality of life at school for a victimized student.
What makes it even harder is that bullying often happens behind closed doors or in hidden corners of the schoolyard, away from the prying eyes of adults. So, while teachers and parents may be doing their best to support their kids, they might not even realize that bullying is happening right under their noses.
This lack of awareness only adds fuel to the fire. Bullies continue their hurtful behavior unchecked, leaving their victims feeling isolated and alone. It’s like a silent epidemic, silently spreading its toxic effects without anyone noticing.
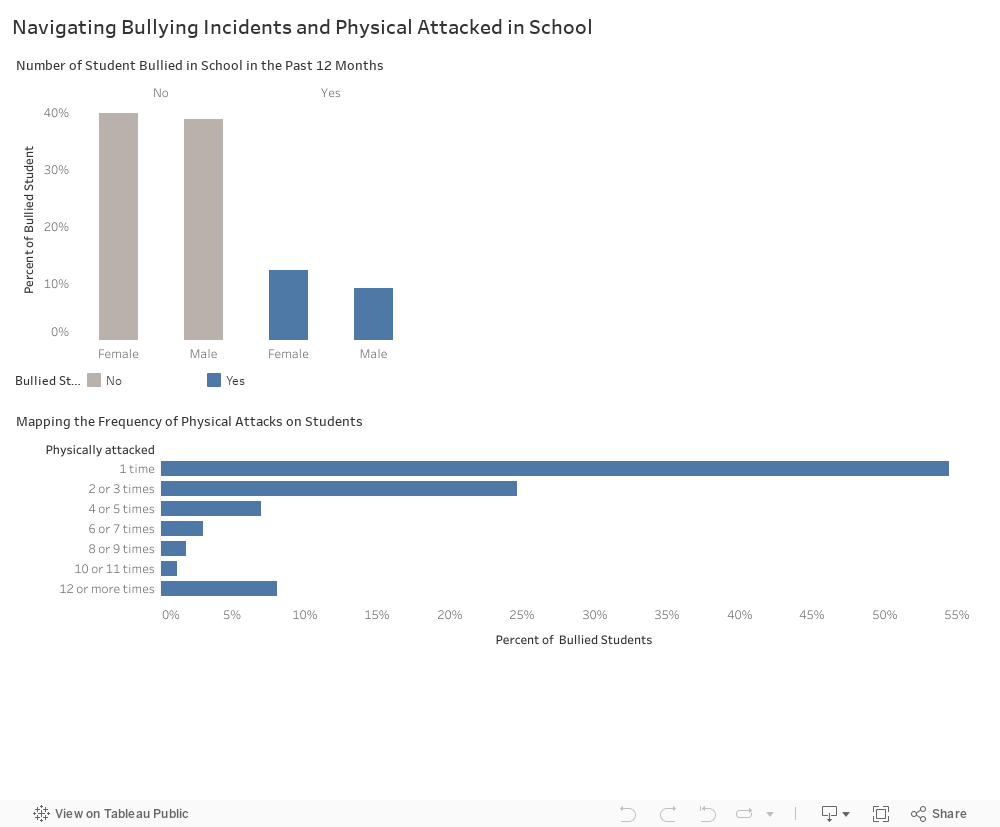
In 2018, a survey conducted in a school in Argentina shed light on the prevalence of bullying among students. The data revealed a concerning trend, highlighting the extent to which bullying was impacting the school community.
The presented graphs paint a vivid picture of the bullying landscape within the school. The Fist graph presents the stark reality of the number of bullied students identified in the survey. As we delve deeper into the data, the second graph provides a spatial perspective on the frequency of physical attacks experienced by students.
Understanding the Impact of Bullying
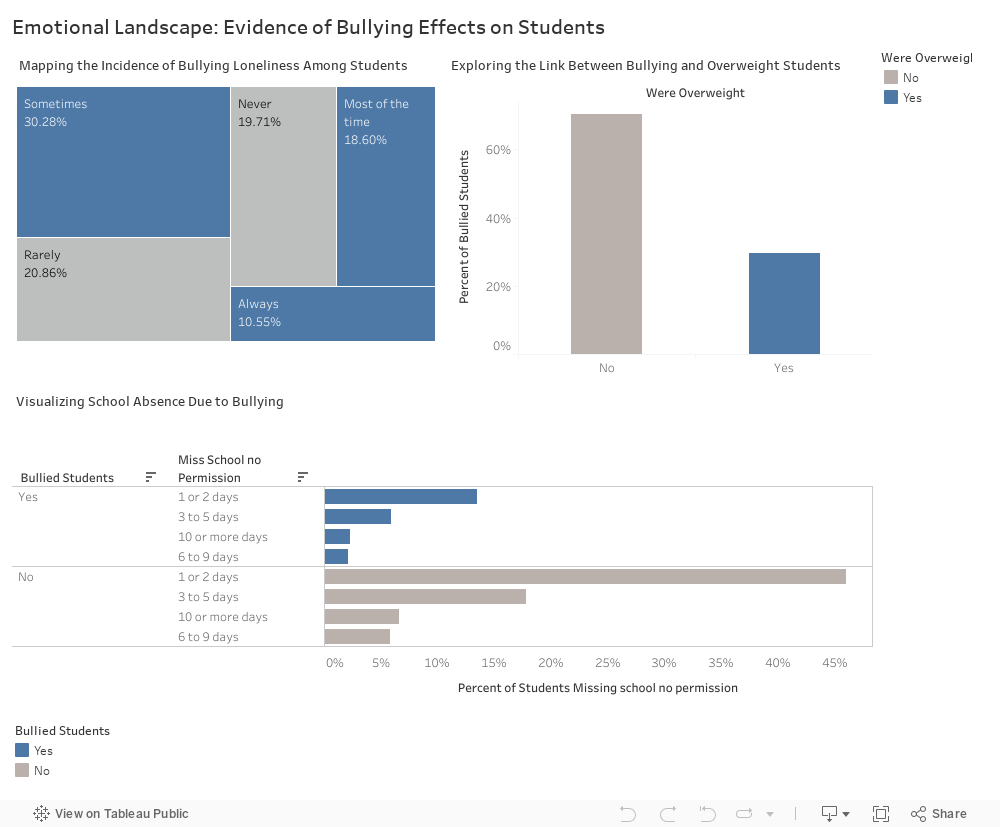
Bullying takes a heavy toll on Students. Its not just about the physical harm, it’s the emotional pain of feeling isolated and alone. Bullying can make it hard to focus in school, affecting grades and academic performance. It even impacts physical health, increasing the risk of issues like obesity due to stress.
<
Bullying Solutions: Creating Safe Spaces
Bullying remains a significant concern in schools, yet proactive measures can be taken to prevent and address it effectively. Here are several solutions that schools, parents, and students themselves can implement:
Schools should:
Promote kindness and empathy: Develop social-emotional learning programs that encourage students to appreciate diverse perspectives and treat one another with respect.
Cultivate a safe and inclusive environment: Foster a culture where students feel empowered to be themselves and report instances of bullying without fear of retaliation.
Empower bystanders: Provide students with the skills and confidence to intervene safely and effectively when they witness bullying.
Enforce clear consequences: Establish a robust anti-bullying policy with transparent consequences for engaging in bullying behavior.
Parents can:
Initiate open discussions about bullying: Educate children about what constitutes bullying and how to respond to it in a manner that prioritizes safety.
Boost their child’s self-esteem: Encourage participation in activities and hobbies that bolster their child’s self-confidence.
Maintain open lines of communication: Foster an environment where children feel comfortable discussing instances of bullying and seeking support when needed.
Collaborate with the school: Engage with school administration to advocate for policies and practices that promote a safe and inclusive environment.
Students can:
Report incidents of bullying: If experiencing bullying, confide in a trusted adult such as a teacher, counselor, or parent.
Avoid responding with aggression: Refrain from retaliating physically, as it may exacerbate the situation. Instead, remain composed and seek assistance.
Support peers: Intervene in a safe manner or report instances of bullying when witnessing them, and strive to build positive relationships with peers.
By collaborating effectively, schools, parents, and students can establish an environment where bullying is not tolerated, fostering a sense of safety and inclusivity for all.
Assessing Prevention Impact
Research demonstrates that both students and educators benefit from anti-bullying efforts in schools. A comprehensive review of studies on school-based programs shows that they effectively reduce bullying by around 20 to 23 percent and victimization by about 17 to 20 percent. (3)
Resources
Olweus, D. (1993). Bullying at school: What we know and what we can do. Oxford: Blackwell Publishers. (Published in Spanish in 1998 as Conductas de acoso y amenaza entre escolares. Madrid: Ediciones Morata.)
As per the United Nations World Food Programme (WFP) definition, food security guarantees access to adequate, safe, and nutritious food for all individuals consistently. Nevertheless, Lebanon faces an alarming surge in food insecurity amid profound economic difficulties. The nation’s dire economic crisis, marked by hyperinflation and a sharp devaluation of its currency, the Lebanese pound (LBP), has intensified the crisis.
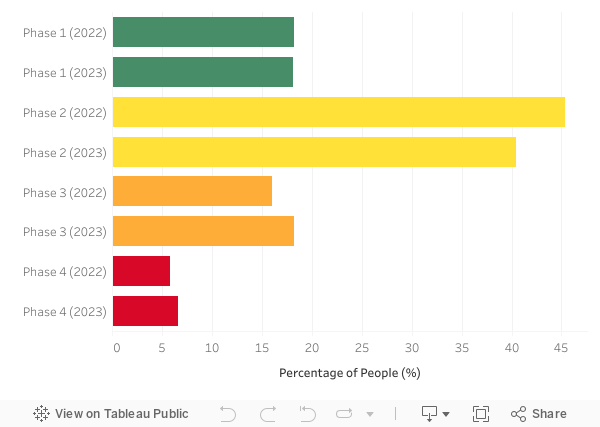
The Integrated Food Security Phase Classification (IPC) report on food insecurity distribution in Lebanon for the years 2022-2023 provides a comprehensive insight into the challenges faced by both Lebanese citizens and refugees in the country. With over 5 million records analyzed, individuals are categorized into four distinct phases based on their food security status:
Phase 1: people in Food Security
Phase 2: people in Stressed Conditions
Phase 3: people in Food Crisis
Phase 4: people in Emergency Situations
In 2022, 18.17% of the population were classified under Phase 1, indicating a secure food situation, while a significant proportion, 45.4%, were categorized as Phase 2, signaling mild stress. However, 16% were in Phase 3, facing a crisis, and 6% were in Phase 4, experiencing emergency conditions. By 2023, although Phase 1 remained stable, economic pressures resulted in a decrease in Phase 2 to 40.5%, while Phases 3 and 4 saw slight increases to 18.2% and 6.6%, respectively.
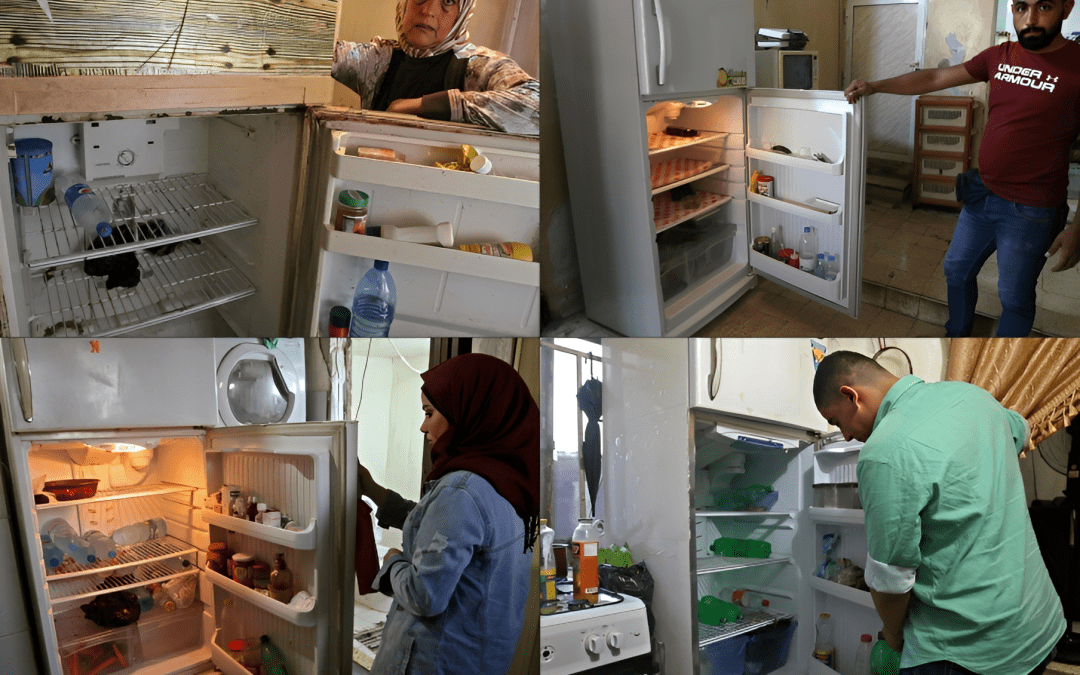
Additionally, in 2023, a staggering 1,412,000 individuals in Lebanon, classified under Phases 3 and 4, currently struggle withempty refrigerators, highlighting the severity of the food insecurity crisis.
Lebanon’s Economic Crisis and Soaring Food Prices
To contextualize the economic crisis, the exchange rate was relatively stable at around 1,507.5 LBP per US dollar in 2019. However, since then, it has drastically deteriorated, surpassing 90,000 LBP per US dollar in 2023, marking a staggering increase of approximately 5900%.
This rapid depreciation has had profound implications, particularly regarding the cost of living, notably in food prices. The soaring exchange rate has led to a surge in the prices of essential commodities, making it increasingly challenging for Lebanese citizens to afford an adequate and nutritious diet.
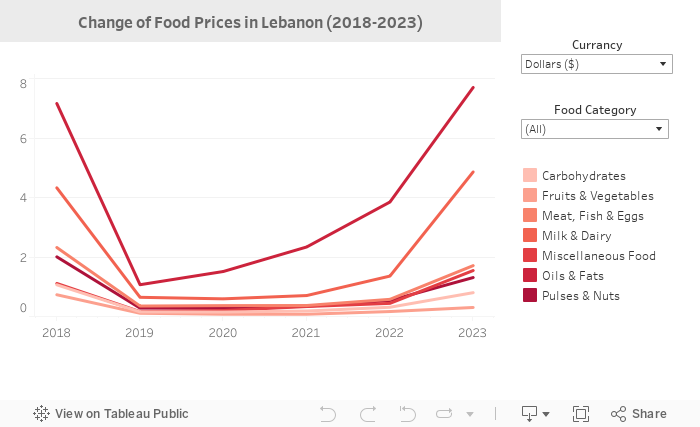
In light of these economic challenges, understanding the evolution of food prices over the years in Lebanon is crucial. According to data from the Food and Agriculture Organization of the United Nations (FAOSTAT), there have been notable trends in food prices. Since the onset of inflation, prices in LBP have consistently increased, reflecting the economic instability gripping the nation. However, prices in US dollars initially decreased, but eventually surged back to normal levels. However, it’s worth noting that while prices may seem lower in USD, they remain significantly high when converted back to LBP.
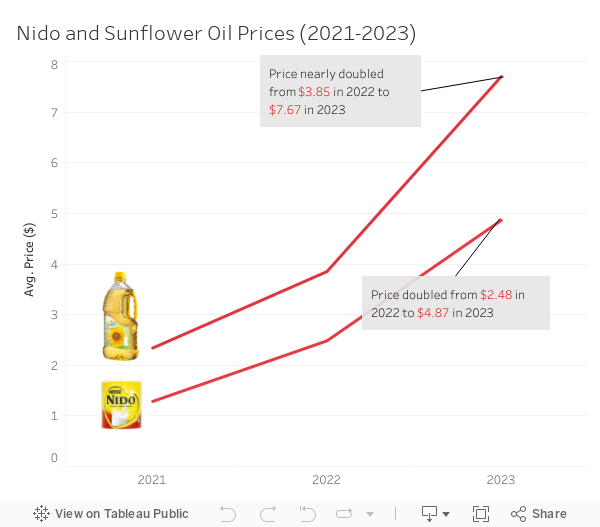
Over the past three years, prices have surged dramatically, with a staggering 250% increase in most cases. Notably, from 2022 to 2023 alone, prices doubled, underscoring the swift and significant escalation in costs. For instance, the price of cooking sunflower oil surged from $2.30 in 2021 to $3.85 in 2022, then doubled to $7.70 in 2023. Similarly, milk powder “Nido” saw a notable rise from $0.70 in 2021 to $1.30 in 2022, then sharply increased to $4.80 in 2023.
Highlighting the Gap
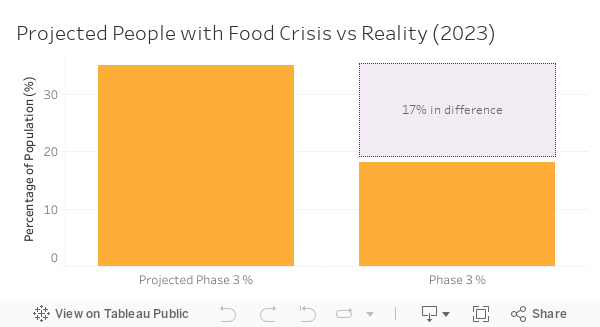
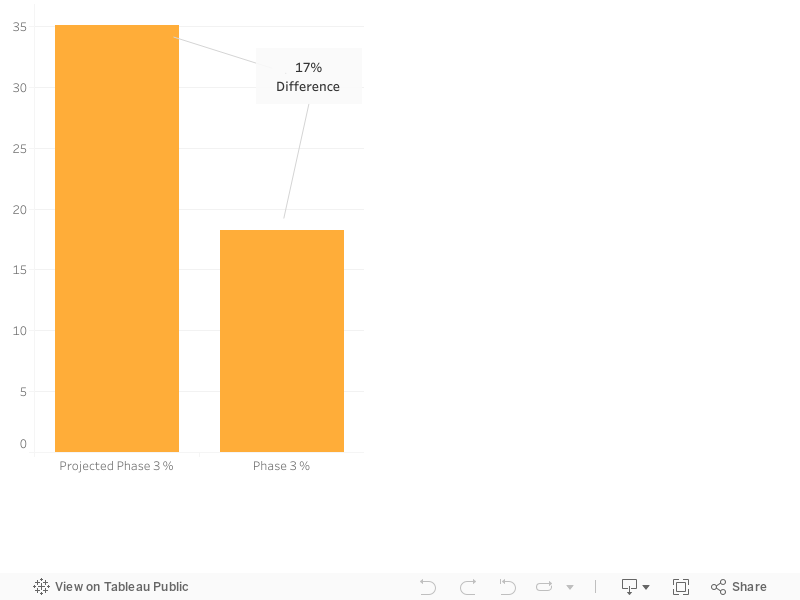
As observed, prices reached a peak in the previous three years, particularly between 2022 and 2023. However, it raises a question: why didn’t the food insecurity rates increase accordingly? This was a challenge faced by the Integrated Food Security Phase Classification (IPC). In 2022, after gathering data on food insecurity in Lebanon, it was projected that the percentage of people in Food Crisis (Phase 3) would rise to 35%, marking a 19% increase in the wake of soaring food prices. However, one year later, the percentage of people in Food Crisis only increased by 2%. This discrepancy prompts us to question how, amidst doubling prices, such a modest increase occurred.
Filling the Gap: Minimum Wage Increase
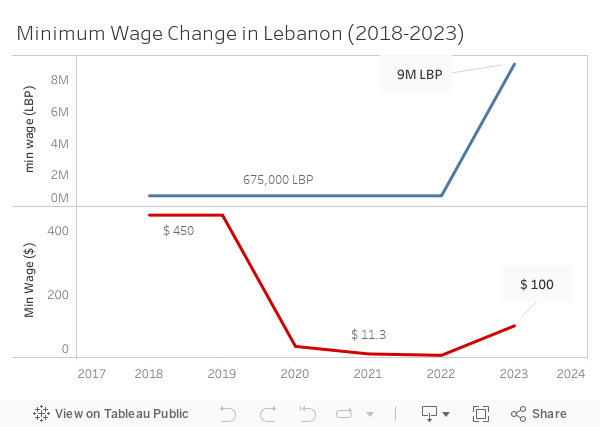
The apparent disparity between the significant rise in food prices, which doubled from 2022 to 2023, and the relatively modest increase in food insecurity phases in Lebanon can be attributed to several factors. One significant factor is the increase in the minimum wage in April 18, 2023, from LL675,000 to $100. Prior to 2019, this minimum wage was equivalent to $450, set at LL675,000 at the then-official rate of LL1,507.5. This increase helped to mitigate the effects of soaring food costs and prevent a more drastic escalation in food insecurity levels.
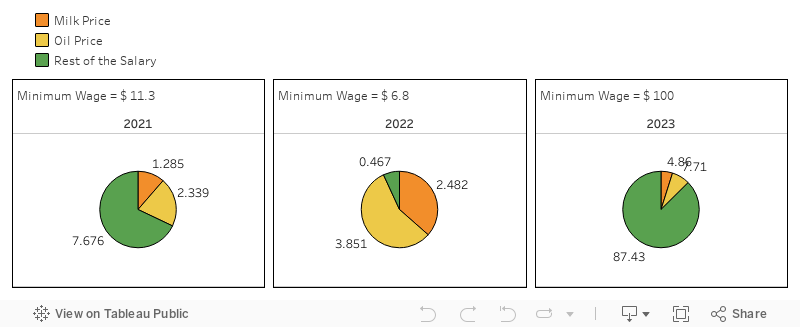
In 2021, if someone in Lebanon earning the minimum wage of $11.25 wanted to buy both Nido and sunflower oil, costing about $3 total ($2.30 for oil and $0.70 for milk), it would be 26% of their salary. By 2022, with the total cost rising to $5.15 ($3.85 for oil and $2.48 for milk), it would represent 74% of their $6.75 salary. However, in 2023, despite the total cost doubling to $12.50 ($7.70 for oil and $4.80 for milk), if the person is earning $100, these purchases would only account for 13% of their salary. This indicates a significant decrease in the portion of salary spent on these items, despite prices doubling from 2022 to 2023.
Raising the Wage, the case of USA
The “Raise the Wage Act, S. 2488 of 2023 in the USA” proposes gradually increasing the federal minimum wage to $15 by 2024, starting with a raise to $8.55 in 2019. This hike could notably reduce nationwide food insecurity, leading to approximately 1.2 million households attaining food security. Additionally, 1 million households experienced an increase in their food security.
Lebanon has the opportunity to draw lessons from this policy to tackle its own socioeconomic challenges. Recognizing the strong correlation between the minimum wage and food insecurity, Lebanon could adopt a similar strategy. By gradually increasing the minimum wage, Lebanon could alleviate financial strains and enhance access to vital resources for its households. This move would promote economic stability and the overall well-being of the country.
Throughout my childhood and teenage years, social media played a pivotal role in my life. It controlled how I think, what I do, and who I am friends with. I felt depressed and did not know why or how to stop it. As a young teenager, I wanted to prove my independence, which is why I decided to take matters into my own hands. That is when I realized social media is somehow linked to the feelings I am getting, and this was when I decided to change my lifestyle and approach towards it. Over the past 10 years, I have been able to take control of my life, by decreasing social media usage and taking control over it, and in this post, I will be showing you how.
Mental Health and Depression
Mental health is something that, at one point in history, was not discussed enough and was seen as a stigma. Today, mental health is highlighted more than ever before. Specifically, disorders such as depression are more accepted in our societies.
That being said, studies show that depression has been at its highest since 2015 among US citizens[1]. Not only that, but another alarming fact is that “About 7 out of every hundred men and 1 out of every hundred women who have been diagnosed with depression in their lifetime will go on to complete suicide. The risk of suicide in people with major depression is about 20 times that of the general population.” [2]
This begs the question: What is causing this drastic change?
The Big Question
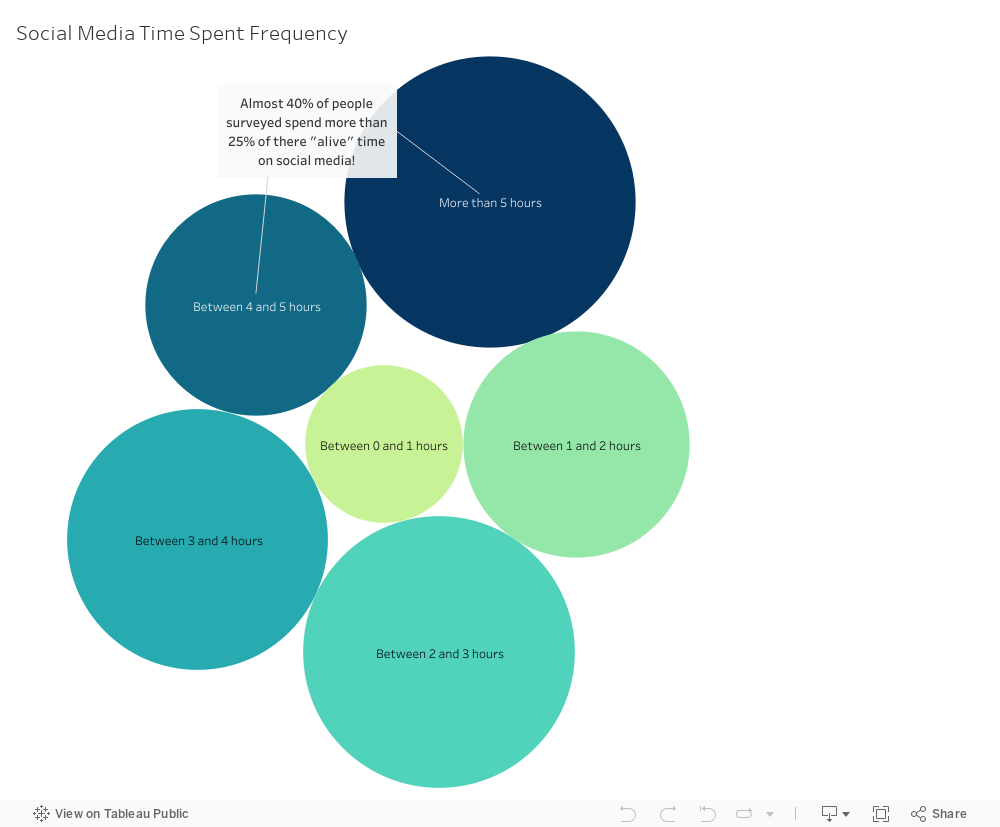
Looking at a survey conducted for over 450 people, we can see that more than 40% of those people spend more than 15% of their day on social media. The average person sleeps around 8 hours. So more realistically, those people spend 25% of their timeawake on social media.
So, the real question becomes:
How significant is the effect of social media on consumers’ mental health, and more specifically, on causing depression?
What I was Feeling is Real
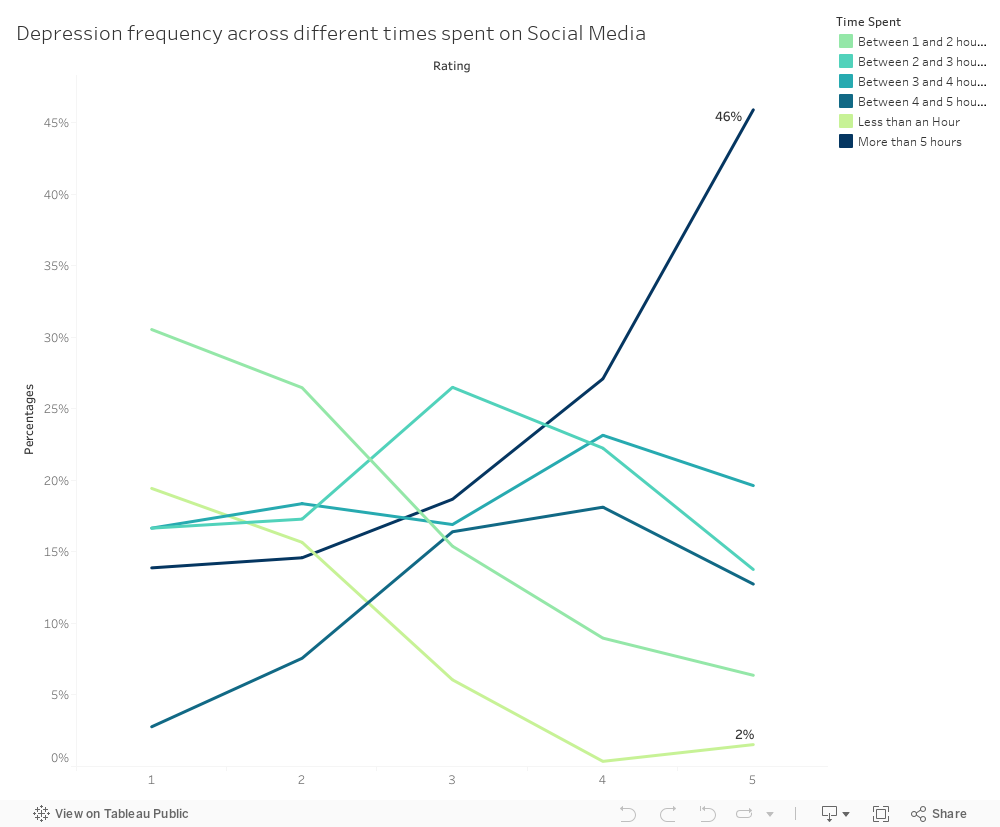
As it is evident in the below visualization, people who spend more time on social media reported a 43%, very frequent level of depression, compared to 2% for people who spend less than 1 hour on social media (And there is a clear distinction, with an upward trend, from one “Time Spent” category to the other). This raises a red flag; more than 40% of the people used social media for more than 4 hours, and on average, more than 50% of those people have reported frequent/very frequent depression. Although this is a sample of more than 400 people, imagine the world population scenario!
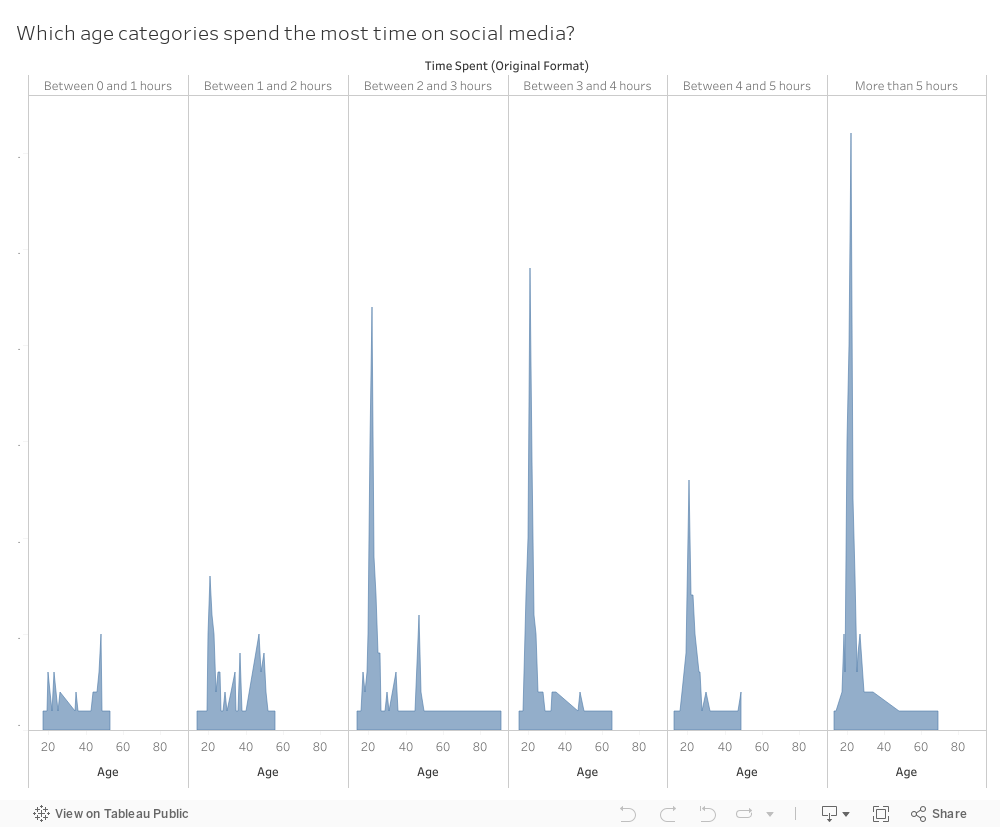
Not only that, but research and evidence show that people in the age category of 18 to 24 have been identified to be the most depressed among all age groups. Something that is crystal clear in visualization 3.
The Simple Solution: Decrease your social media time!
But as a user who was once stuck in the loop, I can definitely say that it’s not that simple, is it?
The Realistic Solution
In reality, you need to build the right habits, over time. Nothing happens overnight, which is why most people try and fail time and time again. The process took me 10 years! Now that might be a long period and this might vary from person to person but some caviats and lessons learned lead me to come up with the following set of recommendations:
Keep Social Media out of the bedroom: Most people sleep with a phone in their hand and wake up to instagram reels. What you need to do is not let social media be the last thing you think of before you sleep and as soon as you wake up, because how you sleep and wake up shapes how your night and day flow.
Don’t mindlessly scroll: Whenever you feel like you are about to open TikTok and start scrolling for no reason, take a deep breath, pause, and think. Don’t let your inner social media addict take over.
Go out for walks without your phone:Going out without thinking about what is happening on your feed allows you to relax and think about your real world concerns.
Monitor your screen time: Most social media apps allow you to do so, and you should. This helps you realize how much you’ve spent and allows you to incrementally decrease the time you spend until you are no longer a 4+ hours spender.
My Final Thoughts:
Take it from someone who walked the walk, losing your social media dependency, decreasing your depression, and consequently living a better life is not a one day journey. It’s a long, bumpy one. Yet, the outcome is definitely a positive one. So start today, and you will reap the benefits.
Fact Sheet: Some Facts About Suicide and Depression.” Connecticut General Assembly, n.d., https://www.cga.ct.gov/asaferconnecticut/tmy/0129/Some%20Facts%20About%20Suicide%20and%20Depression%20-%20Article.pdf.
“Prevalence of Depression and Anxiety Symptoms – United States, 2019–2020.” Centers for Disease Control and Prevention, 18 June 2021, https://www.cdc.gov/mmwr/volumes/72/wr/mm7224a1.htm#:~:text=The%20age%2Dstandardized%20prevalence%20of%20depression%20among%20U.S.%20adults%20was,%E2%89%A565%20years%20(14.2%25).
“Urbanization” is a problem that many countries suffer from. It led to drastic demographic changes that led to negative effects in terms of political , social , and economical aspects. Many governments struggle to solve the issue of high density populated area and find ways to shift this density to the skirts of cities in order to decrease stress on resources within the city bounds.
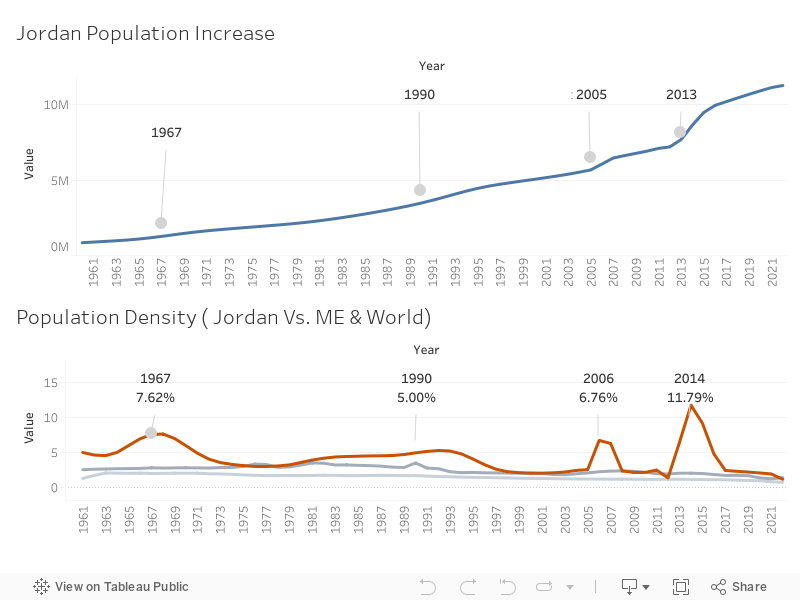
Jordan , is one of these countries who struggled with multiple refugees waves due to political instability in neighboring countries , started in 1948, then 1967 , 1990, 2003, and 2011 . in all of these waves the government was not ready to absorb the impact of sudden increase in population , especially in major cities like Amman, Irbid and Al Zarqa, which led to an increasing housing deficit in the past decades.
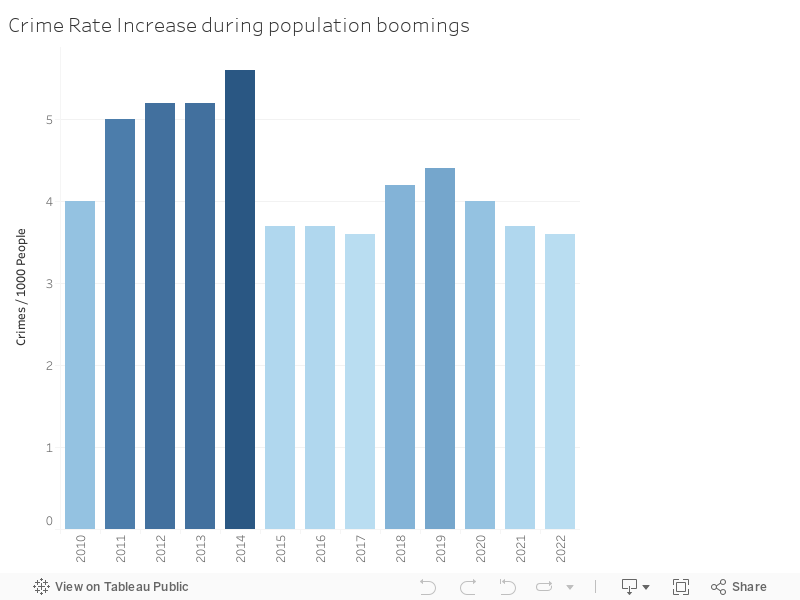
This sudden increase in population and the housing deficit is one of key factors in harming the social context of any community, we can realize that from crime rate increase in the same period of time.
Government Role
Jordanian government contributed in providing households since 1965 by initiating multiple institutions such as General Corporation for Housing and Urban Development (HUDC), Housing Bank and many saving funds . in 1996 the government issues the Housing Sector Restructuring Project which succeeded in providing housing units across the country and according to population growth in different cities. Unfortunately these efforts was stopped in 2010 and substituted to supporting demand instead of supporting supply, the HUDC role was shrink to providing empty land slots with minimum infrastructure, which created many vacant underdeveloped projects around the Jordanian cities.
Government contribution in supplying housing units dropped to 1%, which led to sudden increase in deficit by more than 45,000 units , ( 6 million square meters of apartments , of an average 130 sqm per apartment ) . Most of government contribution was directed to low-income sector, which the private sector did not focused on. In 2018 private sector contributed in 31% only of the housing deficit in declination than 2016 were it contributed in 54% of the deficit.
Housing Distribution
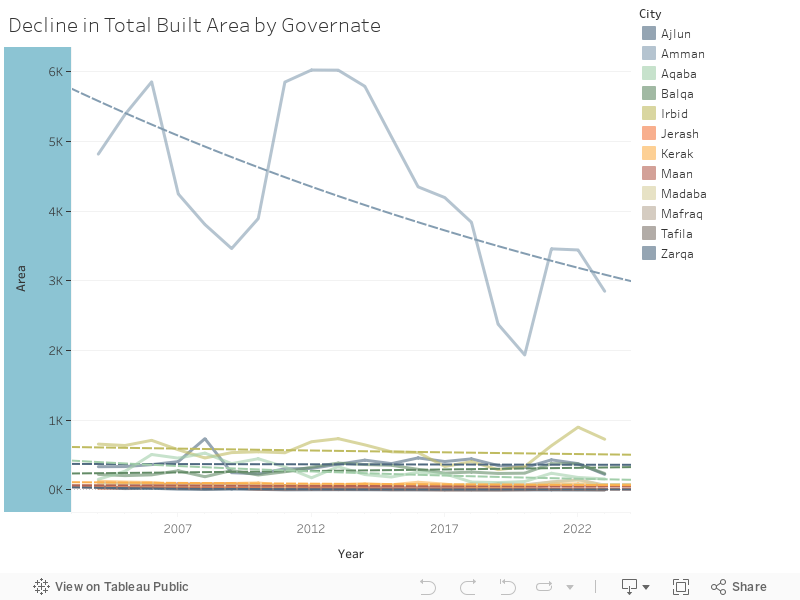
Housing distribution is a major indicator on how the government is responding to housing deficit and population increase, according to data from Department of Statistics ( DOS ) 61% of housing construction is concentrated in only three Major cities ( Amman, Irbid, Al Zarqa) , 45% are in Amman alone ( 1,072,559 house ) . This emphasize the gap between the capital and other cities , in a look on the housing distribution map we can see the unequal distribution of housing between different Governates.
New Urban Clusters
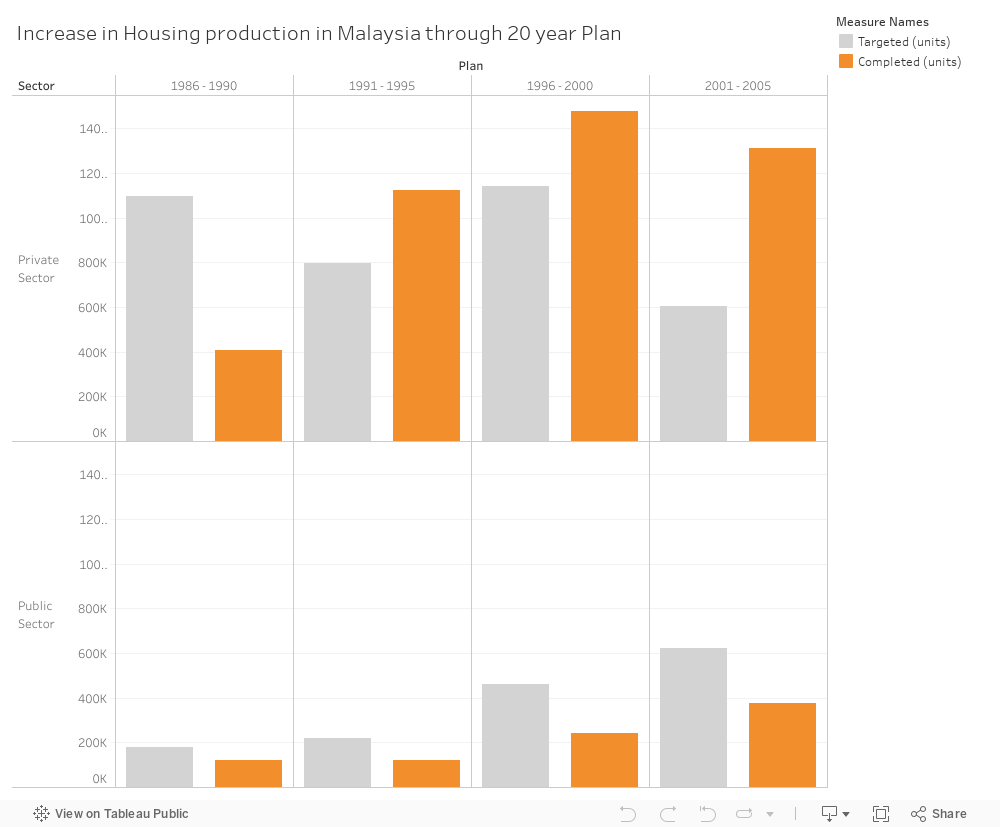
As a solution to unequal distribution of housing across a country , many governments focused on creating Urban clusters outside major cities , either to absorb population density or to decrease stress on infrastructure and facilities , a good example on that is the Malaysian case study. The government of Malaysia developed a 20 year plan which was updated every five year , The government was involved in providing incentives on both sides ( supply & demand ) It created houses for low income families in partnership with private sector by creating urban clusters with full services ( fire & rescue , libraries, information services, broadcasting, sports and cultural facilities ) as well as family and community centers in order to improve general well-being of the people.(1)
Recommendations
It is important to Jordan to initiate Housing programs on a national level which collect data that helps in forecasts for housing demand , and to fulfil this demand through Private Public Partnerships Projects that target low-income housing especially in governates outside Amman , Irbid & Zarqa.
Imagine waking up every day gripped by the fear of succumbing to poor healthcare, a result of your country’s negligence.
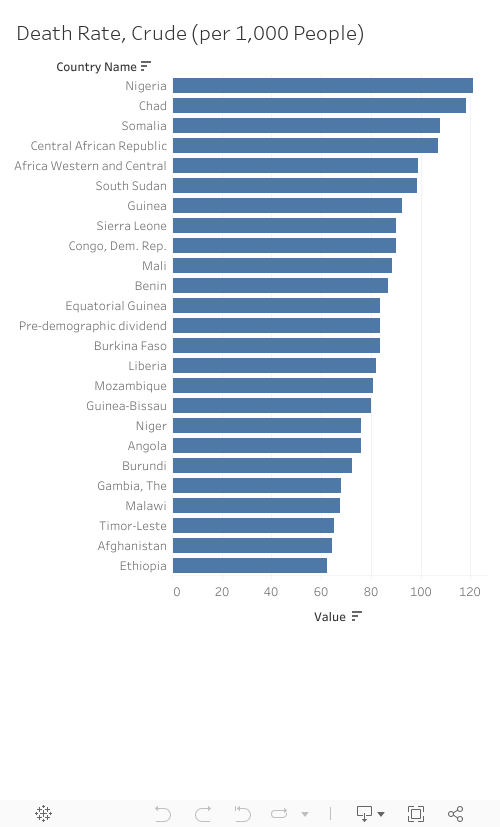
Chukwudi, a 10-year-old Nigerian battling HIV in a nation with the world’s highest mortality rate (164.24/1000 people). Is his fear justified? And what measures can his country take to alleviate his plight?
Identifying the Root Causes
Let’s delve into the factors contributing to this alarming mortality rate.
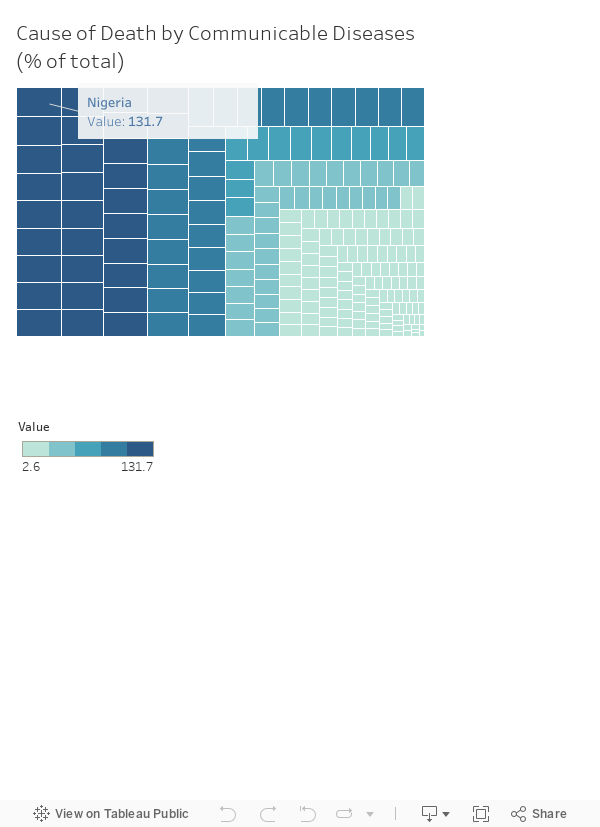
Nigeria bears the burden of communicable diseases, leading to an unprecedented death toll.
Is this merely coincidence?
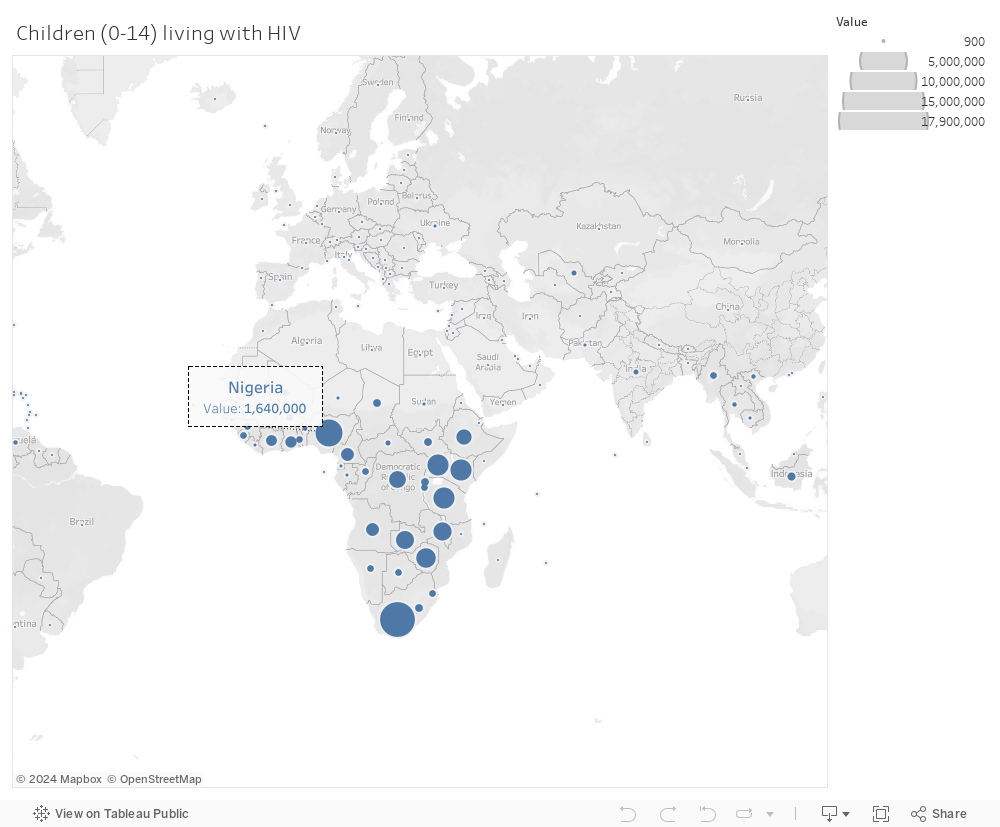
Upon examining the rate of HIV transmission among children aged 0 to 14, it’s disheartening to discover Nigeria topping the list once again (second place after South Africa).
But why?
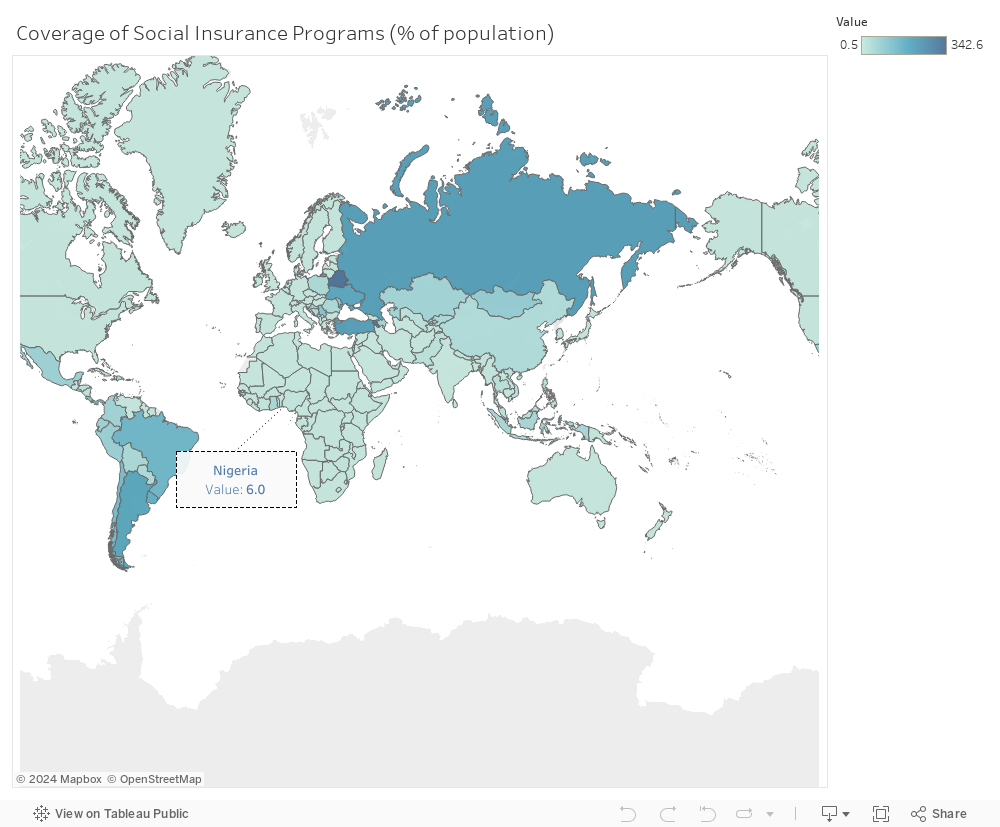
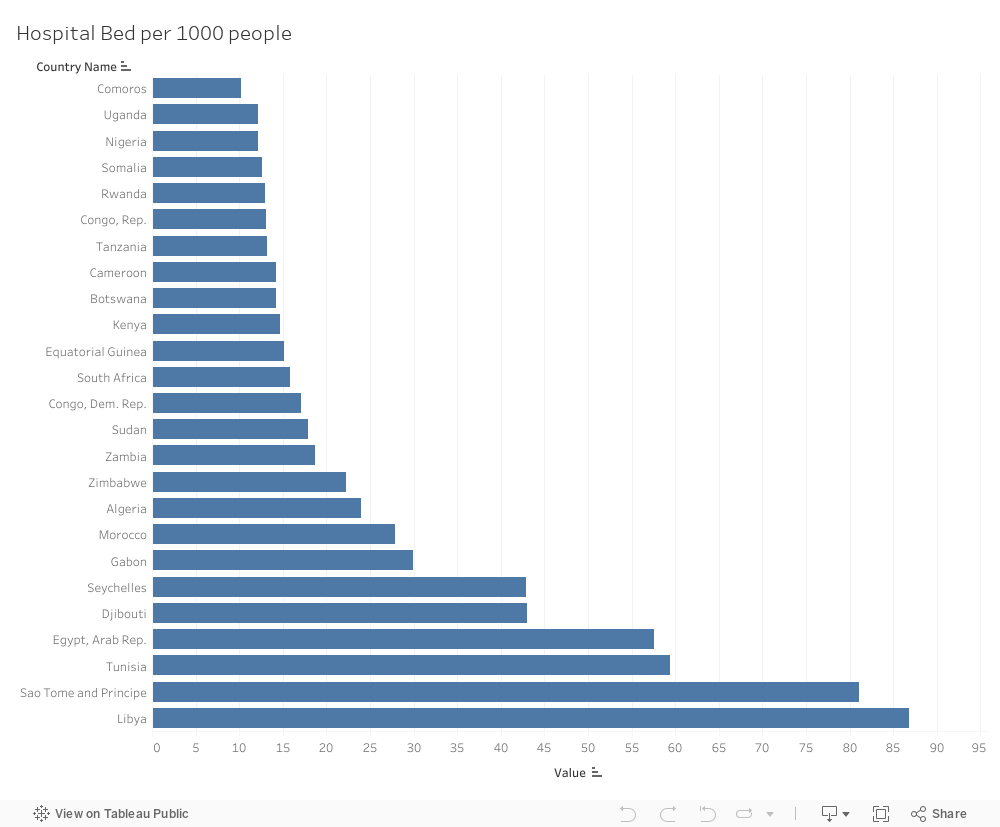
Having pinpointed the primary cause of this high death ratio, let’s explore why Nigeria’s healthcare system remains deficient. While insurance coverage remains dismally low (6% of population), a common plight across many African countries, Nigeria stands out for ranking third-lowest in hospital bed availability on the continent (12.14 per 1000 people), reflecting a dire lack of medical infrastructure.
Proposing Effective Solutions
Amidst these challenges, what potential solutions could prove effective?
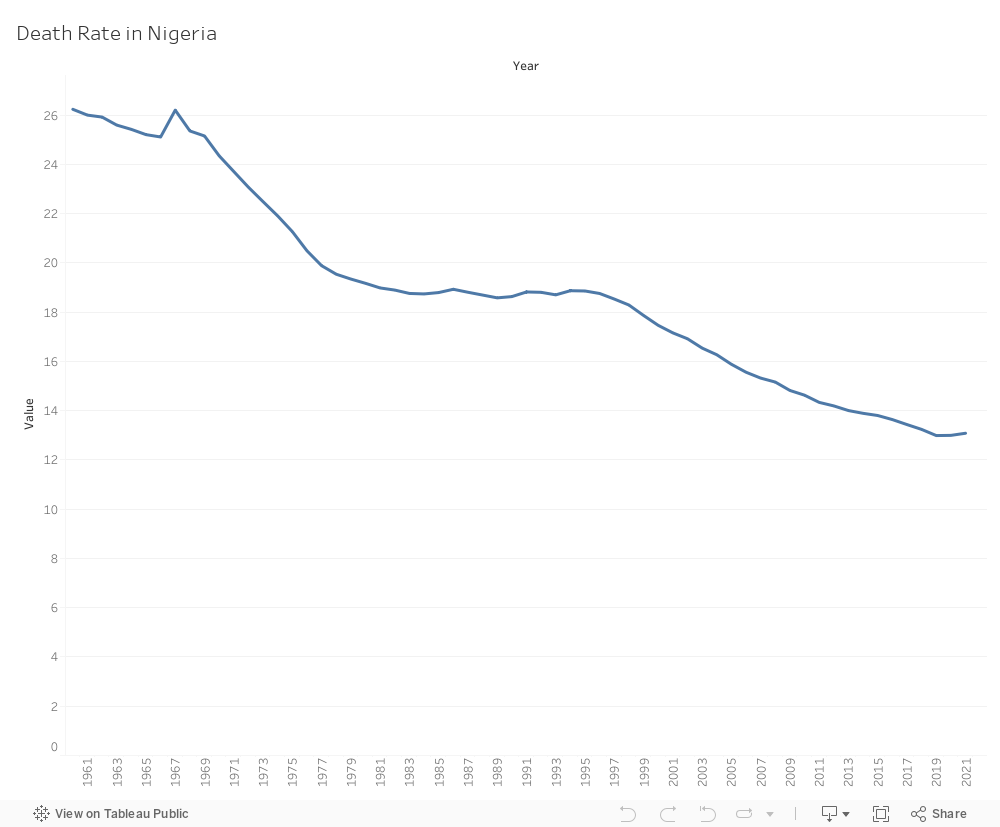
Over the years, Nigeria has made strides in reducing its death rate, reaching 13.1 per 1000 persons in 2021, primarily through targeted actions such as immunization campaigns, HIV/AIDS prevention and treatment programs, malaria control initiatives, tuberculosis (TB) control efforts, and partnerships with international organizations and NGOs. However, this progress falls short of the global target of 7.7 per 1000 persons by 2020.
Recommendations
To bdeveloping the healthcare workforce, enhancing access to medicines and equipment, integrating technology, fostering more public-private partnerships (PPPs), and reforming healthcare financing.
With Nigeria’s abundant resources, it is time to overcome these healthcare challenges and provide its people with the peace and security they deserve to lead healthier lives.uild upon this momentum, it is imperative to intensify efforts and implement additional measures, including investing in healthcare infrastructure,