The United States of America (USA) is home to more international immigrants than any other country in the world. In fact, the USA has more international immigrants than Germany, Saudi Arabia, Russia and the United Kingdom combined. You, I, and hundreds of students reading this blog are in the midst of crafting our career paths, where many have the aspiration of finding their dream job or pursuing a PhD in the USA. When you reach this point, you start thinking about what company or university to apply to, and your first hope is to get accepted to the university or job you applied for. However, this acceptance would be pending your visa acceptance. This is the stage that many people find to be the most challenging: getting a visa to the US.
The American dream has been the focus of attention for many visa applicants; as they are seeking better work opportunities, liberty, democracy, and equality. However, behind this pursuit lies a complex factor that shapes the final status of the visa application, as applicants are not seen as equal in the eyes of USA visa employees. Many of an applicant’s uncontrollable demographic characteristics determine the acceptance probability of his application. For example, being from Micronesia gives a 100% rate of the visa being denied. In this blog post, controllable characteristics will be analyzed and visualized to showcase the optimal employee profile that is more likely to be granted a US visa. This blog post will focus on immigrant visas, with a specific emphasis on those related to employees. Using data driven analysis and exploration, the key influencers affecting the US visa acceptance will be explored, and recommendations will be given to solve the ongoing problems facing the US visa application acceptance.
Unlocking Opportunities: Understanding U.S. Work Visas
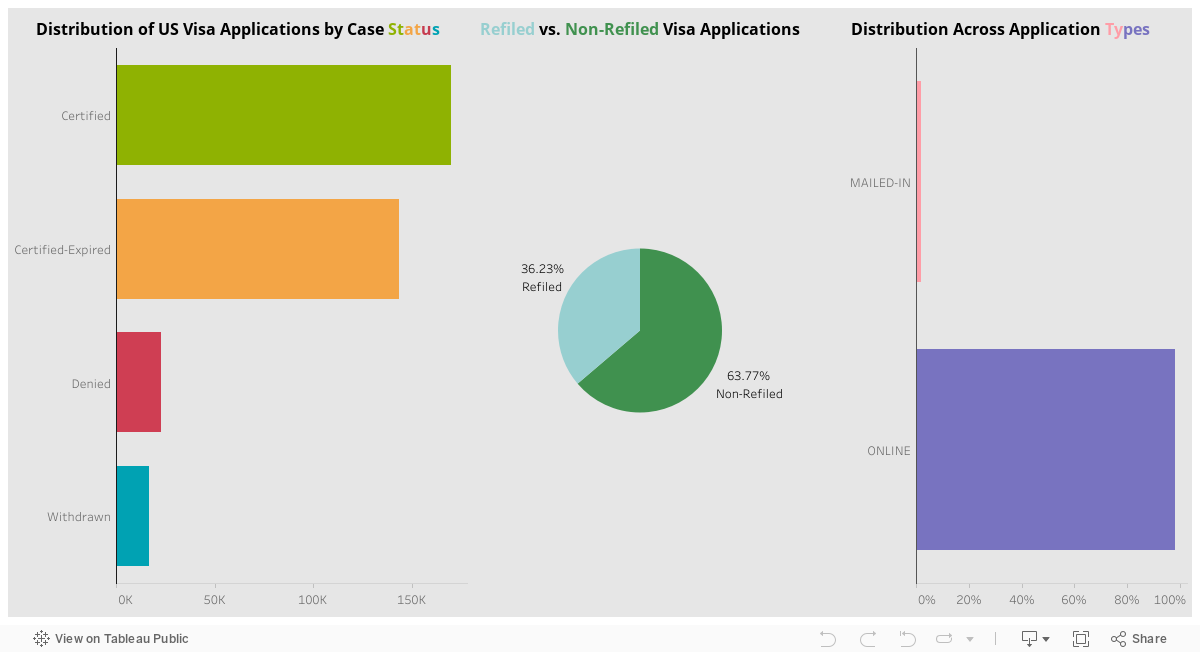
In the following dashboard, you have the option to filter through various visualizations by selecting different case statuses, “refiled” or “non-refiled,” and application types. The initial visualization offers a quick overview of certification rates within the dataset, highlighting that a substantial number of applications, specifically 170,126, have received certification. In contrast, a smaller portion, only 22,912 applications, has been denied. These figures suggest an encouraging trend in the certification process, pointing towards a favorable environment for visa approvals. The positive trend observed in the dataset may have broader policy implications. It could suggest that existing visa policies or recent changes have contributed to a more favorable climate for applicants.
The second visualization delves into the refiled applications, showcasing that 36.23% of submissions have undergone the refile process, while the majority, 63.77%, have not been refiled. This insight could prompt further investigation into the reasons behind refiling and provide valuable information for refining application procedures.
In the third visualization, when visualizing the channels through which applications are submitted, it is evident that a vast majority, 98.4%, are completed online, while a smaller fraction, 1.6%, opts for mailing in their applications. This emphasizes the dominance of digital submissions and suggests an opportunity to optimize online processes.
Three Key Requirements: The Foundation for Visa Success
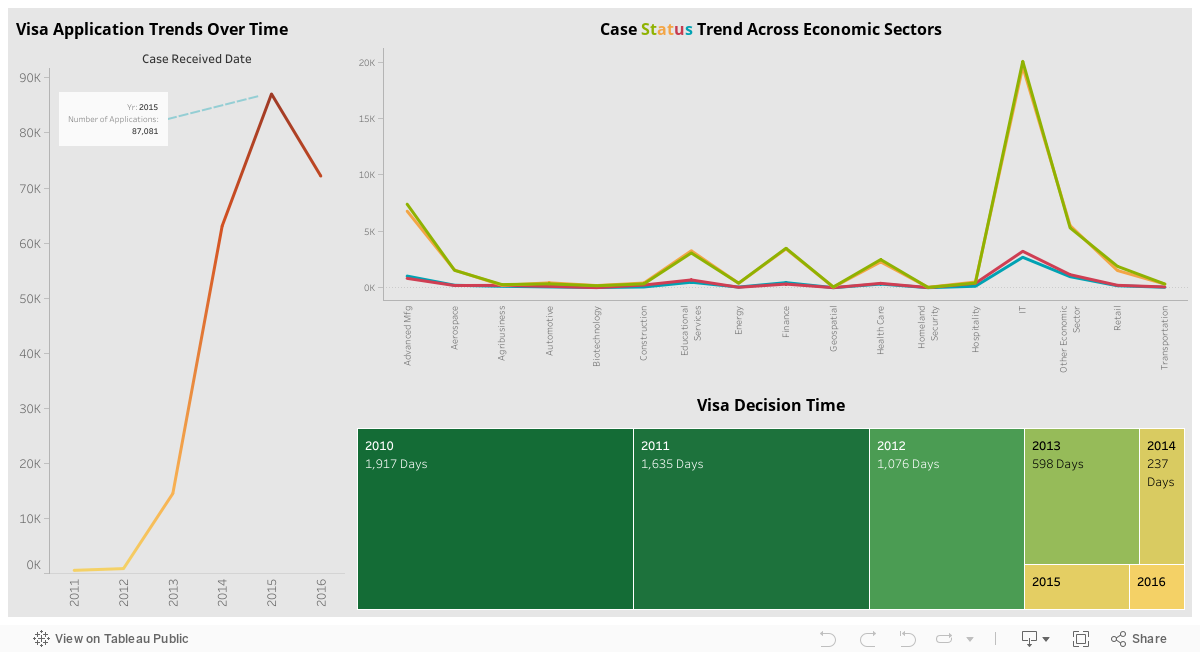
The first visual below tracks the number of received visa applications over the years. Notably, there’s a growth trend from 2011 to 2015, peaking at 87,081 applications. However, the trend reverses in 2016, with a decline to 72,171 applications. This temporal analysis invites exploration into the factors influencing application fluctuations.
Highlighting sector-specific trends, the second visual indicates that the IT sector consistently holds the peak for all case statuses. This insight can guide resource allocation, policy adjustments, or sector-specific considerations to further streamline visa processing.
The third visualization focuses on the duration of visa decisions over time. It unveils a significant decrease from 2010, where decisions took 191.7 days on average, to 2016, where the duration plummeted to 96 days. This trend suggests an improvement in processing efficiency and responsiveness.
In this dashboard, the aim is to dig deeper within the dataset to draw further insights into the optimal applicant profile.
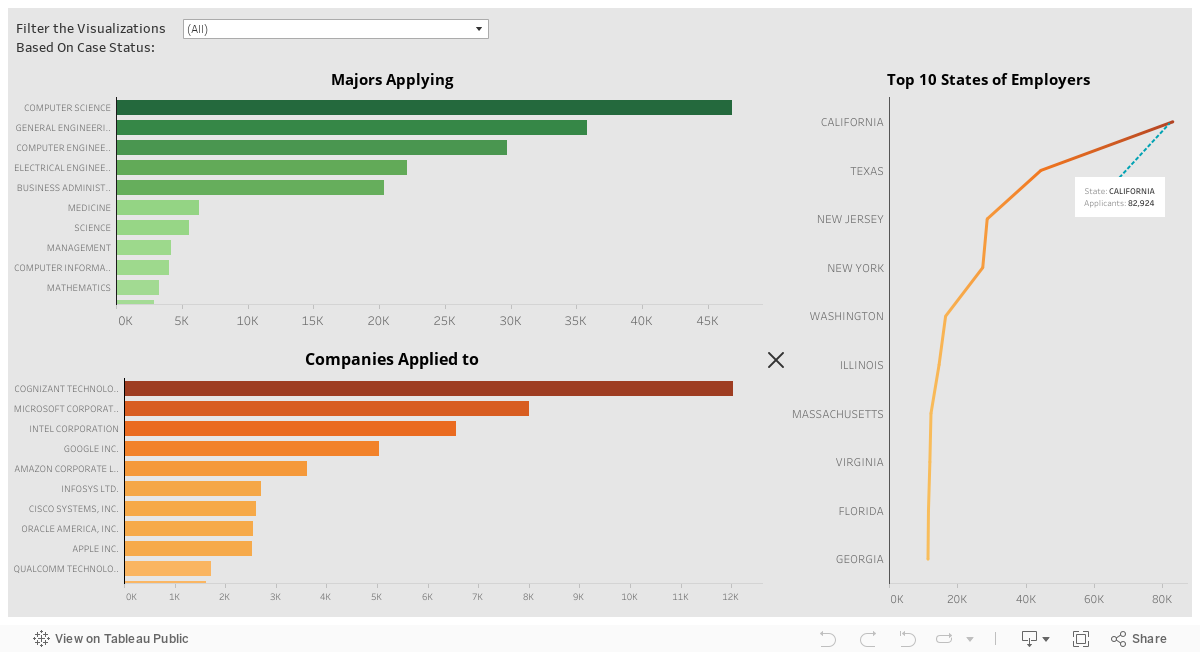
The first bar chart showcases the top majors applying for a US visa, with computer science on top, followed by general engineering and computer engineering. This suggests a notable trend in the major choices amond individuals applying for US visas. The dominance of computer science – related majors suggests a high demand for individuals with expertise in technology and programming. The data implies that individuals with computer science and engineering backgrounds may have advantageous prospects in securing employment opportunities in the US.
The second bar chart showcases the companies applied to, with Cognizant Technology being on top, followed by Microsoft, Google and Intel. This information provides insights into the preferred employers for US visa applicants. The prevalence of applications to those technology giants indicates a substantial internet or demand in the technology and IT sectors. The data suggests that individuals seeking US visas often target employment opportunities with these prominent companies, possibly due to their global reputation, job offerings, or industry influence. For applicants, this informs their choices and strategies when seeking employment opportunities in the US.
The line graph showcases the top 10 employer states, with California as the frontrunner with 33,903 applicants. Notably, California stands out as a technology hub, attracting the highest number of job seekers.
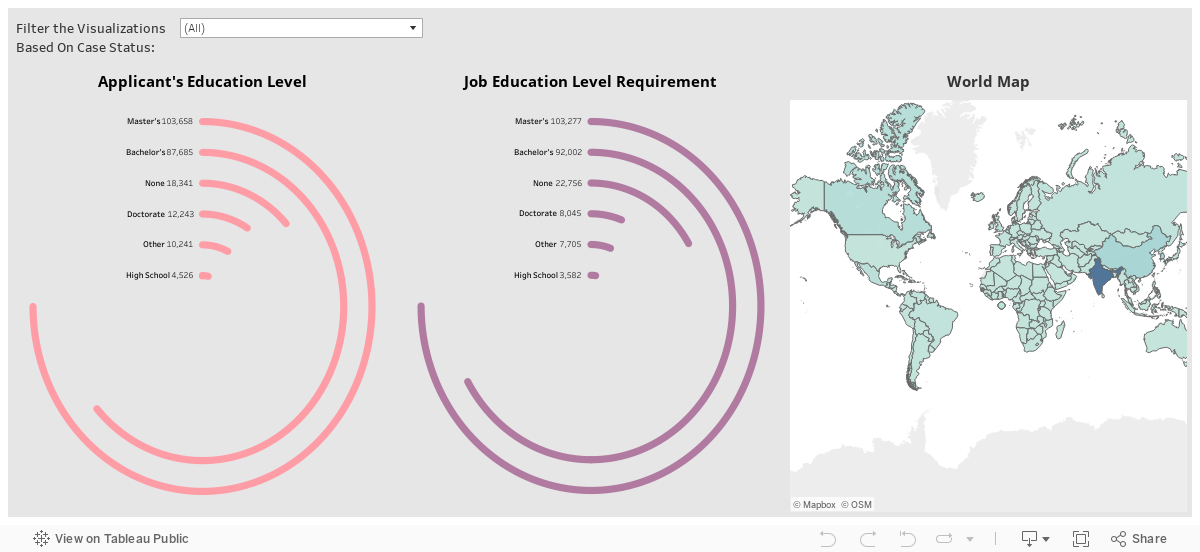
Based on the first radial bar chart, there is a visible pattern in the education level requirements for jobs. As indicated, a Master’s degree is the most commonly sought after qualification, followed by a Bachelor’s degree, and with “None” representing the third category. This information could have implications for individuals seeking employment visas: since the majority of job opportunities require a Master;s degree, prospective visa applicants can enhance their chances by acquiring this degree. Bachelor holders will also find opportunities, but with higher competition, while individuals without an educational background, or a doctorate, might have limited options.
This second radial bar chart showcases the applicant’s education level, with a masters degree coming on top, followed by a bachelor, and doctorate coming as third. This information suggests that both Master’s and Bachelor’s degrees are the most common educational levels among applicants. This finding signifies that US visa applicants hold a high level of education. The prominence of doctorate degrees, even if third in frequency, indicates a pool of highly qualified and specialized cadidated. Visa authorities and employers may take note of this educational distribution, potentially influencing the competitiveness of applicants based on their educational backgrounds.
The world map aims to visualize the distribution of the top countries where visa applications originate from, taking into account the birth country as well as the country of citizenship of applicants. When considering birth country, India comes on top, with 31,363 applicants originating from the country, followed by China, with 4,870 applicants, followed by Canada with 2,033 applicants. This data correlates with our research, where India comes on top when it comes to visa applications.
Proposed Solutions:
1- Optimize Online System: Applicants should advocate for embassy investment in optimizing the online system to enhance efficiency. Focus on user-friendly interfaces, mobile responsiveness, clear guidance, and targeted measures to address common issues leading to refiled applications.
2- Validate Information: Applicants are advised to thoroughly review and validate all entered data during the application process to ensure accuracy and completeness, reducing the risk of immediate denial due to inadvertent errors or misinformation.
3- Avoid Traditional Mail Submissions: Discourage the use of traditional mail submissions due to the higher risk of denials caused by potential discrepancies and errors in the manual processing involved.
4- Apply for Correct Visa Type: Ensure applying for the correct visa type, understanding distinctions between similar visas, and aligning qualifications with the intended job to prevent application denial.
5- Advocate for Industry Collaboration: Tech majors should actively advocate for closer collaboration between the immigration department and industry leaders to address specific challenges faced by IT professionals. Proactive research on tech job requirements is recommended.
6- Partnerships with Major Employers: Establish partnerships with major tech employers to streamline the visa application process, address challenges, and ensure a smoother experience for applicants targeting renowned organizations.
7- Seek Assistance from Parent Companies: When applying to a subsidiary, seek assistance from the parent company to enhance the chances of approval, as applications from well-known industry leaders are more likely to be approved.
8- Feedback Mechanism for Past Applicants: Establish a feedback mechanism to collect insights from past applicants, identify pain points, and implement changes for an improved overall application experience.
Conclusion: These proposed solutions collectively aim to address various aspects of the U.S. visa application process, from system optimization and data validation to industry collaboration and feedback mechanisms. Implementing these measures can contribute to a more efficient, accurate, and applicant-friendly visa application experience.
Share Your Experience!
Have you navigated the U.S. visa application process? We’d love to hear about your experiences, challenges, and successes. Share your insights in the comments below and let’s create a space for knowledge-sharing and support as we collectively navigate the path to a thriving career in the United States!
Exposing Beirut’s Struggle with Insight from Chicago’s Urban Symphony
In the once-vibrant areas of Beirut, a city facing economic crisis, a quiet upsurge in crime, especially theft and robbery, casts a shadow. The challenge increases when important crime data is still confidentail, making it more difficult to understand the complex criminal environment in the city. Unflinching in the face of difficulty, our investigation draws inspiration from Chicago’s urban environment and aims to uncover the hidden strands that may lead to crime hotspots and relevant individuals in question. The study turns into a ray of hope, a data-driven compass pointing the path toward strengthening public safety in the face of Beirut’s difficulties.
Cracking the Nuanced Web of Beirut’s Increasing Crime Rates
As we delve deeper into our investigation of Beirut’s urban dynamics, the rise in crime rates becomes an interesting illustration of the city’s intricate issues. The social and economic fabric has been scarred by the turbulent aftermath of the Beirut port explosion and the widespread effects of COVID-19, which created opportunities for crime. The ongoing economic crisis, made worse by inflation and financial stress, drives people to extreme lengths. When there is political turmoil, those who take advantage of the situation and avoid responsibility exploit the confusion.
Connecting Chicago and Beirut through Shared Data Approaches to Reduce Crime
A promising possibility for the implementation of a comparable crime reduction plan is revealed by drawing comparisons between Chicago and Beirut. The Chicago Police and the Lebanese Internal Security Forces (ISF) possess similar datasets regarding crimes. The common data elements set the stage for replicating Chicago’s effective strategy in Beirut, including crime locations, kinds, and the critical differentiation between domestic and non-domestic occurrences.
Here’s to a Safer City
A strategic beacon appeals in the maze of urban issues, where the conflict of rising crime is increasingly complemented by the rhythm of city life. Imagine this: smart use of resources, keen observation of trends, and cooperative interaction with regional authorities. These are the cornerstones of our practical strategy to strengthen public safety:
– Allocating Resources in Hotspot Regions: Determine high-crime areas and use resources like police stations and security cameras strategically.
– Identification of Patterns: Find recurrent crime trends and stay alert of problems near certain hotspots, such as banks and jewelry stores.
– Follow daily and seasonal trends: Assign more officers on duty when crime is at its highest.
– Monitoring and Assessing Performance: Monitor crime rates both in terms of time and location. Perform analysis based on category and use unit performance as a benchmark for efficient research strategies.
Through the perceptive eye of data visualization, all the suggested strategies may be indicated and easily applied, providing a thorough and dynamic perspective on the dynamics of urban crime.
Being in a state of happiness is a complicated and diverse mental and emotional condition that involves feeling content, pleased, and fulfilled with one’s life. It is a crucial part of being human and has been a topic of study in philosophy, psychology, and science for many years. The pursuit of happiness is a universal human goal that goes beyond cultural, geographic, and socioeconomic limitations. Yet, happiness remains highly subjective, varying from person to person based on individual and environmental factors. The question arises: Can we quantify this elusive emotion? Is it possible to measure happiness across a population, identify challenges, and propose solutions for the collective well-being?
Decoding the Happiness Index:
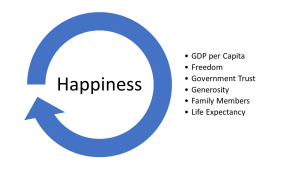
Acknowledging the significance of happiness, the United Nations Sustainable Development Solutions Network introduced the World Happiness Report in 2012. This report unveils the Happiness Index, a ranking system that delves into the well-being of nations. Factors such as income, social support, life expectancy, freedom of choice, generosity, and perceptions of corruption contribute to this comprehensive measure.
Unveiling Happiness Pillars:
The United Nations Sustainable Development Solutions Network not only standardized happiness measures, it also standardized factors that contribute to it, where it defined the following factors as Happiness Pillars: Income, Social Support, Life Expectancy, Freedom to Choose, Generosity and Corruption Index. Considering income, though money doesn’t guarantee happiness, it though plays a role by providing better access to resources, opportunities, and an enhanced standard of living. Social support is emphasized, with human connections forming the fabric of happiness, contributing to a sense of belonging, security, and resilience. Life expectancy is viewed not just as a statistic but as a reflection of access to quality healthcare, living conditions, and overall well-being. Freedom to choose is highlighted, emphasizing that autonomy and the ability to make personal choices directly impact one’s sense of well-being. Generosity is underscored as acts of kindness and generosity foster happiness, creating a positive cycle, especially in societies that prioritize giving. Additionally, the Corruption Index reveals that lower levels of corruption correlate with higher reported levels of happiness, as trust in institutions and a better quality of life go hand in hand.
Lebanon’s Economic Crisis: Impact on Happiness
Lebanon is currently facing a severe economic crisis with soaring debt and dwindling foreign reserves. Unemployment, currency devaluation, and economic instability have triggered widespread stress and declining standards of living. The aftermath ripples through social and political unrest, plunging Lebanon’s happiness index to its lowest.
.
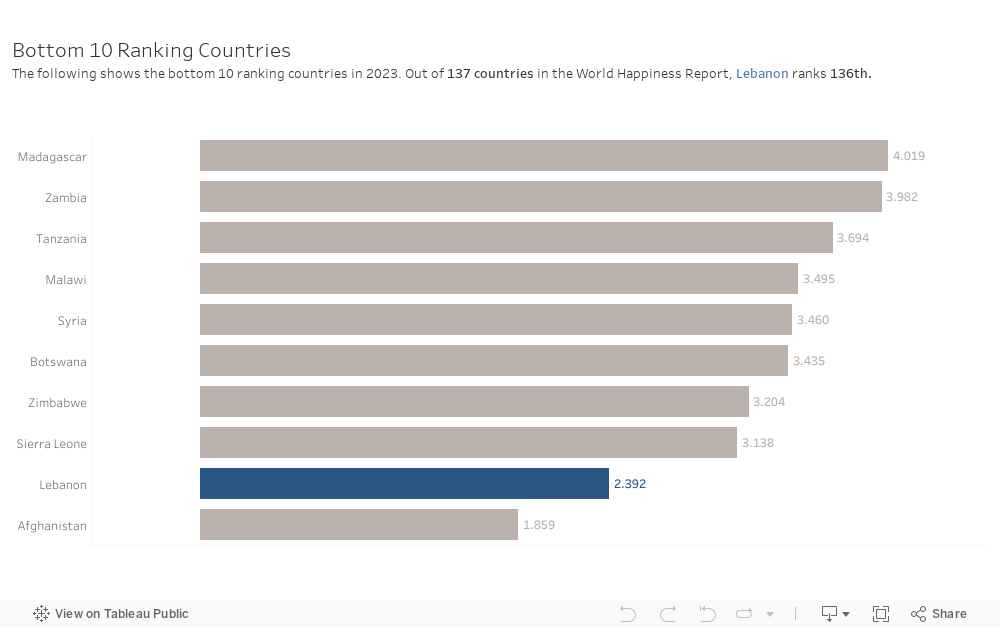
In 2022 and 2023, Lebanon ranked as the least happy in the MENA region, with a Happiness Index of 2.392. Globally, it stood at 136th out of 137 countries in 2023, highlighting a stark decline. CNN reports that life evaluations in Lebanon lag more than 5 points behind the top 10 happiest nations.
Deepening into Lebanon’s Happiness: Understanding Declines and Designing Solutions
A comprehensive approach to take would be to evaluate the key indicators affecting the happiness index in Lebanon and its decline throughout the years. After which, a framework of policies will be designed to improve the overall happiness and well-being of the Lebanese population.
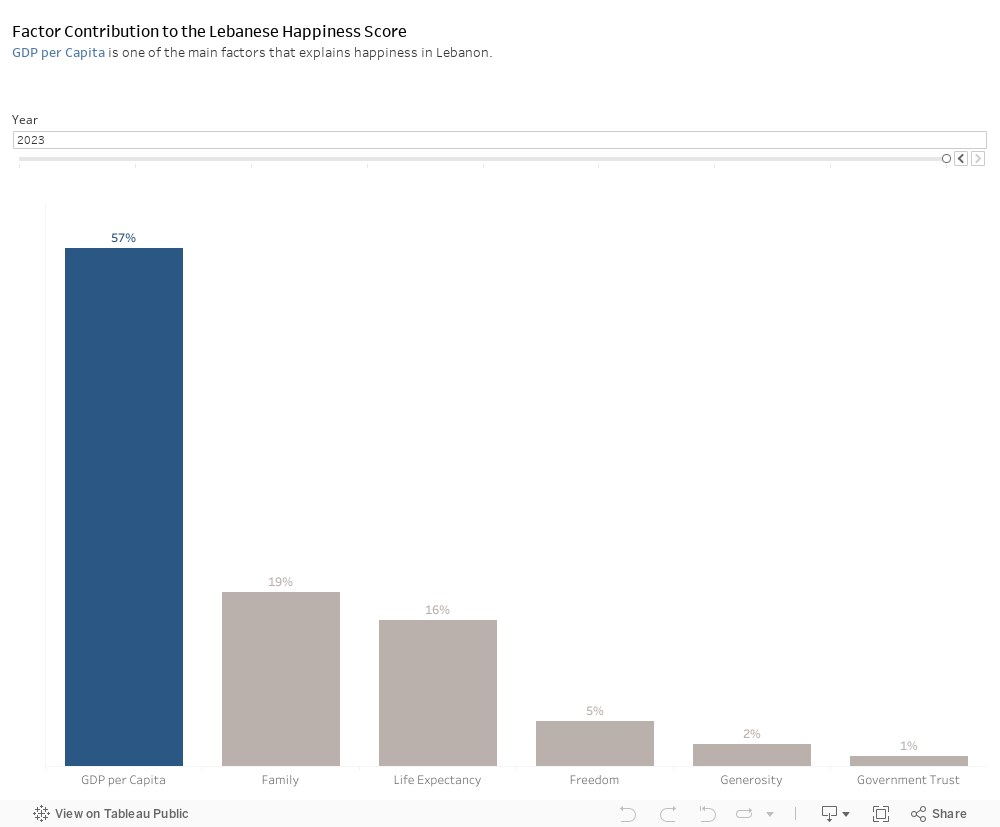
Verdict: GDP at the forefront of Lebanese well-being:
As the bar chart shows, GDP is perceived to be the main factor that would contribute to the Lebanese happiness score. This means that for the year 2023, the Lebanese population expressed that the economic situation around them is a major contributor to their happiness levels. Since GDP is the main player contributing to the happiness level of the Lebanese population, further analysis should be conducted.
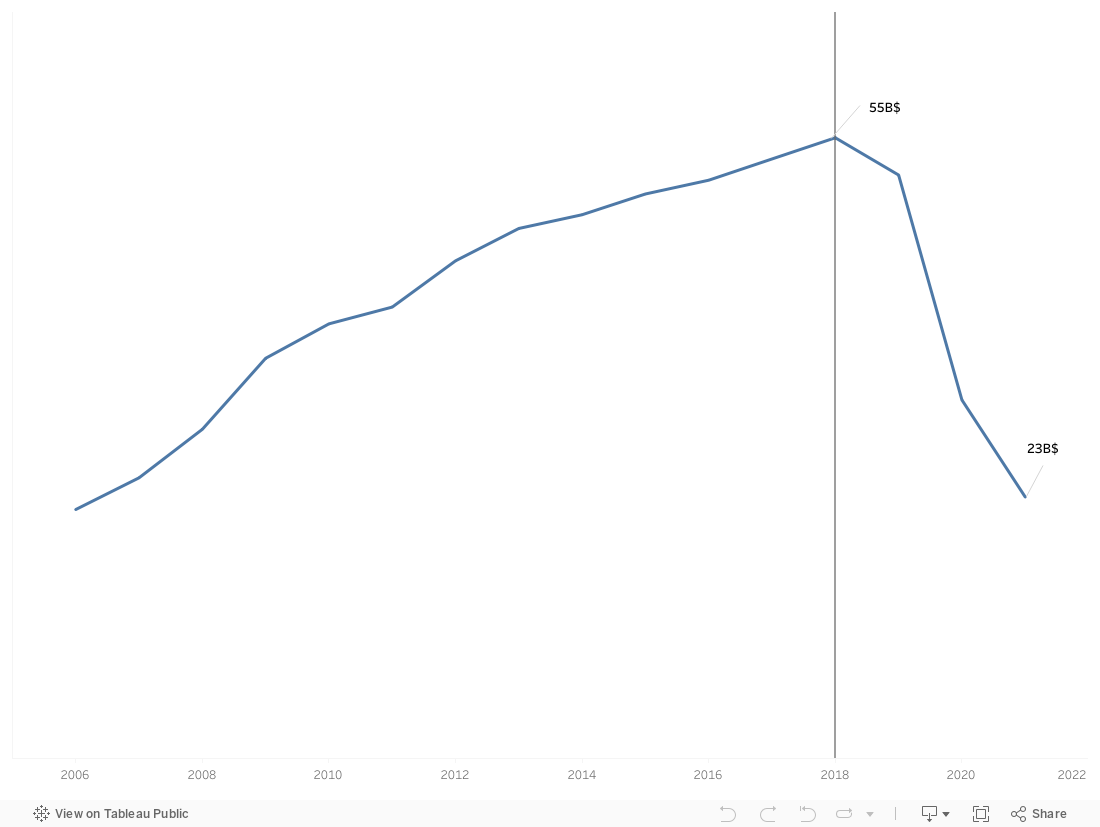
Lebanon’s GDP Over the Years:
In 2018, Lebanon enjoyed an economic height of 55B $. However, the economic crisis in 2019 forced Lebanon into a rapid decline, reaching 23B $ by 2021—a 50% reduction in just 2 years. This economic state is concerning, as GDP takes center stage in Lebanon’s happiness index. The focus now turns to dissecting the factors driving this downturn, an essential step in understanding and rectifying the low happiness score in the country.
Improving happiness in Lebanon: Increase GDP as a main Target:
Understanding Lebanon’s economic health involves looking at the Gross Domestic Product (GDP) formula. GDP, a measure of a country’s economic output, is calculated through an expenditure approach:
GDP = Consumption (C) + Investment (I) + Government Spending (G) + Net Exports (NX)
Net Exports: A nation’s exports minus its imports.
Investment: Business expenditures by businesses and home purchases by households.
Consumption: Private consumption expenditures by households and nonprofit organizations.
Government Spending: The expenditures spent by the government on goods and services in different sectors.
Analyzing Consumption, Investment, Government Spending, and Net Exports individually, helps identify what factors contribute to the country’s declining GDP.
The C and NX in GDP – Consumption & Net Exports:
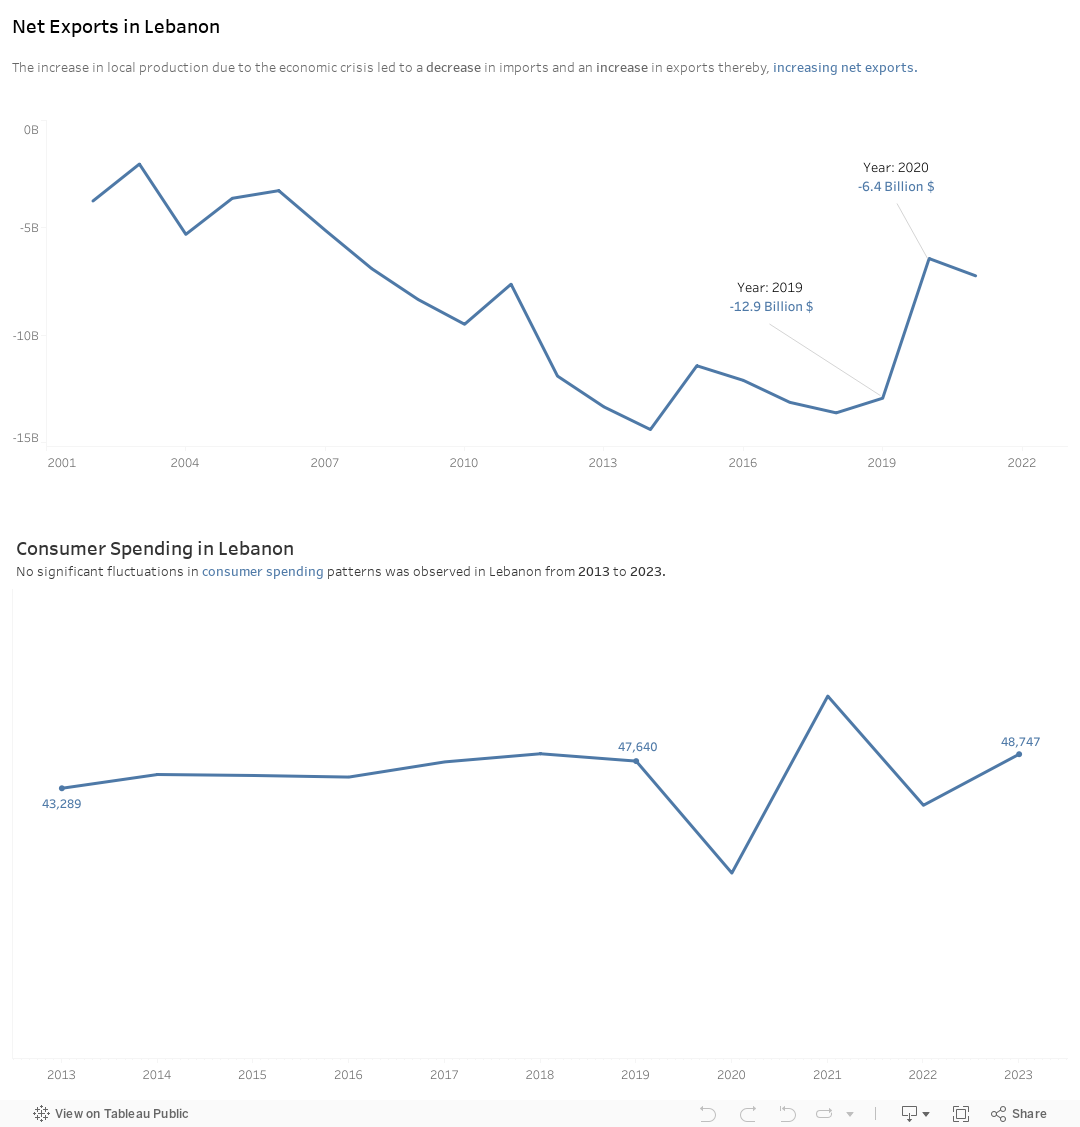
Starting with Consumption, a noticeable dip occurred in 2019 due to government-subsidized policies cutting prices for essentials like fuel and food. However, as these policies relaxed, prices inflated, and by 2023, consumption levels rebounded to normal.
Shifting gears to the Net Exports (Exports – Imports), its line chart shows an increasing trend since 2019. This is explained by the economic crisis that took place that year, where due to the currency devaluation, it became much more costly for people to import products/services from foreign countries. Furthermore, the heightened inflation encouraged the Lebanese people and the government to export goods and services, for the sake of the Dollar Currency acquisition.
In summary, both Net Exports and Consumption show improvement over time, contradicting the overall GDP decline. This suggests that focusing on these factors might not be the key to improving Lebanon’s GDP, redirecting our attention to other aspects of the economic equation.
The I and G in GDP – Private Investment and Government Spending:
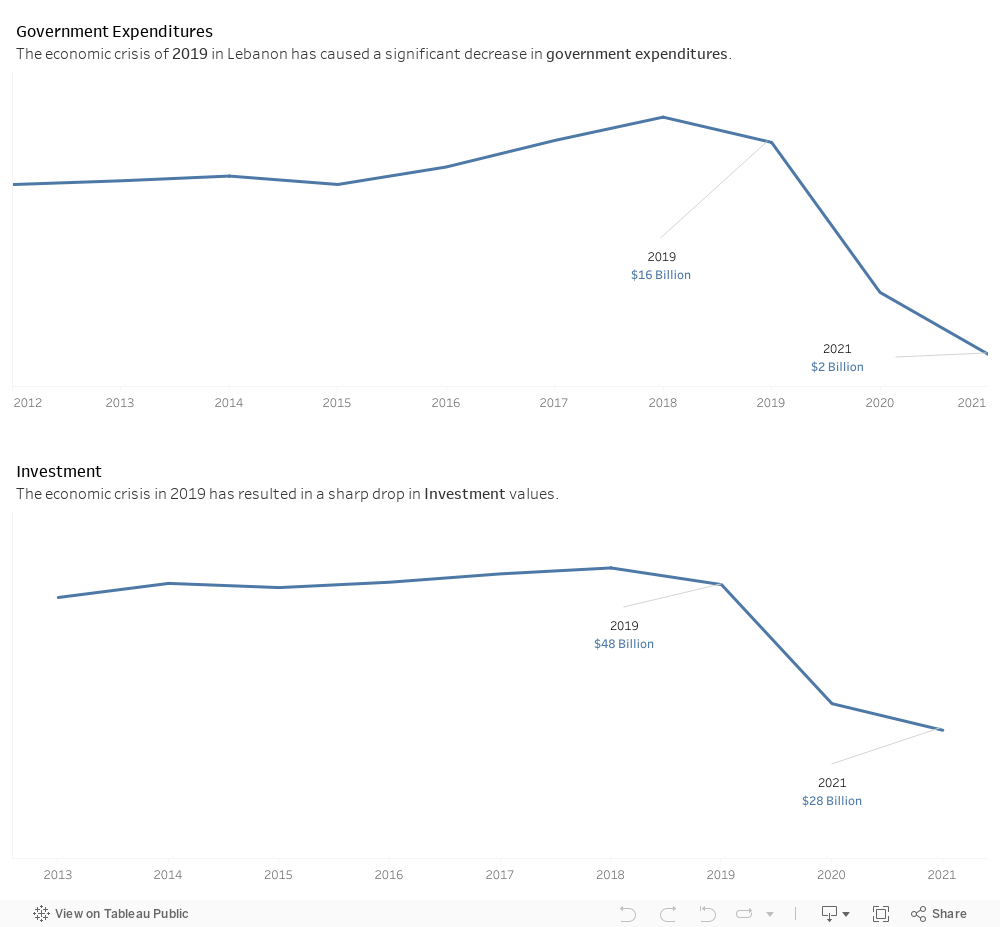
The line chart depicting Private Investments reveals a downward trend since 2019. The economic crisis of that year, coupled with banking restrictions on loans and economic uncertainties, forced a drop in investments from $48 Billion in 2019 to $28 Billion in 2021.
Shifting gears to Government Spending, the scenario is equally grim. The economic and banking crises of 2019 left the government strapped for funds, unable to secure a budget for essential services. Defaulting on Euro Bonds further restricted financial options, leading to a drastic cut in government expenditures from $16 Billion in 2019 to a mere $2 Billion in 2021.
In summary, ‘Private Investment’ and ‘Government Spending’ are the factors contributing to Lebanon’s GDP decline. To reverse the GDP slump and foster happiness, targeted policies must address these crucial aspects, attracting investments and revitalizing government spending.
What to Keep in Mind when Dealing with Lebanon’s Happiness:
Happiness among the Lebanese population is primarily explained by GDP.
Examining changes in GDP’s four pillars, showed the following: Consumption has shown consistent stability over the years. Net Exports have demonstrated a positive trend in recent years. Government Spending and Investment, however, have significantly decreased, notably beginning with the onset of the economic crisis in 2019.
Government Spending and Investment are the primary factors responsible for the decline in Lebanon’s GDP. Addressing these aspects is crucial to enhance the overall happiness index in the country.
Even though Net Exports are experiencing a positive increasing trend, the values are still negative. Introducing certain reforms can help in pushing that value closer to zero or possibly turn the Lebanese trade deficit into a trade surplus.
To achieve the mentioned improvements, specific reforms need to be implemented. Recommendations and solutions will be discussed in detail in the Solutions segment.
Addressing the Core Problem: Solutions to Lebanon’s Decreasing GDP
Improving the I in GDP – Private Investment:
With our primary aim being fostering economic growth and increasing Gross Domestic Product, attracting Foreign Direct Investments (FDI) is a must. This can be achieved through regulations that would create a more attractive environment for investors.
Increasing and Regulating the G in GDP – Government Spending:
Lebanon is already receiving aid and funds from various countries such as the gulf countries. Leveraging these funds and properly utilizing them is essential in addressing key economic challenges faced by Lebanon. Important sectors that the Lebanese government can invest these funds into include but are not limited to:
Focal Point 1 – The Lebanese Health Sectors:
Improving Lebanon’s health sector should be a priority for the government. This can be achieved through policies that would emphasize the production of locally made generic medicine, the renovation of public hospitals, and the Expansion of healthcare services for the elderly and people in remote areas of the country.
Furthermore, government-funded programs for healthcare workers can be introduced alongside a robust awareness campaign to touch on key public health notions such as preventive measures, the importance of seeking medical attention when needed, and healthy living practices.
Focal Point 2 – The Lebanese Educational Sector:
To improve the education sector, the government could focus on renovating public schools to ensure that they are equipped with the proper technological tools and learning resources and materials to enhance the overall learning experience.
In addition, increase funding for improvement of the Lebanese University through enhanced administrative processes, and investment in infrastructure upgrades.
In parallel, government funded programs for teachers and career guidance initiatives should be put in place to both train educators on the use of modern pedagogical methods as well as provide students with the information about various career paths they could undertake.
Focal Point 3 – The Lebanese Infrastructure:
Another key area to focus on is the current state of infrastructure in Lebanon. The government, in its expenditure plan, should focus on maintaining and expanding the various infrastructure that would attract factories into the country. In addition, industrial zones with certain benefits to factories could be built in an attempt to increase their local presence. Finally, the government should implement a transparent bidding process for Public Work Projects that would ensure a fair allocation of resources dedicated to maintain, and construct new infrastructure.
Improving the NX in GDP – Net Exports:
Improving Net Exports in Lebanon could be achieved through a classical protectionist trade policy. This policy aims to boost the domestic economy by increasing tariffs on imports, making imported goods more expensive and locally-produced goods more competitive which shifts consumer demand towards domestic products. As a result, Net Export in Lebanon will increase due to less imports, and more competitive local products that could be exported globally.
A Measure that Ties it All Up – Enhancing Transparency and Accountability:
Ensuring transparency and accountability is essential when implementing fiscal policies as it involves safeguarding the independence of auditing bodies like the Central Inspection. This institution is responsible for addressing inefficiencies and uncovering any financial mismanagement.
In addition and to further expand transparency, a national bureau of statistics for accessible economic data can be established to empower and inform the Lebanese people about the current state of their economy.
Implementing these government reforms do not only contribute to an increase in GDP. They also serve in improving the trust people have in their government, which is another factor that directly contributes to the overall Happiness Index. (Government Trust).
A Proof of Success and a Model to Follow – Singapore:
Singapore, a small country in Asia, was exposed to several regional economic crises. However, through robust fiscal policies implemented in the 1960s, Singapore maintained its growth and positioned itself as the happiest country in Asia.
Therefore, following Singapore’s steps in emphasizing financial management and sector-specific investments would not only recover Lebanon’s GDP, but consequently improve the happiness of its citizens.
Conclusion – Lebanon’s Path to Happiness:
The Lebanese population expressed that the economic situation around them is a major contributor to their low happiness levels. To revive the economy, largely affected by the 2019 financial crisis, targeted reforms including increased Foreign Direct Investments, efficient fund allocation, and a protective trade policy should be implemented.
As GDP positively influences other happiness index components such as Life Expectancy and Government Trust, increasing it would result in an overall higher Happiness Score. Thus, a concerted effort towards GDP enhancement through focused reforms is not only a remedy for the economic downturn but a pathway to a happier and more prosperous Lebanon.
Silent Killers in the Cedar Land: Lebanon’s Battle Against the NCD Epidemic
In the heart of the Mediterranean, Lebanon, a country renowned for its rich culture and history, is facing a modern-day health crisis that is silently reshaping its society. Non-communicable diseases (NCDs), once considered ailments of the affluent, are now the leading cause of mortality and morbidity in Lebanon, transcending economic and social boundaries. From the bustling streets of Beirut to the serene landscapes of the Beqaa Valley, the specter of NCDs looms large, affecting young and old alike. This urgent health challenge calls for innovative solutions and a collective commitment to change, both from the government and its citizens. A journey into this topic began with a simple question: Can Lebanon turn the tide against these silent killers? In this exploration, we unravel the threads of Lebanon’s health crisis and seek to uncover strategies that could pave the way for a healthier, more resilient future.
Mortality’s Rising Tide: Unveiling the Causes Behind Lebanon’s Health Crisis
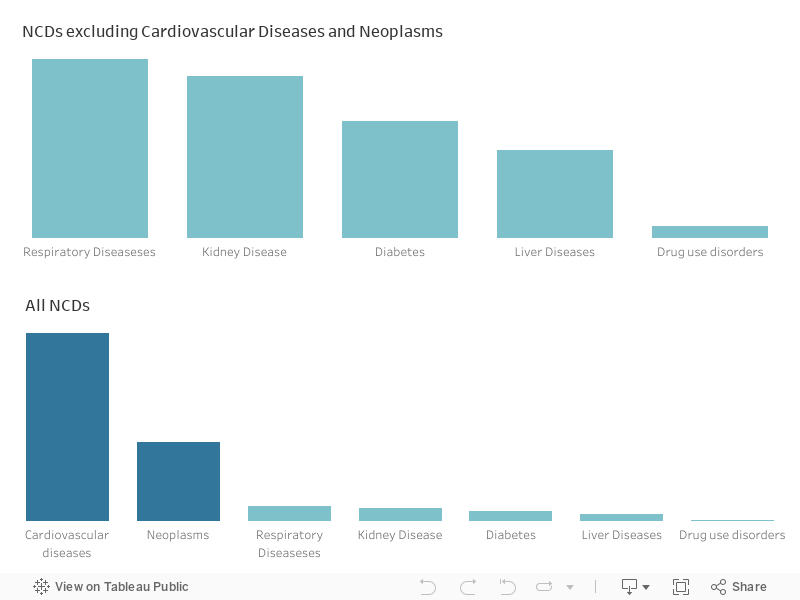
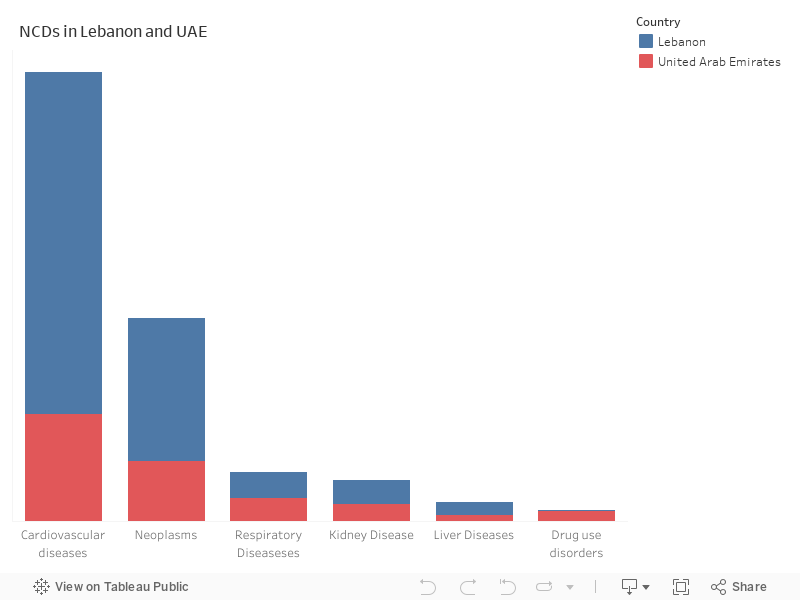
Lebanon stands at a critical juncture, with the specter of non-communicable diseases casting long shadows over its future. The data reveals a hard truth: a surge in cardiovascular diseases leads the charge, followed closely by the silent spread of cancers and respiratory conditions. Kidney and liver diseases also claim their share of lives, while drug-related disorders sketch a worrying trend of increasing substance abuse. These aren’t just numbers; they’re echoes of individual stories and collective challenges that Lebanon must urgently address. But what are the underlying causes of this health crisis, and how can Lebanon’s policies adapt to confront them effectively?
Do you think that’s the whole picture? Think again—there’s more beneath the surface of Lebanon’s health crisis.
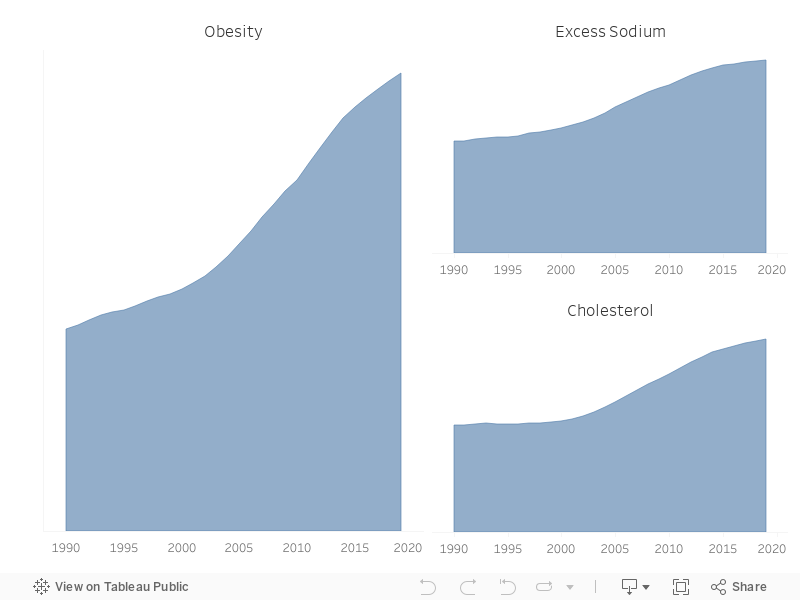
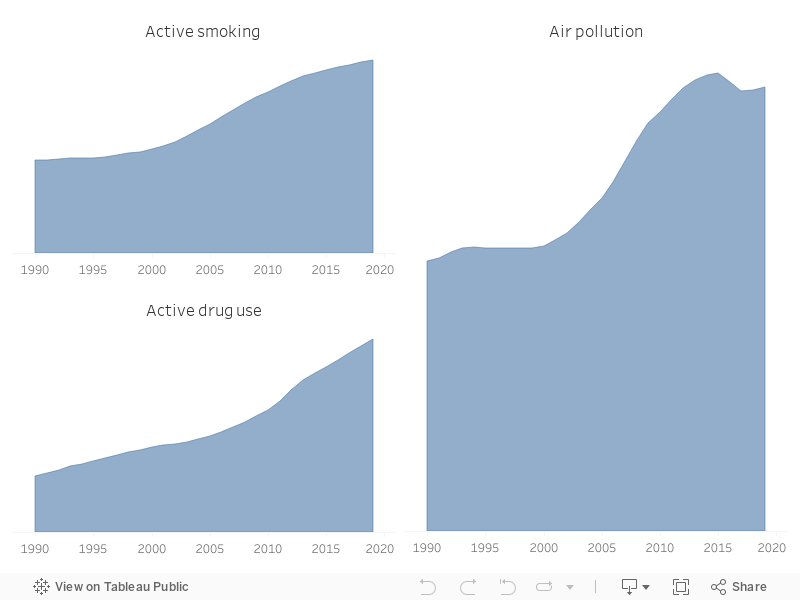
A Silent Tide: The Visual Tale of Lebanon’s NCDs Tragedy
Lebanon’s health crisis, as quantified in stark data visualizations, can be traced to a constellation of lifestyle and environmental factors that demand a nuanced examination. The nation’s predilection for high-sodium diets is leading to alarmingly high rates of hypertension, a silent precursor to more dire health complications. Concurrently, obesity is becoming increasingly prevalent, laying the groundwork for a myriad of chronic health conditions. The entrenched smoking culture contributes to a significant burden of respiratory and cardiovascular diseases. Elevated cholesterol levels, indicative of dietary imbalances, pose additional risks for heart health. Air pollution, with its insidious effects, exacerbates the incidence of asthma and other respiratory disorders. Additionally, the rising trend of drug use introduces complex challenges, both medical and social. These factors, specific and interrelated, underpin the NCD problem in Lebanon, underscoring the urgent need for comprehensive public health strategies and interventions.
Crafting a Healthier Lebanon: A Government-Led Crusade Against NCDs
In an ambitious move to tackle the NCD crisis, the Lebanese government is poised to roll out a detailed strategy that resonates with urgency and hope. This plan hinges on introducing impactful health policies, such as the imposition of taxes on tobacco and sugary foods to discourage unhealthy habits. Comprehensive health campaigns and screenings, strategically spread across the nation, will aim to catch diseases early and educate the public. Reinforcing this is the crucial enhancement of healthcare infrastructure, ensuring accessible and efficient medical care. Integral to this endeavor is the infusion of health education into school curricula, fostering a future generation that is health-conscious. Moreover, the establishment of community fitness programs stands to invigorate the Lebanese populace with the spirit of physical well-being. To knit these efforts together, a collaborative framework involving government sectors, private entities, and NGOs will be pivotal. By embracing this multi-layered approach, the government of Lebanon is not just combating diseases but is sculpting a vision of vitality and longevity for its people.
Emulating Success: How Lebanon Can Learn from UAE’s Public Health Triumphs
Examining the UAE’s approach offers specific insights for Lebanon’s NCD strategy. The UAE government implemented taxes on tobacco and soft drinks, a move proven to reduce consumption of these products. They also launched targeted health campaigns like the “Your Health is Your Responsibility” initiative, which focused on promoting healthy lifestyles, regular medical examinations, and smoking cessation. Additionally, the UAE integrated health education into school curricula and established wellness programs to foster early adoption of healthy habits. This disparity serves as a crucial learning point for Lebanon, underscoring the efficacy of the UAE’s health policies—from rigorous anti-smoking laws to nutritional awareness programs—that Lebanon could adopt. By mirroring such measures, Lebanon can embark on a transformative journey toward reducing its NCD burden, a move that would not only alleviate healthcare strain but also improve the quality of life for its citizens.
Lebanon vs. UAE: A Tale of Diverging Health Investments
The graph illustrates a notable disparity: in 2019, Lebanon experienced an unanticipated decrease in health expenditure, regardless of the emergence of COVID-19, in contrast to the consistent dedication observed in the UAE. This highlights an urgent requirement for Lebanon to reassess its funding for healthcare, guaranteeing that it has the capacity to endure and address unforeseen public health challenges with the same determination demonstrated by its neighboring country.
A Blueprint for Resilience: Lebanon’s Call to Action Against NCDs
In conclusion, Lebanon’s journey towards mitigating its NCD crisis necessitates immediate and decisive action. Drawing from the UAE’s successful model, Lebanon should adopt targeted fiscal policies such as increased taxation on tobacco and unhealthy foods, coupled with rigorous enforcement. Launching impactful health awareness campaigns and integrating health education into school systems are crucial for fostering a health-conscious society. Investing in healthcare infrastructure and accessibility, along with developing community-based wellness programs, will further strengthen this approach. Lebanon stands at a pivotal point, and these recommendations offer a blueprint for a healthier future. It’s a call to action for government, healthcare professionals, and citizens alike to collaboratively turn the tide against NCDs, ensuring a resilient and vibrant Lebanon for generations to come.
Imagine you have a business of your own. Consider it a dream come true to have it thrive. Now, as an entrepreneur, what would you care about most for your business’s future? As a matter of fact, you can respond to this question with a multitude of answers, and all of them will converge to having a viable business, which becomes so through profits, which are achieved through SALES!
For the purpose of realizing the importance of sales to a business, we dive in this blog into the sales performance of a US based company belonging to the food and beverage sector and operating its three contemporary coffee-shop like stores within the busiest state in the United States, New York.
The company has 4 facilities, 1 main office and 3 customer facing stores (store 2, 3, and 4).
Overall Sales Performance
Our focus is to dissect and understand the sales trends and patterns that have emerged over the past two years, shedding light on the company’s growth, challenges, and opportunities.
The company’s sales trajectory exhibited a notable improvement in the first half of the years 2017 to 2018, indicating a successful adoption of growth strategies during this period. However, an interesting pattern emerged in the latter half of these years. The sales figures, initially showing distinct growth, began to converge towards approximately the same numbers in the second halves of both years. This dichotomy of divergence and subsequent convergence underscores the necessity to dig deeper into the analysis, understanding the underlying factors that led to this trend and identifying strategies to ensure consistent growth during upcoming years.
Sales Performance by Store
To further our understanding of the underlying patterns, rather than aggregating results of all stores, the sales performance of each store is studied separately throughout 2017 and 2018, offering a meticulous examination of sales figures, customer demographics, and quarterly trends. The objective is to uncover hidden challenges and propose a comprehensive action plan for sustained improvement.
Inadequacy of Store 2 Performance
In 2017, Store 2 reported sales of $281,000, which experienced a positive growth trajectory, reaching $322,000 in 2018. While indicative of progress, it’s essential to juxtapose these figures with the more robust performances of Store 3 and Store 4, recording $555,000 and $564,000 in 2017, and $637,000 and $638,000 in 2018, respectively.
In our analysis of growth percentages, Store 2 demonstrated a notable growth rate of approximately 14.6%. This rate is closely aligned with the growth rates of Stores 3 and 4, which reported rates of approximately 15% and 13%, respectively. However, it’s important to clarify that while Store 2’s growth percentage is similar to that of Stores 3 and 4, the key distinction lies not in these percentages, but in the actual growth amounts measured in US Dollars. This crucial aspect will be further explored in our upcoming detailed analysis.
While Store 2 is on a positive growth trajectory, there’s an evident opportunity to fortify its position by strategizing to match the sales amounts of its counterparts.
Customer Demographics and Value
The company’s overarching target demographic is the 40-60 age group, a segment known for its purchasing power and brand loyalty as shown in the below visualization. This age group forms the core customer base across all company stores.
However, when delving into the performance specifics, it becomes evident that Store 2 is underperforming in engaging this crucial demographic compared to its sister stores.
A closer look at customer value reveals intriguing patterns. The consistent presence of 2,131 low-value customers (smaller transactions in amount) across all stores and both years raises the question of whether there’s untapped potential among this segment. Concurrently, the identification of 119 high-value customers (larger transactions in amount) accentuates an opportunity for targeted strategies to cultivate and retain these valuable patrons.
In Store 2, a specific area of concern is the notably weak number of low-value customers compared to other stores. Addressing this issue is crucial for the store’s overall performance.
New Customer Acquisition
Store 2 consistently attracted fewer new customers each month compared to the more robust acquisition rate observed at Store 3. With respect to store 4, it is attracting the lowest number of customers per month; nevertheless, the impressive performance of store 4 suggests it is approaching market saturation, much faster than store 2.
The gap in new customer acquisition at Store 2 signals an urgency to investigate and enact strategies aimed at elevating foot traffic and expanding the customer base.
Monthly Purchase per Visiting Customer
Store 2’s performance in terms of monthly purchase per visiting customer presents a notable area for improvement. Store 2 records the lowest customer contribution among its counterparts. This finding is particularly concerning when juxtaposed with the stronger performance of Stores 3 and 4 in the same metric.
The need for improvement in monthly purchase per customer at Store 2 highlights potential areas for strategic intervention. Focusing on upselling and enhancing the overall in-store experience could be key in encouraging customers to spend more during each visit. Addressing this gap is crucial for Store 2 to not only align with the performance of its sister stores but also to optimize its revenue potential from every customer interaction.
Proposed Solutions Overview
Boosting Store 2’s market presence requires innovative and effective strategies. Here, a three-pronged approach is presented: an engaging social media campaign, impactful influencer collaborations, and a customer-enticing loyalty program. Each strategy is crafted to not only enhance brand visibility but also to deepen customer engagement and drive sales.
1. Social Media Campaign
Objectives: Increase brand awareness on Instagram, Facebook, Twitter; drive online traffic to Store 2.
Strategy: Post visually engaging content, use polls and quizzes, encourage user-generated content.
Schedule: Regular, strategically timed posts; use a unique campaign hashtag for visibility and engagement.
2. Influencer Collaboration
Criteria: Select local influencers aligned with Store 2’s image.
Performance: Track success using referral codes/links and engagement metrics.
3. Loyalty Program
Components: Points system for purchases, exclusive discounts, personalized offers.
Launch: Announce via social media, email, and in-store materials; use in-store signage for visibility.
Staff Involvement: Train staff to engage customers about the program and provide technical support.
Recommendations
Elevating Store 2’s success hinges on a mix of dynamic strategies: targeted seasonal marketing, establishing a customer feedback loop, forming strategic local partnerships, leveraging data-driven decision-making, and enhancing the in-store experience. These approaches aim to boost sales, expand the customer base, and improve overall satisfaction. This segment delves into how each method can effectively transform Store 2’s business approach.
1. Seasonal Marketing Strategies
Develop seasonal marketing campaigns to capitalize on peak shopping periods and mitigate sales fluctuations. Tailor promotions and incentives to match customer behaviours during different quarters.
2. Customer Feedback Loop
Establish a robust feedback loop to gather insights from customers on their seasonal preferences and expectations. Leverage this feedback to tailor products and services to seasonal demands.
3. Collaborative Partnerships
Explore partnerships with local businesses and influencers to create synergies that drive foot traffic and broaden the customer base.
4. Data-Driven Decision Making
Invest in data analytics tools to gain deeper insights into customer behavior. Utilize this data to make informed decisions on product placement, pricing, and marketing strategies.
5. In-Store Experience Enhancement
Investigate and enhance the in-store experience, considering factors such as store layout, ambiance, and product presentation. An inviting and immersive environment can positively impact customer perception and satisfaction.
Although you would like to say you cannot be measured by a number, you are! Studies implemented to assess projects and decide whether to implement them or not reduce you to a number, just like they judge the value of a building.
The world is heading in a clear direction: focus on development! Although, it seems like a great thing, easing our lives, take a minute to explore its impact:
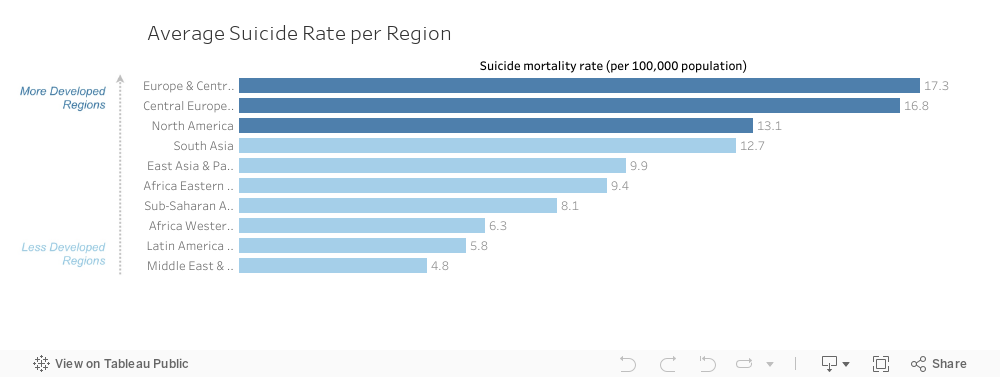
We can notice how the more developed countries have, in general, higher suicide rates each year, especially more recently. To demonstrate this further, we take a look at the following visualization comparing average suicide mortality rate (per 100,000 population) per given years across the main regions we are considering:
What is the point?
The point is that we should put more emphasis on our well-being and our connection with the world instead of only focusing on materialistic development. Whenever we take action on something, we must evaluate the impact, and in the case of development, the signs are not good.
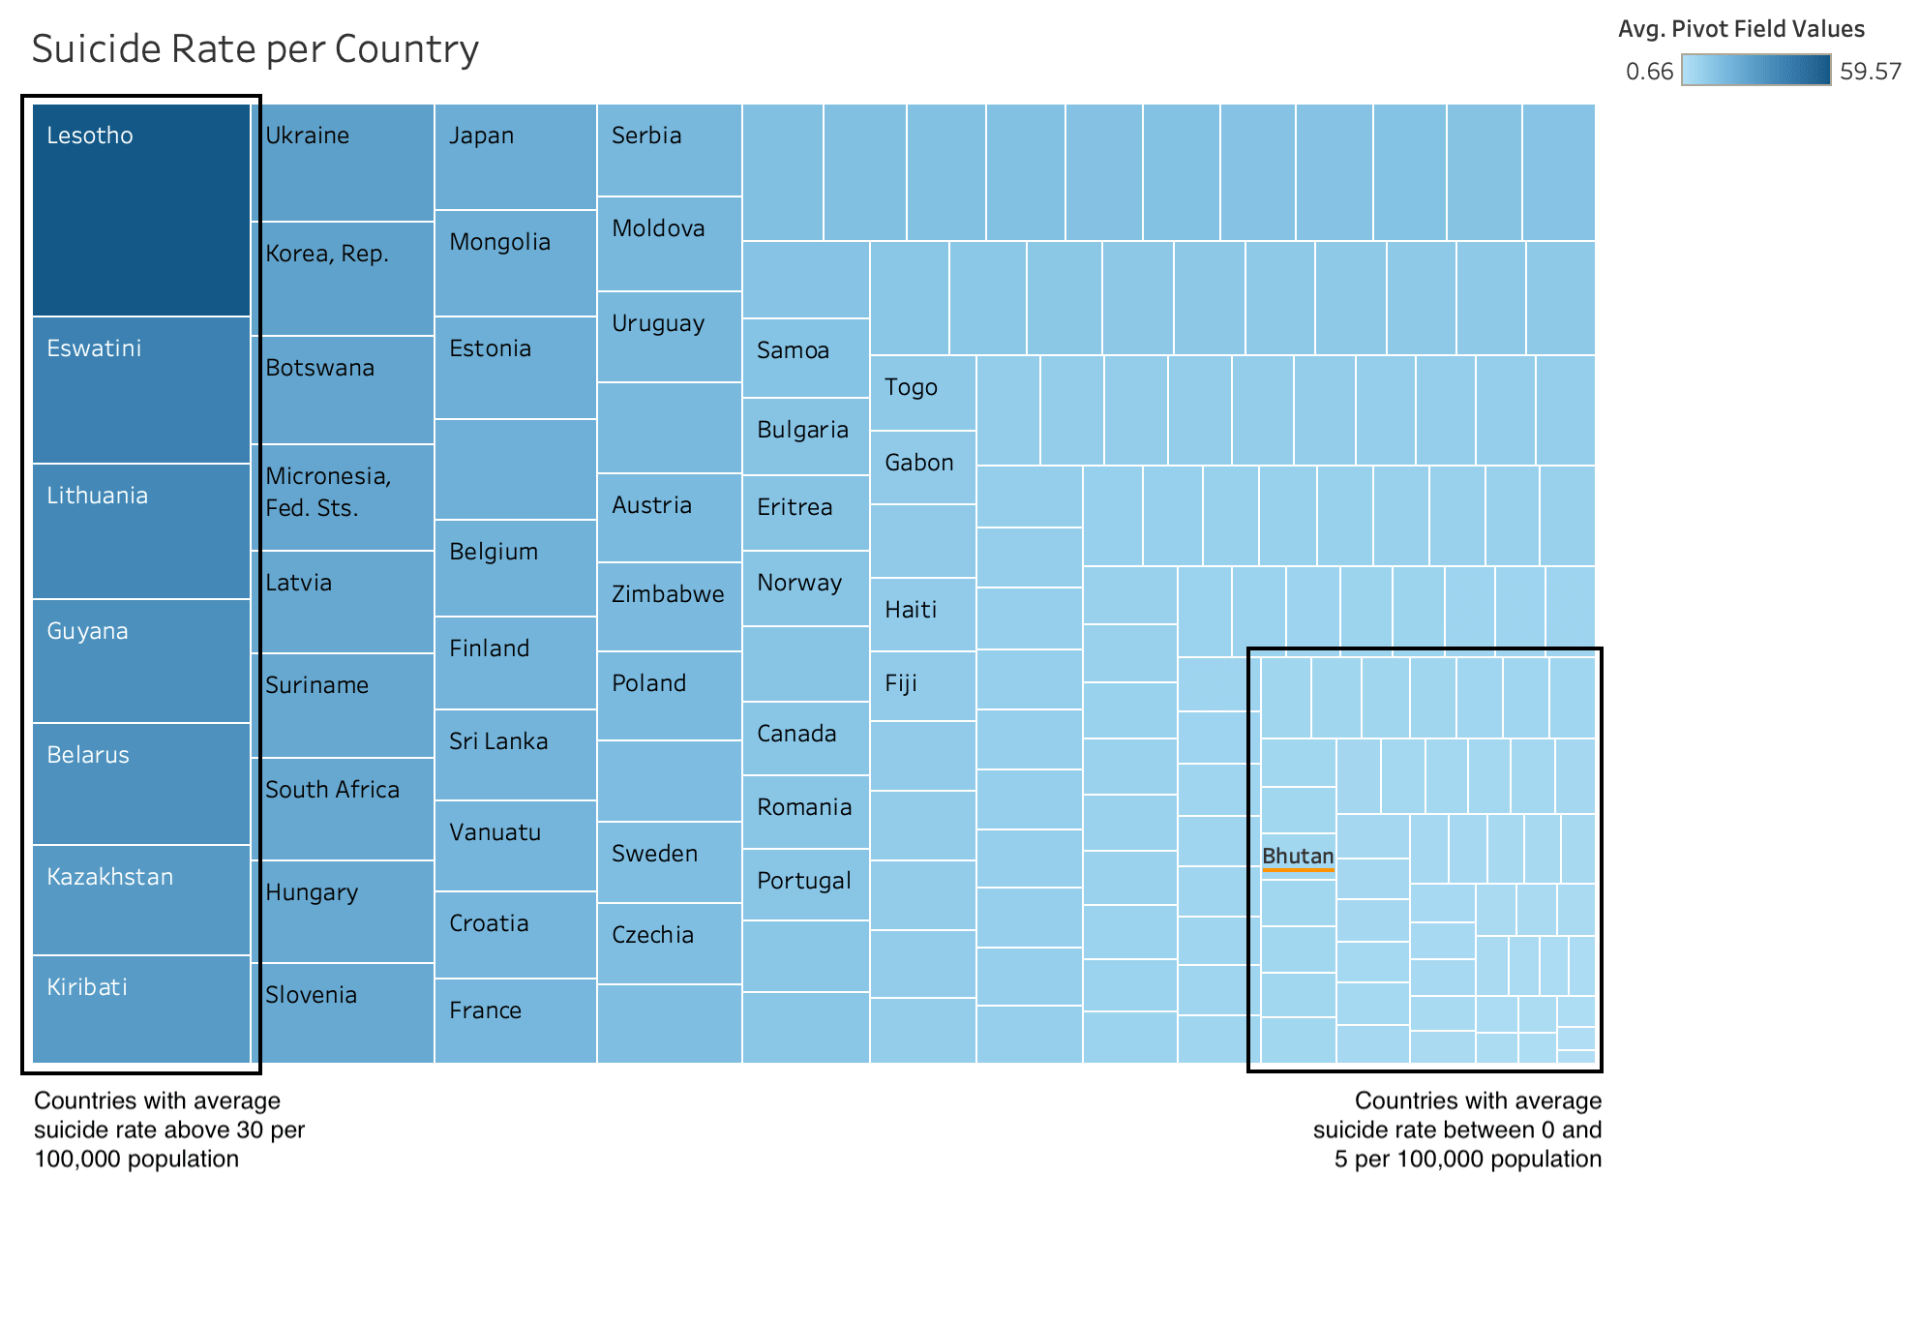
However, it is not too late to make a change. Bhutan, the happiest country in the world, prioritizes the mental well-being of its citizens. It is the only country that uses the gross national happiness indicator (GNH) just like other countries focus on the gross national income.
The following visualization shows the average suicide rate per country instead of region:
Notice how Bhutan falls in the range of countries that average from 0 to 5 suicide per 100,000 population compared to other countries that average more than 30 in the range of given years (2000-2019).
We recommend people to prioritize their well-being and mental health, but most importantly, governments to realize that economic and materialistic development is not yielding that wanted outcome. To prioritize humanity, governments ought to start taking GNH into consideration with every decision they are making.