In Japan, it is common for businesses to rely on the belief that well-crafted, reliable products can sell themselves without heavy marketing. One small online furniture shop followed this philosophy closely, focusing on quality materials, clean design, and dependable service rather than advertising campaigns.
The approach worked.
Orders were steady, reviews were positive, and most furniture categories- including chairs, shelves, bookcases, and storage units- consistently generated profit. By all traditional indicators, the business was healthy.
Yet something remained unusual: despite growing revenue, overall profit growth was slower than expected. The business was performing well, but its profitability did not scale proportionally with sales. This discrepancy prompted a closer look into where exactly profit was coming from, and where it might be slipping away.
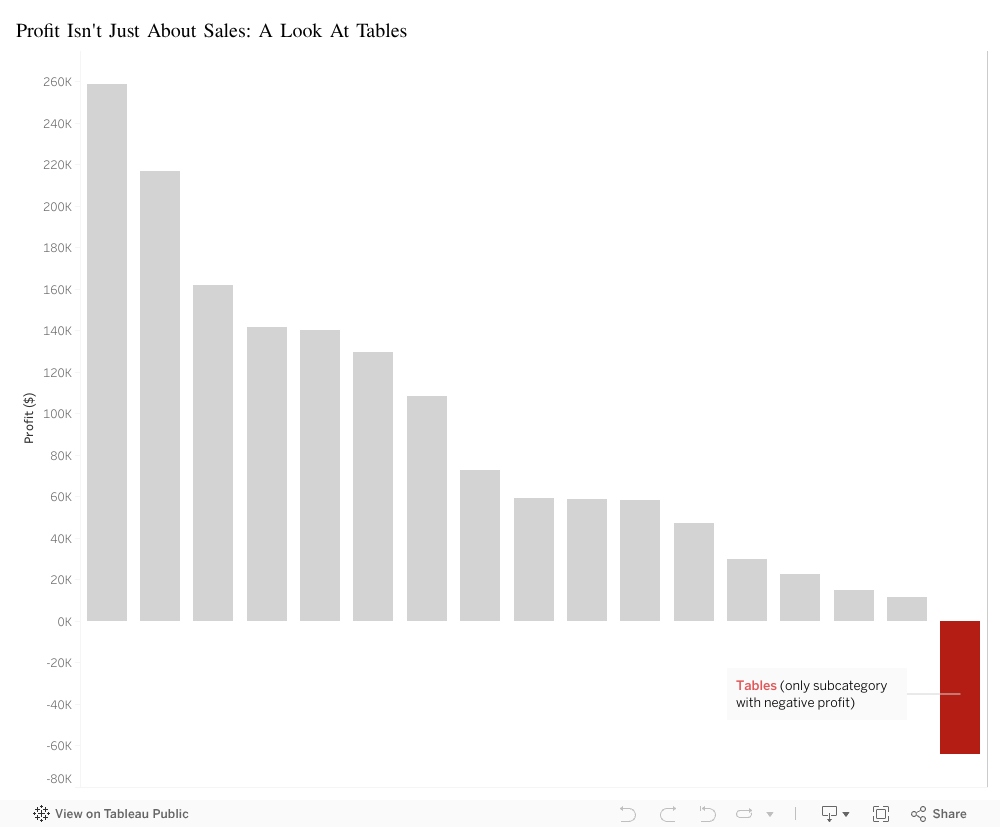
To investigate the issue, a visualization was created to compare profit across all product subcategories. The results were striking. Almost every bar on the chart showed positive profit. Except one.
Tables: -$64,083.
The only unprofitable subcategory in the entire catalog.
This finding was particularly surprising because tables were not low-demand items; in fact they were bestsellers. From a revenue standpoint, tables performed extremely well.
However, when analyzed beyond the point of sale, the underlying issue became clear. Tables carried significantly higher operational costs than any other category:
They required two delivery workers due to their size and weight
They were difficult to deliver in most Japanese apartments with narrow hallways and small elevators
They consumed significant warehouse space because of their bulky shape
They were more prone to scratches or delivery damage, leading to replacements and refunds
In short, tables were profitable at the moment of sale but unprofitable everywhere after the sale.
The business was not struggling because demand was weak- it was struggling because one high-demand product quietly erased a portion of the gains made by every other category.
Recognizing this pattern allowed the company to take targeted action to correct the issue. Several operational improvements were introduced:
Table packaging was redesigned to better withstand delivery
A modest oversized-item surcharge was added to reflect true handling costs
Warehouse organization was adjusted to reduce movement and handling time
These adjustments helped the business align its operational costs with its revenue, restoring profit balance across the catalog.
The visualization ultimately highlighted a broader lesson:
A product can be popular, well-reviewed, and frequently purchased- yet still unprofitable if its hidden costs exceed what it brings in.
Revenue alone does not determine success. Understanding the full journey of a product, from warehouse to delivery, is essential for sustaining a healthy business.
Despite being a landlocked nation with limited natural resources, Rwanda has never allowed geography to define its trajectory. What the country lacks in ocean access, it makes up for through innovation, resilience, and strategic vision. Over the years, Rwanda has built a global reputation for producing exceptional Arabica coffee, world-class tea, and premium horticulture products — commodities that have become symbols of national pride and economic progress.
As regional integration deepens and global demand for high-quality agricultural products grows, Rwanda stands at a pivotal moment. Unlocking the next phase of growth requires understanding where Rwanda exports, what it exports, and how this export structure can be strengthened to reduce dependence on costly imports.
Asia emerges as Rwanda’s most influential export region in 2024, driven largely by strong demand for the country’s premium agricultural products. Within this region, the United Arab Emirates stands out as Rwanda’s top export destination, reflecting deep commercial ties and the UAE’s role as both a high-value consumer market and a major re-export hub for African goods.
Regional neighbors like DR Congo, and global partners such as China, the UK, Belgium, and the United States, further reinforce Rwanda’s diversified export footprint.
Rwanda’s commodity breakdown reveals that the largest export category “Other commodities & transactions” is driven by its main export products: coffee and tea. These crops are not just exports; they are economic pillars that support hundreds of thousands of families and define Rwanda’s global identity.
Rwanda’s hillsides produce some of the world’s most sought-after Arabica coffee, while its highlands cultivate premium, award-winning tea. Yet most of these products are exported raw, meaning Rwanda captures only a fraction of their true value.
In 2024, Rwanda imported 2.7 times more than it exported, driven primarily by machinery, fuel, industrial materials, and manufactured goods — sectors where Rwanda still relies heavily on international supply chains.
From Agricultural Strength to Industrial Power
Rwanda has already demonstrated what is possible when challenges become strengths. Its coffee, tea, and horticultural exports have carried the nation’s identity to global markets. The next phase is about scaling that success into broader, sustainable economic transformation.
The path forward is clear:
Invest in value-added processing to capture more income from coffee, tea, and horticulture.
Strengthen local manufacturing to reduce dependence on high-cost import.
Expand regional trade to anchor Rwanda’s export presence in fast-growing African markets.
Attract investors into agro-processing, packaging, logistics, and local manufacturing.
Rwanda has the products, the markets, and the momentum.
The next chapter is simple: capture more value at home and convert export strength into national prosperity.
It is 2015, Samer (13-year-old), just got from school with a strong fever, headache, and tiredness but what was different is the swelling around his jaw area. His parents took him to the doctor and he was diagnosed with Mumps.
Days later, the school notified all parents of an outbreak in Mumps among students. And what was a school-level problem turned out to be a result of a nation-wide outbreak.
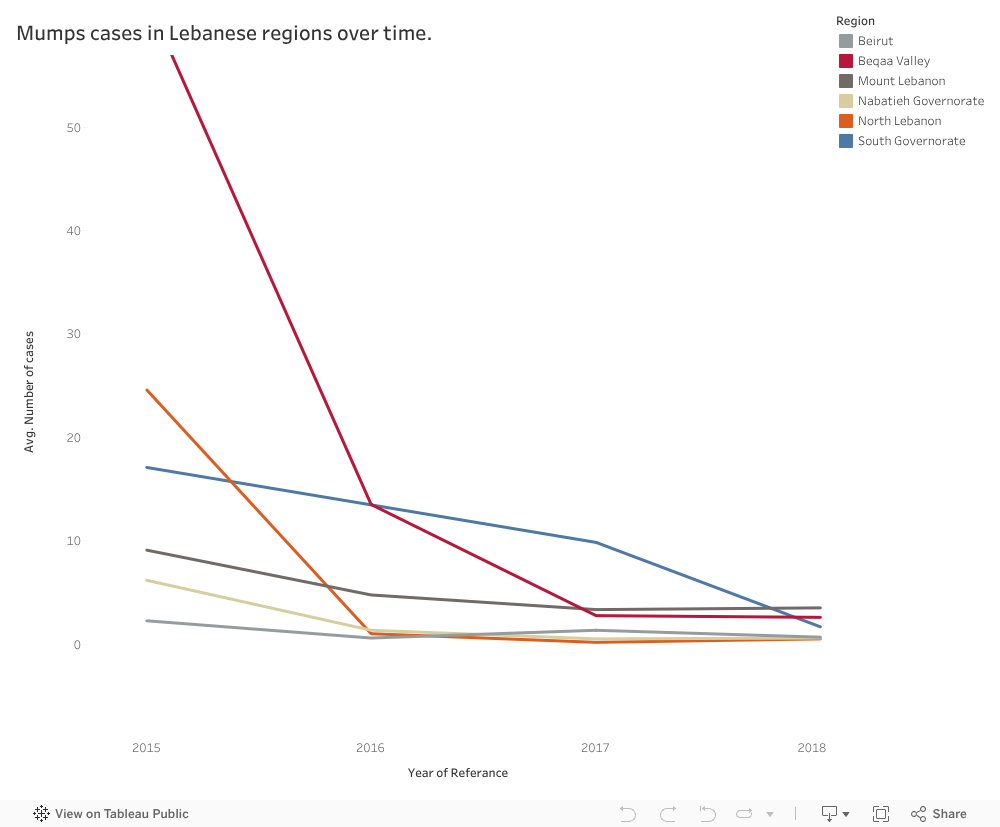
This line graph shows how the number of recorded Mumps cases in 2015 was higher than the years that followed, and this was caused primarily by outbreaks in certain governorates. For example, in 2015 each town in Beqaa valley recorded 62.5 Mumps cases over the year, another example is North Lebanon, were each town recorded on average 24.58 Mumps cases over the year.
However, after Samer, his friends and a big portion of the Lebanese citizens got vaccinated against this disease, we can see the success of those vaccination campaigns in the following years (2016, 2017, and 2018) were Mumps cases gradually decreases to reach almost zero records in towns of every governorate.
Since this shows that the authorities were able to make impact in preventing and controlling outbreaks between 2015 and 2018, then they should make sure that similar measures are constantly being implemented.
Because Mumps has a negative effect on the patient’s health, and is visible in the face region which can be mentally scarring.
The approach Ministry of Public Health must take is having a preventive plan instead of a reactive one to eliminate Mumps’ outbreaks. And this can be done through a set of actions:
Ensure ahead of time that vaccines are available at health centers before the actual date of vaccination.
Follow closely the progress of vaccination campaigns, especially in governorates with higher tendency for outbreaks.
Increase awareness concerning this disease and the importance of being vaccinated.
Benefit from lessons learned in campaigns done previously for Mumps especially between the 2015-2018 period, and how outbreaks were dealt with.
Taking those recommendations along with insights from specialists in the field will allow the MoPH to ensure the safety of citizens by preventing them from such harmful diseases. This way Samer and his friends don’t have to go through this disease that is harmful physically and disturbing.
A personal journey into the places we love, the beauty we overlook, and the opportunities we’re losing
Lebanon is a country overflowing with natural beauty, history, culture, and authentic local experiences. A place where even the smallest town holds a story, a scent of zaatar from a bakery at dawn, the echo of church bells or the call to prayer drifting across the valley, the laughter of families gathered near rivers, old souks, and mountain trails.
These moments stay with us. They shape who we are. They remind us of a Lebanon that feels peaceful, grounding, and full of life.
But beneath the familiar hotspots we all rush to, there is a deeper truth, a truth rarely captured in brochures or tourism campaigns.
Many Lebanese towns already hold everything a thriving tourism ecosystem needs… except support.
Growing up here, these towns shaped my identity. Their landscapes, their people, their rhythm, all felt alive.
Yet as I grew older, I began to notice something painful:
The towns we love are often the ones left behind.
Where Beauty Lives but Support Does Not
Before looking at individual towns, I started from a broader question:
Do the regions of Lebanon with high tourism appeal receive the infrastructure support they need?
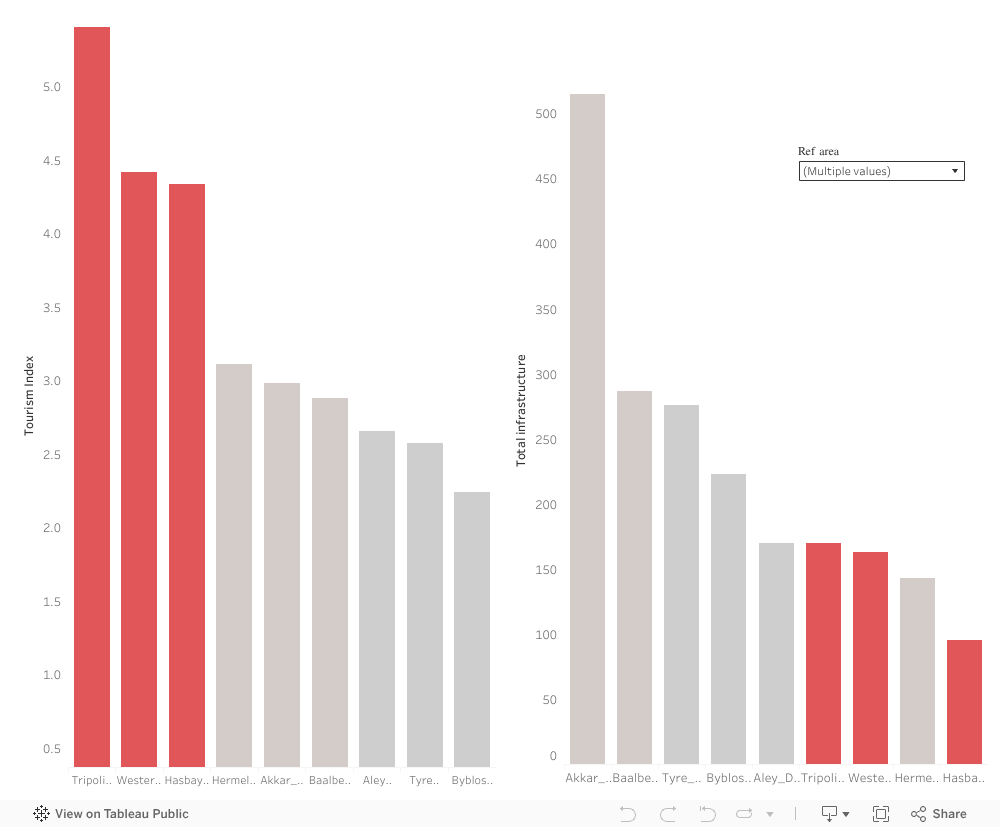
As Tourism Index shows how naturally attractive or culturally rich a region is, the Infrastructure Capacity refers to the services that allow tourism to function (cafés, restaurants, accommodations, facilities, etc.)
Some towns rise high on the “Tourism Index”, but fall flat on actual investments.
While many regions score well on tourism attractiveness, their infrastructure such roads, accommodations, public spaces, services, and tourism support systems lag far behind, making it difficult for visitors to stay, explore, and contribute economically.
This mismatch isn’t just a technical imbalance. It reflects a deeper, more emotional reality.
Some towns are seen, while others are not. Some receive attention, while others remain forgotten.
And the ones left behind are not lacking in beauty, they are lacking in support.
We already see what happens when beauty is supported. Regions like Baabda, Akkar, and Matn, all scoring high on both Tourism Index and infrastructure, thrive simply because they were given the basics. They are the proof of what every overlooked town could become with just a little support.
Beauty and heritage exist everywhere in Lebanon, yet so much of it continues to wait quietly for the support it deserves.
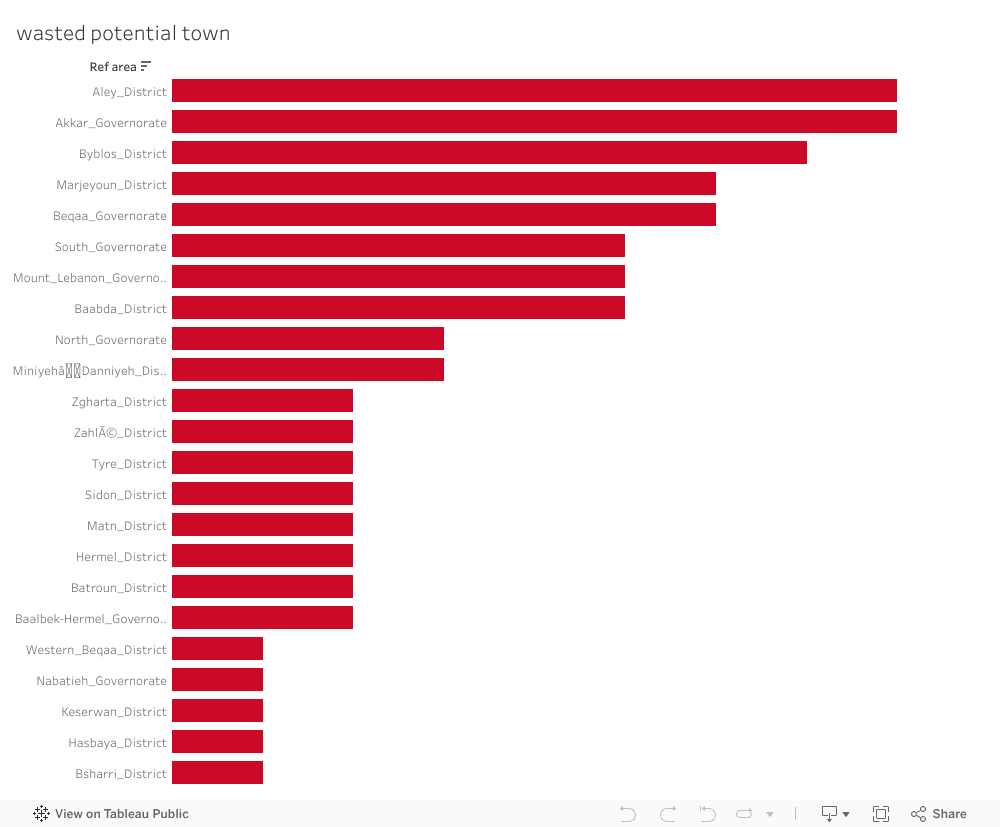
Each bar represents a town that has natural beauty or cultural heritage, but zero visible tourism development. These are places with stories, landscapes, and identity waiting silently for investment.
Over the years some Lebanese towns have received tourism-related initiatives. But when we look only at towns that already have attractions, a striking pattern appears:
Most of them, despite having natural, cultural, or historical treasures , received no initiatives at all.
No projects;
No funding;
No development;
No strategy;
Just silence.
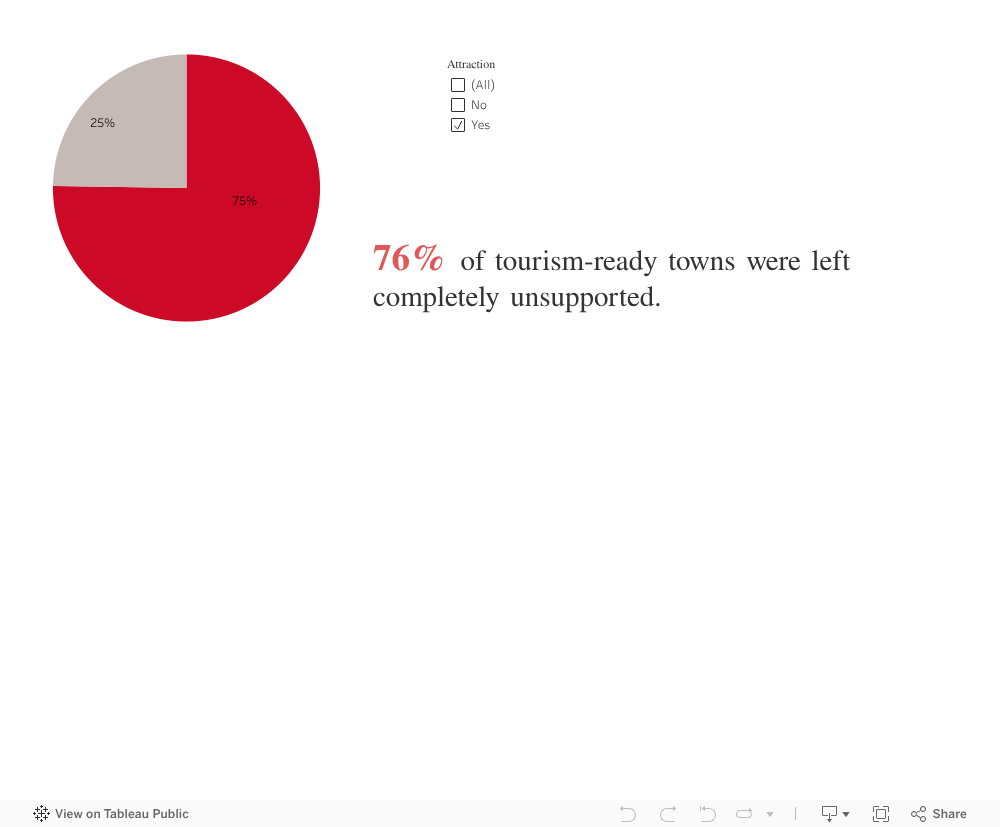
The Hardest Truth: Even the Most Attractive Towns Receive Nothing
Some may argue: “Maybe those towns don’t have attractions.”
But when we look closely at towns that already possess attractions, the painful truth becomes impossible to deny.
Potential without support becomes a burden. Towns that could thrive remain stuck. Communities that could flourish stay stagnant. And the tourism narrative becomes narrower, excluding places that rightfully belong in it.
The towns most ready to be activated are often the ones completely overlooked.
3 out of 4 received no support. None.
This is not a coincidence. It is not a gap.
It is a systemic misalignment between where potential exists and where initiatives are delivered.
These are towns where: visitors already come, landscapes already impress, heritage already exists, infrastructure is partially there. Yet development never reaches them.
Looking at the Data as a Lebanese Citizen
When I step back, not as a student, not as an analyst, but as someone who grew up here, the message becomes clear:
We have so much beauty, but we overlook it.
We have so much potential, but we do not unlock it.
We have communities waiting, but no one comes.
We have foundations ready, but not activated.
The problem is not the towns.
The problem is the absence of action.
Every chart you saw above points to the same conclusion:
Lebanon’s opportunity is not in discovering new places, it is in believing in the ones we already have.
Imagine what would happen if:
Aley’s cafés received marketing and infrastructure upgrades, Akkar’s hiking trails were formalized Byblos’ surrounding villages received preservation grants Hasbaya’s guesthouses were connected to tourism.
platforms, Baalbek-Hermel’s rural attractions were promoted, Marjeyoun’s landscapes were protected and activated…
These are not dreams. These are realistic, steps, and now we know exactly where we should begin.
Lebanon does not need to invent new beauty. It simply needs to believe in the beauty it already has.
The potential is real. The foundations exist. The opportunity is now. What we need… is action.
Back in 2020, walking through Beirut felt different. The city that once overflowed with tourists, weekend travelers, and the constant shuffle of suitcase wheels had fallen unnervingly quiet. Streets that were normally alive with hotel valets, café chatter, and late-night crowds echoed instead with a stillness that was impossible to ignore. That silence was more than a mood—it was data waiting to be understood.
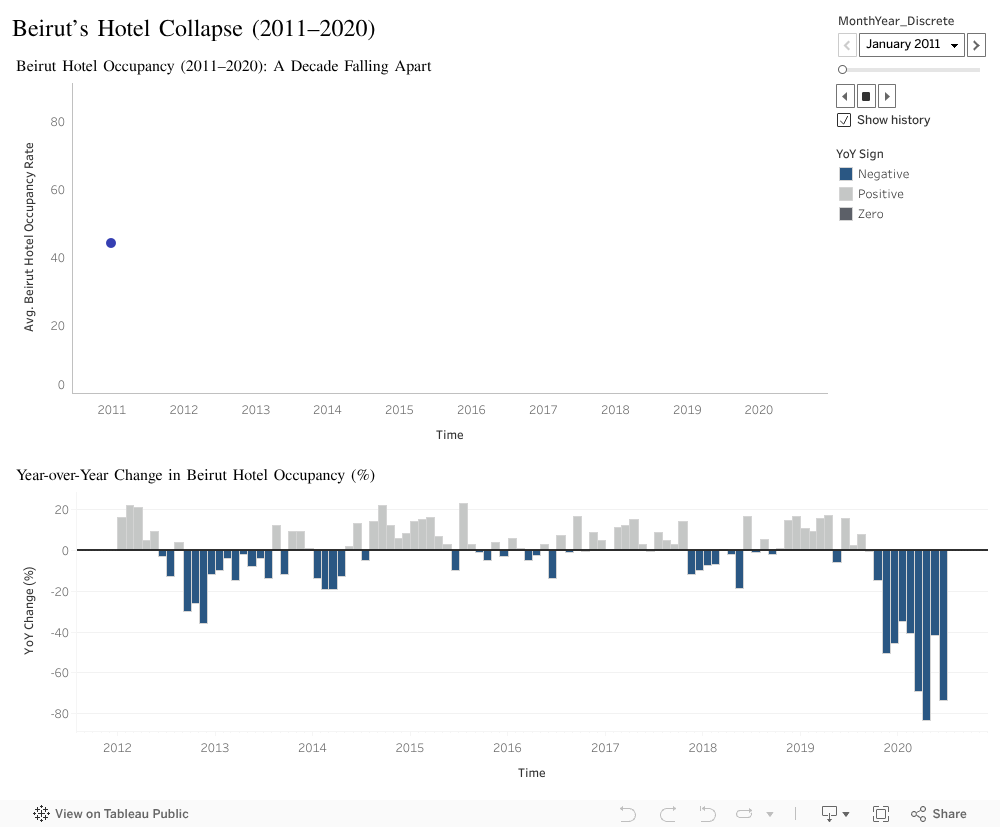
In this visualization, I retrace monthly hotel occupancy rates in Beirut from 2011 to the first half of 2020. For nearly a decade, the line moved in recognizable waves—seasonal peaks, predictable dips, and fluctuations shaped by politics, tourism cycles, and local instability. Despite everything Lebanon had endured, the hospitality sector kept finding its rhythm again.
But as the animation approaches late 2019 and early 2020, something shifts. The familiar pattern fractures. The line doesn’t simply decline—it collapses.
Watching the animation month by month feels almost like watching Beirut lose its breath in real time. In January 2020, occupancy was already strained. By March and April, the numbers didn’t just dip—they plummeted to historic lows. The hotels that once hosted conferences, weddings, and tourists from across the world were suddenly empty.
To make the scale of this collapse clearer, I use a second visualization: the year-over-year (YoY) change. For years, even amid disruptions, positive and negative bars balanced each other out—losses were recoverable, gains still appeared. But in 2019 and especially 2020, the bars plunge into deep negative territory. Some months show declines of more than 70%, marking the most severe contraction the sector had ever experienced.
This wasn’t a gradual decline. It was a cliff.
The causes were layered: the economic crisis accelerating through 2019, the nationwide protests, the currency collapse, and the early months of the COVID-19 pandemic. All these forces converged so quickly that a sector built over decades unraveled in mere weeks.
Seen animated, the data becomes a visual narrative of this unraveling—the rhythm of a city interrupted, its resilience stretched past its breaking point.
Big Idea:
What happened in 2020 was not a slowdown: it was a breaking point. The collapse of Beirut’s hotel occupancy reflects a sector that had survived everything until several crises finally hit at once. The data makes one message clear: when pressure builds over years, failure can arrive all at once, and without warning. Recovery has fortunately already begun, which makes it essential for policymakers to strengthen early-warning systems and support mechanisms so that the hospitality sector can withstand future shocks more effectively.
If you’re Lebanese, you know that coffee is more than a drink. It’s a companion for all occasions; from kick-starting your morning with an energy booster, to a beverage to enjoy while having conversations with family and friends, and especially during late-night studying. It’s how we wake up, how we host, and how we quietly share connection and love.
With that in mind, I wanted to look at coffee from a different angle: through data. Using a dataset of transactions from a café, I explored:
Which drinks are most popular
How consumption changes across the time of day
Which hours are the busiest
And how daily revenue fluctuates across the week
The goal is simple: if coffee is so central to our culture, when exactly are we showing up, and what are we ordering?
Why does this matter? Café owners find it hard to know exactly when to staff up and which drinks to push.
This visualization ranks drinks by total revenue. A few patterns stand out:
Lattes and Americanos bring in most of the money, with a balanced consumption of each drink throughout the day.
Other drinks, such as Cortado and Hot Chocolate are also consumed but at much smaller level compared to their counterparts.
Despite having many options to choose from, individuals tend to enjoy the classics. These are the drinks that keep the line moving and the espresso machines busy.
Next, I looked at revenue by hour of day. This gives us a clear view of when people frequent cafés the most. The pattern is very typical:
A strong morning rush between roughly 8:00 and 10:00 AM as people grab coffee on the way to work or university.
A smaller afternoon bump, around 3:00 to 5:00 PM, when people need a second boost or meet friends.
Sales gradually drop off into the evening.
These are the hours when extra baristas would be needed the most, and popular drinks should be front and center to keep service fast.
Time of day isn’t the only dimension that matters. I also wanted to know:
Are some days of the week more predictable than others?
This boxplot shows the distribution of daily revenue for each weekday:
The middle line in each box is the typical (median) daily revenue.
The height of the box and whiskers shows how much that day’s revenue can fluctuate.
From this view:
Weekdays tend to have higher median revenue than weekends.
Some days, especially mid-week and Friday, show taller boxes and more high outliers, meaning they can be very good or just average.
Weekends (particularly Sunday) are a bit calmer: slightly lower but more stable daily sales.
So if you’re planning staffing or inventory, weekdays are where you need more flexibility, while weekends can be managed more steadily.
Because most revenue comes from weekday morning and late-afternoon peaks driven by a few core drinks, we should staff and promote around those windows to serve faster and sell more