UN 2030 Agenda ensures sustainable health improvements worldwide and also serves as a measure of overall health system performance. One of UN goals is to support SDG 3.1 which aim to reduce the global maternal mortality ratio to less than 70 per 100 000 live births.
For decades, Canada has been known for its world-class healthcare system. But when we visualize the Maternal Mortality Ratio (MMR), the number of maternal deaths per 100,000 live births leads to a surprising trend emerges. Instead of declining, maternal deaths have risen steadily over the past twenty years, even before COVID-19 struck.
The time series reveals a striking pattern:
In 2000, Canada recorded its lowest MMR.
By 2020, the ratio had climbed to 16.65, before slightly falling to 13.58 in 2021.
This spike coincides with pandemic-related healthcare disruptions, yet the broader upward trend began long before COVID-19.
The broader upward trend points to more systemic shifts and several underlying factors may help explain this pattern. First, enhancements in data systems and maternal health surveillance (particularly after 2010) likely improved the accuracy of maternal death classification, leading to more comprehensive reporting. Second, demographically Canadian women are increasingly delaying childbirth and advanced maternal age (35 and above) is associated with greater likelihood of complications such as hypertension, gestational diabetes, and cesarean-related risks. Third, the rising prevalence of obesity among women of reproductive age has introduced additional obstetric challenges. Together, these factors suggest that even in resource-rich contexts, evolving demographic and health trends can drive higher maternal risk, underscoring the need for proactive, data-informed maternal care strategies.
When visualized globally, Canada’s upward trend contrasts with the steady declines in many developing countries. The gap reminds us that wealth alone does not guarantee maternal safety, policy vigilance and data-informed care do.
Despite technological and medical advances, Canada’s rising maternal mortality highlights a critical truth: progress in healthcare is not linear. Data-driven vigilance, continuous system evaluation, and addressing social determinants of health are essential to ensure that every mother’s life counts.
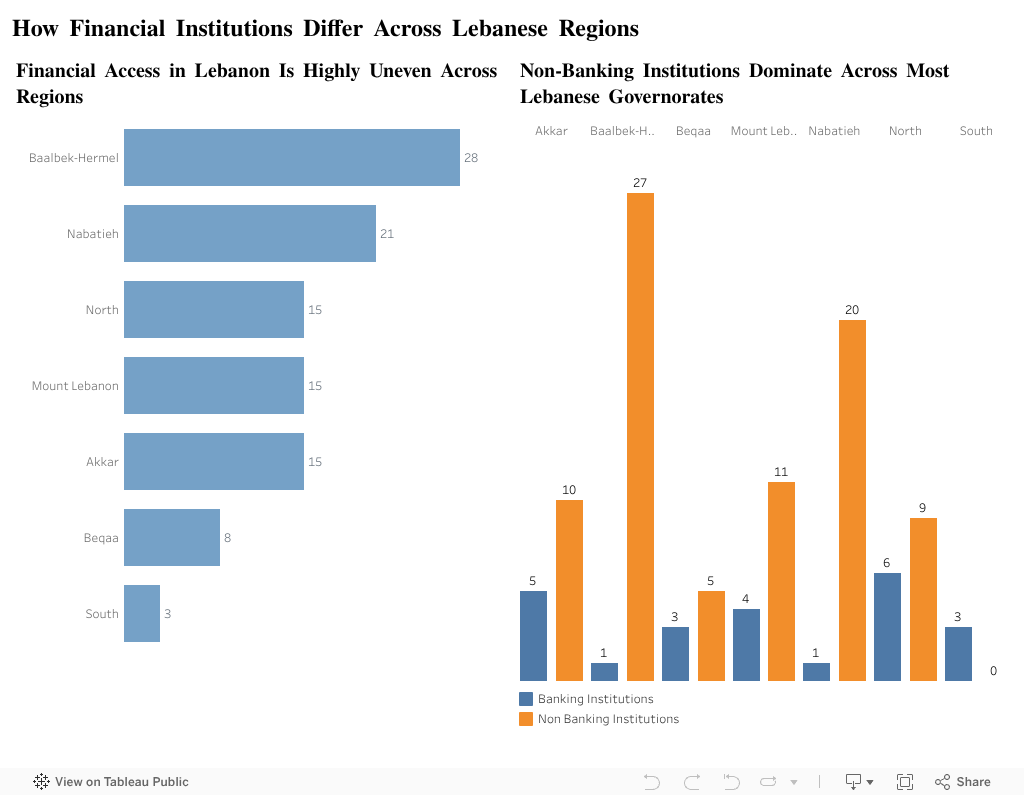
In Lebanon, where you live determines much more than scenery or lifestyle, it quietly shapes the financial services you can access. For many communities, financial institutions are the backbone of how people save, borrow, and plan their futures. But what if that backbone isn’t equally strong everywhere?
As soon as we break the numbers down, the imbalance becomes unavoidable.
Some regions — like Baalbek-Hermel and Nabatieh — appear well-served, hosting the highest counts of institutions.
Others, especially the South, have only a handful, making financial access significantly more limited.
Then the story takes its first real turn when we separate banks from non-banking institutions:
Non-banking institutions dominate nearly every governorate, often by a wide margin.
This raises the dramatic question:
If banks are the exception, what does financial access actually look like across Lebanon?
The implications are real:
In regions with very few institutions, people must travel farther, pay more, or rely on informal channels.
In regions with many institutions, non-banking organizations still dominate, shaping how communities interact with money.
The struggle isn’t about having some financial services , it’s about which services are available, and what that means for people trying to manage their financial lives.
The story ends with a clear understanding:
Lebanon’s financial landscape is not only uneven, it is structurally different from one region to another.
Recognizing this imbalance is the first step toward improving financial inclusion. If we want to strengthen financial resilience across Lebanon, we must:
Address regional disparities in financial access.
Understand the key role non-banking institutions play for many communities.
Acknowledge that where people live directly shapes the financial tools they can depend on.
Ultimately, this visualization calls us to rethink how we define “financial access”, and to consider how policy, investment, and community support can bring the system back into balance.
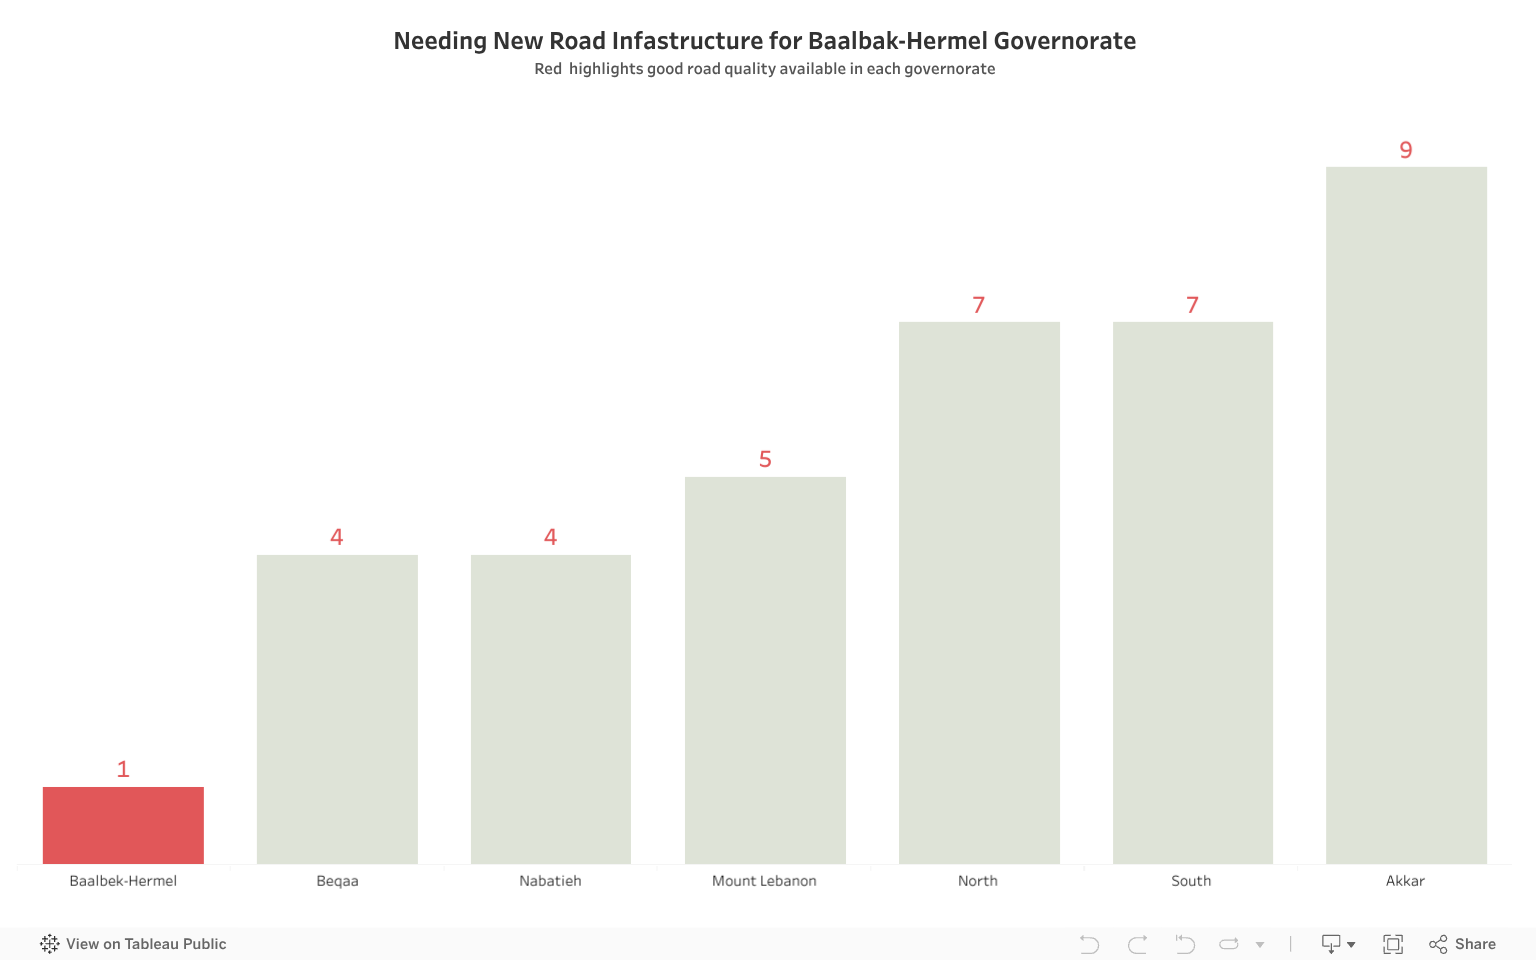
Elsie is a young girl living in a small village in the Baalbak-Hermel Governorate. Every morning, she wakes up before dawn, brushes her teeth, gets dressed and packs her school bag. However, her journey to school is not like that of other children across Lebanon.
The roads Elsie travels on are cracked, uneven, and often flooded in winter. Can you imagine? Cold weather and muddy shoes?
For her, education feels like a distant dream, not because of lack of ambition, but because of the poor quality of the roads that connect her to opportunity.
This is not just Elsie’s story, it is the story of an entire governorate.
Poor infrastructure of roads leads to:
Town isolation: Travel becomes difficult and inconvenient whether on foot or by car.
Unsafe: Roads are not prepared for harsh weather, making them susceptible to flooding and destruction.
Unreliable: Poorly made roads will have any cracks, holes and bumps. Placing the car & those inside it in danger, if one is not already familiar with the road.
Among all Lebanese regions, Baalbak-Hermel governorate has the lowest number of good road quality. The lack of infrastructure is not just inconvenient, but a barrier to growth, dignity, and equality.
But here lies the opportunity: with targeted funding, we can transform these roads into opportunities. Where better road quality means:
Students like Elsie arrive safely and on time to their schools.
Emergency services reach families when they need them most.
Businesses see Baalbak‑Hermel not as a forgotten corner, but as a region ready for investment.
This is not just about asphalt and concrete, it is about justice. Every Lebanese governorate deserves equal access to safe, reliable roads. By investing in Baalbak‑Hermel, we are not only repairing infrastructure; we are repairing trust, opportunity, and hope.
When you think of Lebanese tourism, certain names instantly come to mind: Byblos, Baalbek, Jeita Grotto, Tyre…These iconic destinations dominate our tourism narrative, drawing visitors from around the world.
But what about the places that don’t make it onto postcards or Instagram feeds?
If you grew up in the late 90s or early 2000s like I did, you probably remember the sound of dial-up internet, the first Nokia phones, and the excitement of discovering something new online every day. Back then, the idea of a “digital currency” felt like science fiction, the kind of thing we’d joke about on MSN Messenger.
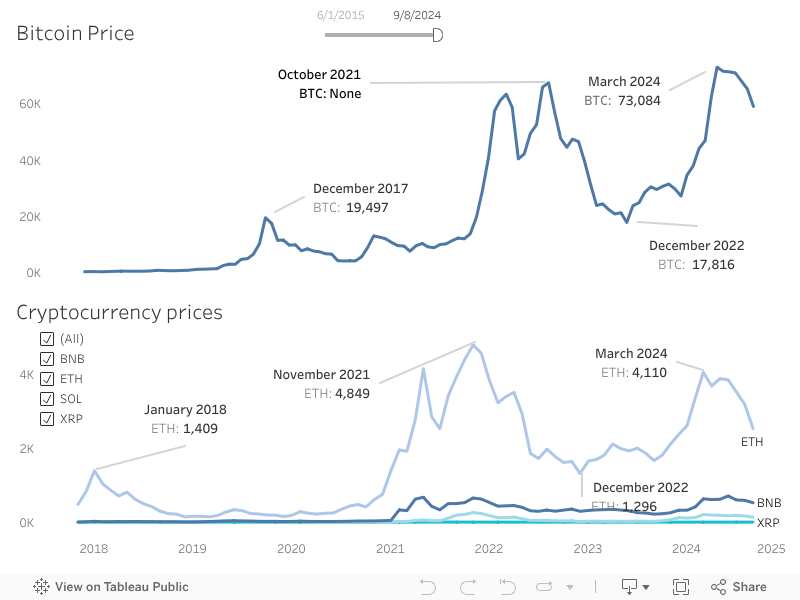
But in 2008, a mysterious person named Satoshi Nakamoto dropped the Bitcoin white paper, and by January 2009, Bitcoin came to life. No banks. No government. Just code, hope, and a new way of thinking about money.
I didn’t understand it at first, so I kept reading. That’s also when I learned about the Bitcoin halving, a built-in event every four years that cuts the new supply in half. The halvings in 2012, 2016, 2020, and 2024 each played a huge role in Bitcoin’s price, almost like a heartbeat that keeps the market alive.
Soon the crypto universe expanded. XRP came in 2012, Ethereum in 2015, BNB in 2017, and Solana in 2020. Each one brought something different, and suddenly crypto didn’t feel like a joke anymore, it felt like the future.
Back then, people believed crypto lived outside the real world, like a safe haven where governments couldn’t interfere. But life has a way of proving us wrong.
March 2020: the Covid crash:
I still remember watching the charts that week. Bitcoin fell from around $9,000 to below $5,000. Ethereum dropped, and BNB, XRP, and even the newborn Solana were hit hard. It didn’t matter that the Bitcoin halving was just weeks away, fear was stronger.
2018-2019: U.S.-China economic war:
I used to think crypto was immune to politics. But during the trade tensions, Bitcoin collapsed from $19K to under $4K, and Ethereum slipped under $100. Every other coin blindly followed.
November 2022: The FTX disaster
This one felt personal. FTX was everywhere: ads, influencers, celebrities. Everyone trusted it. Then suddenly, in a single month, it collapsed. Bitcoin fell below $16K. Solana lost more than 60%. ETH, XRP, and BNB prices all fell down.
That’s when I understood the truth:
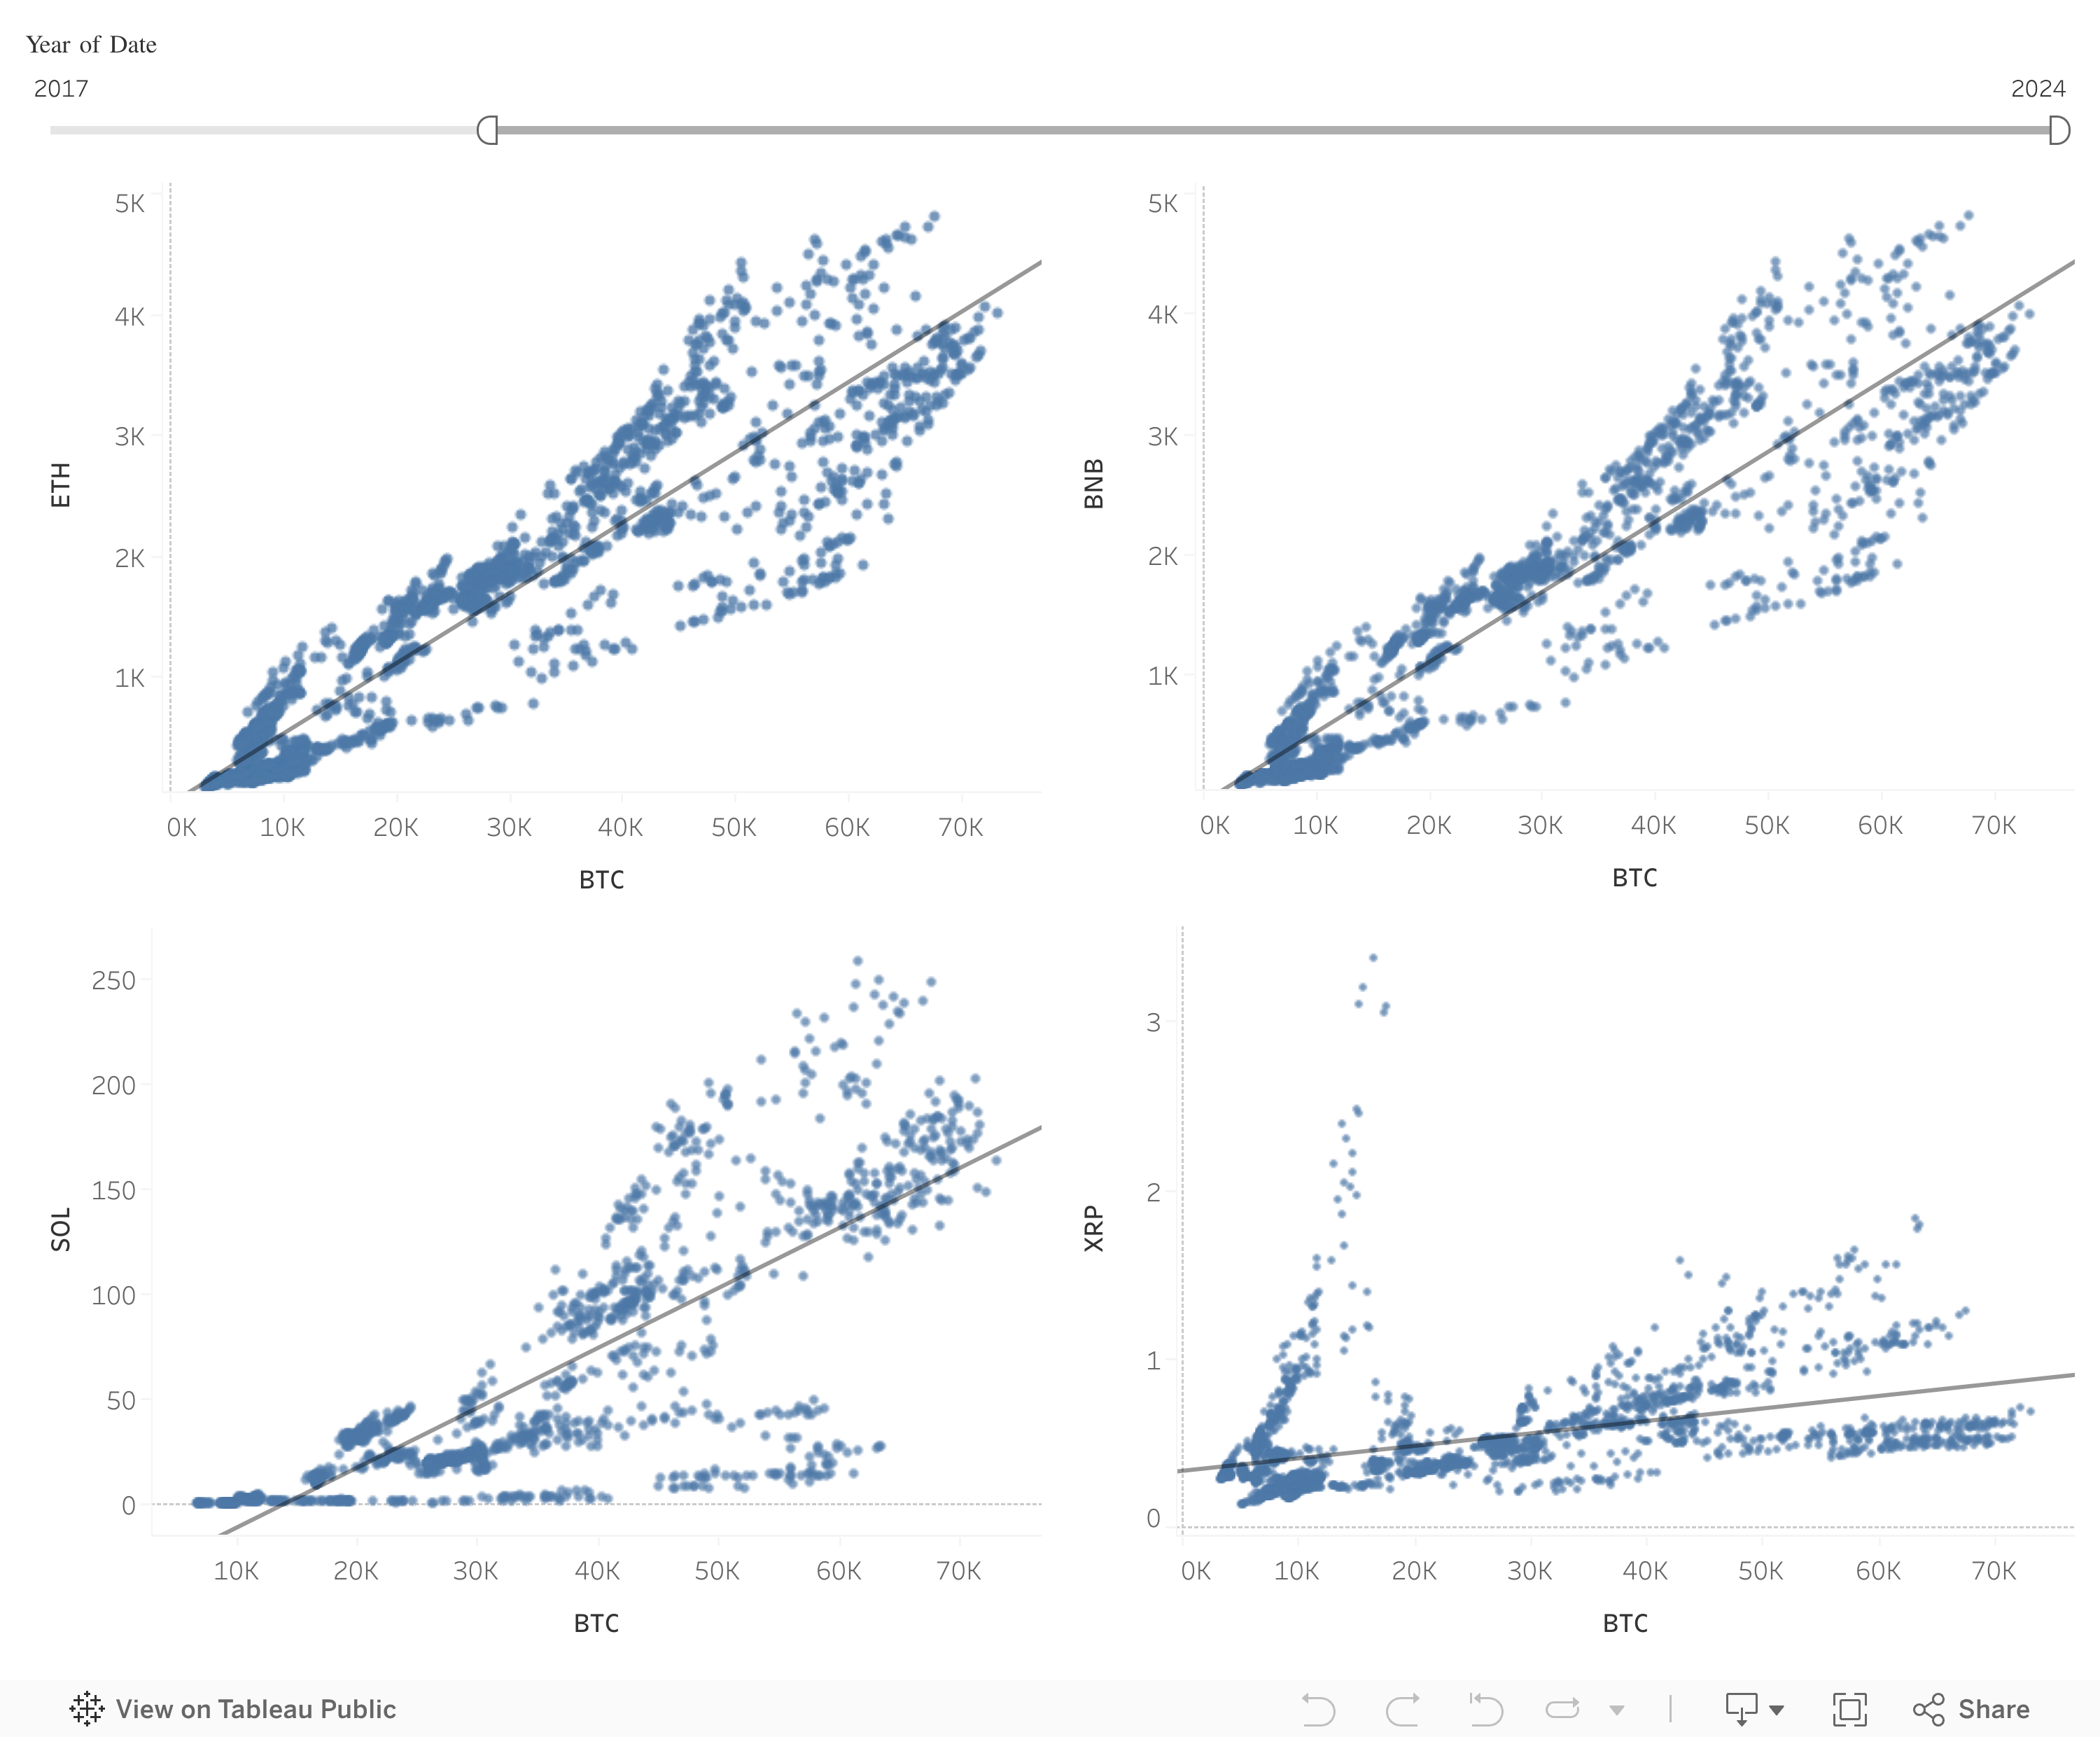
Bitcoin might be the leader, but none of these coins live in a separate universe. They all move with world events, pandemics, politics, scandals, fear, and hype.
And the more I studied historical data, the clearer it became:
2009 – Bitcoin launches
2012, 2016, 2020, 2024 – Halvings shape the market
2015 – Ethereum expands crypto beyond money
2018–2019 – Economic war knock down the market
2020 – COVID shakes everything
2022 – FTX shows how fragile trust can be
All of these moments changed the price of the coins. And honestly? They changed my understanding of crypto too.
If there’s one thing I’d tell someone from the early 2000s trying to understand crypto, it’s this:
Crypto is not separate from the world. It reacts to everything, from a virus to a political argument to a failed exchange. Bitcoin leads, and the others follow.
And that’s why historical data matters.
It teaches us that crypto is not independent; it’s just another part of the global story we’re all living in.
The digital environment in Lebanon is now as important as the physical one. Whether it’s students attending online classes, businesses relying on cloud tools, or families staying connected, internet access today is a basic necessity and not a luxury.
However, just like Lebanon’s infrastructure, internet access is not equal throughout districts. Some regions enjoy strong, stable connections, while others lag far behind, struggling with unreliable or limited access.
In order to determine which districts in Lebanon are underserved and which are setting the standard for digital access, this visualization examines the availability of internet services throughout the country.
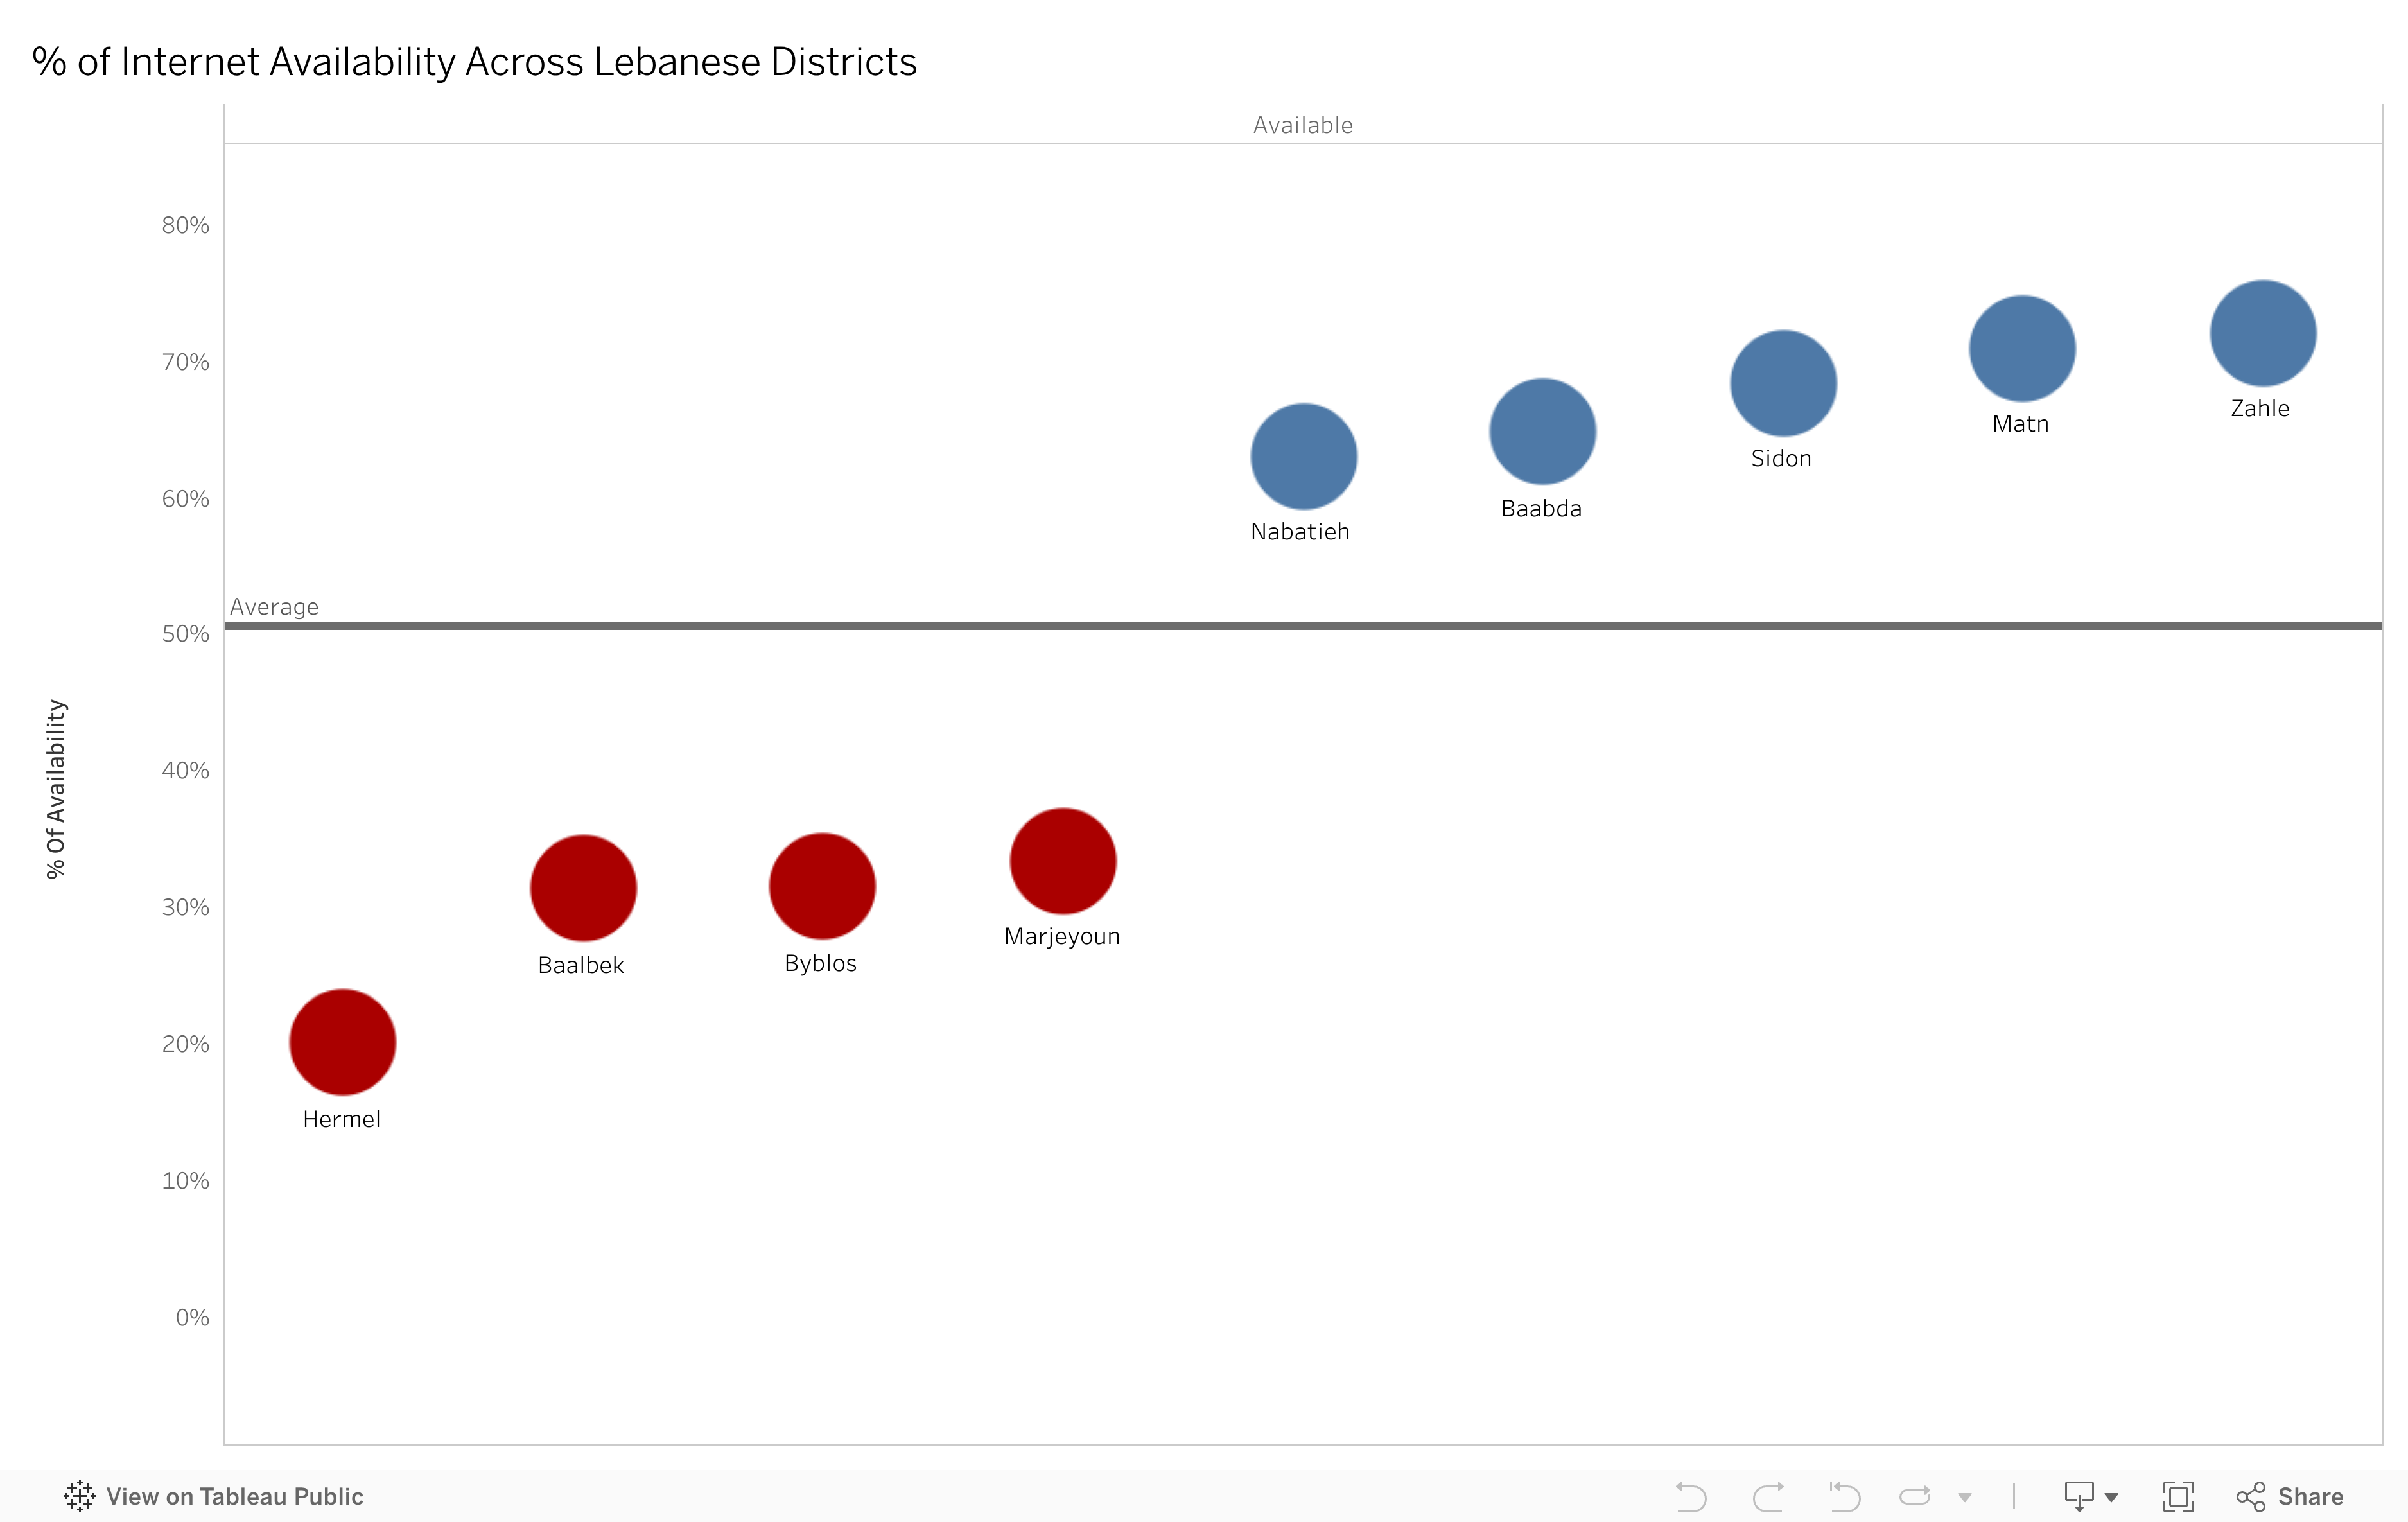
Scatter Plot – Internet Availability by District : This scatter plot demonstrates each district’s percentage of available internet, with respect to the national average line. Blue dots reflect districts above average availability and districts with below-average availability are shown by red dots. This makes it easier for us to quickly determine who is leading and who is having difficulty.
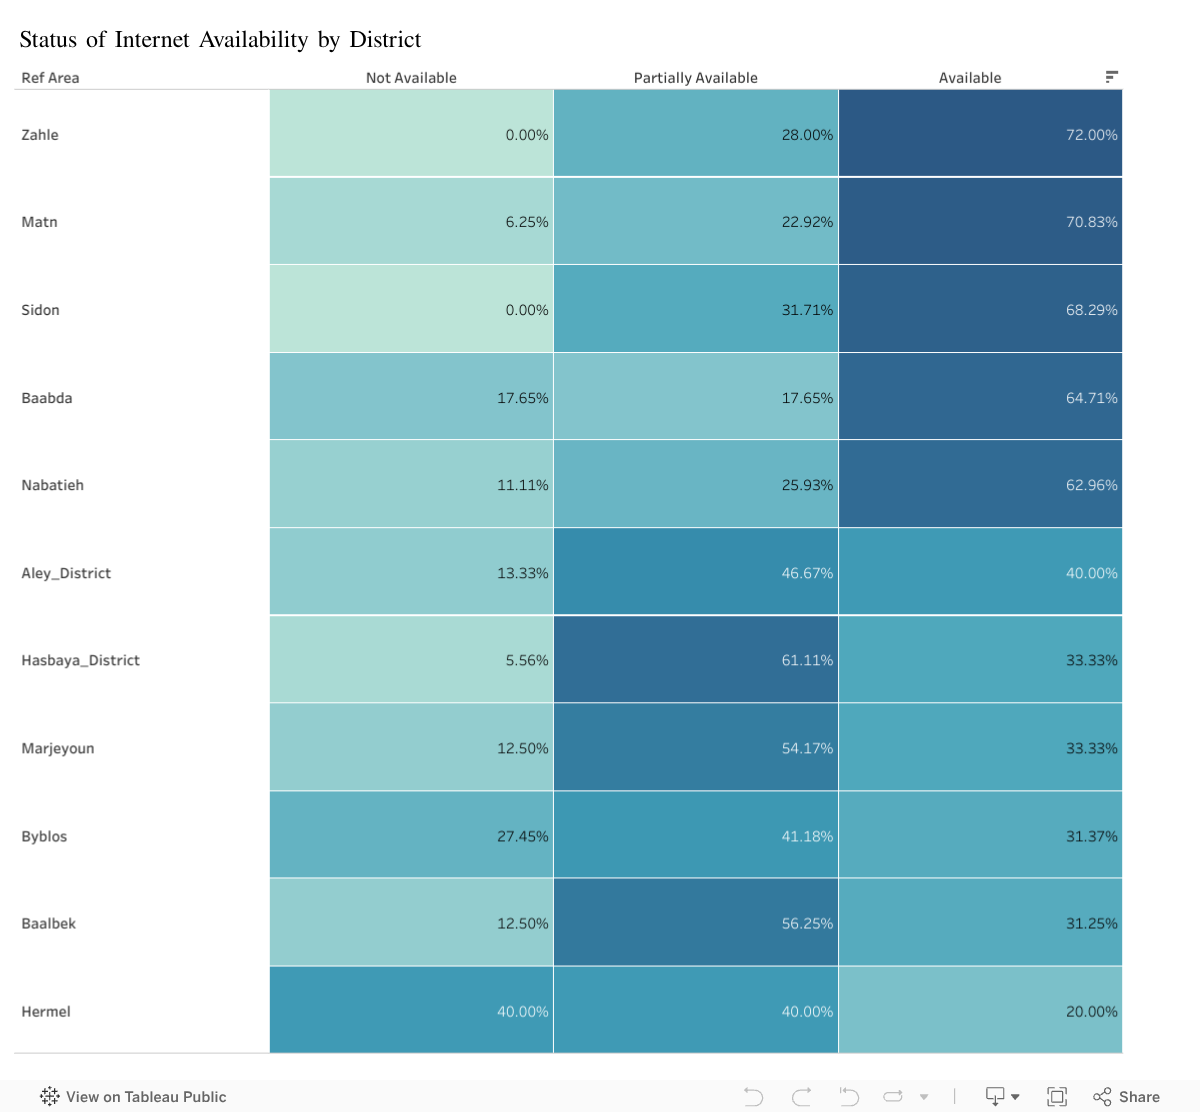
Heatmap – Full Breakdown of Internet Status : The distribution of each district is shown on the heatmap across (Not Available, Partially Available, Available). This provides a broader perspective, showing not just the amount of internet that is available but also the amount that is unstable or unavailable.
The two images together provide a complete picture of the digital divide in Lebanon.
Key Insights
Zahle and Matn Lead the Country Districts like Zahle, Matn, Sidon, and Baabda show the highest levels of internet availability, reaching 68 – 72%.
This indicates that these regions are Lebanon’s most digitally accessible areas where there’s a crucial advantage for education, business, and services.
A Significant Gap in Underserved Districts Districts like Hermel, Baalbek, Byblos, Marjeyoun fall well below the national average with availability rates around 20 – 33%. Which indicates that these areas still face major barriers to connectivity that is affecting economic activity, education, and access to online services.
Partially Available is completely the opposite of Reliable The percentage of “Partially Available” internet is unexpectedly high in a few of districts.
This indicates that although the service is available, it is unstable or inconsistent, resulting in another kind of inequality where people have access to it but it isn’t reliable enough for everyday needs.
Why This Matters
Internet access is now tied to:
Educational opportunities
Business growth
Access to digital government services
Healthcare communication
Social inclusion
Regions with poor connectivity risk falling further behind which will increase the gap in economic and social inequalities. Internet infrastructure directly shapes a region’s ability to participate in the digital economy.
A Call for Digital Equity Lebanon needs fair internet, not just faster internet. This visualization highlights where investment is most needed. Increasing internet accessibility in poorer regions can benefit students, small enterprises, open doors, and reduce regional disparity.