Sarah, a 20-year-old housewife, gets beaten up every time by her husband for not being able to cook, and she totally agrees that he has the right to do that. And there are many others like her!
Violence against Women from their partners is one of the most widespread public issues affecting the individual, family, and community. As not only does it affect the women’s mental and physical health, but also that of their children, relatives, and neighbors. Thus, it is important to tackle the reasons behind it.
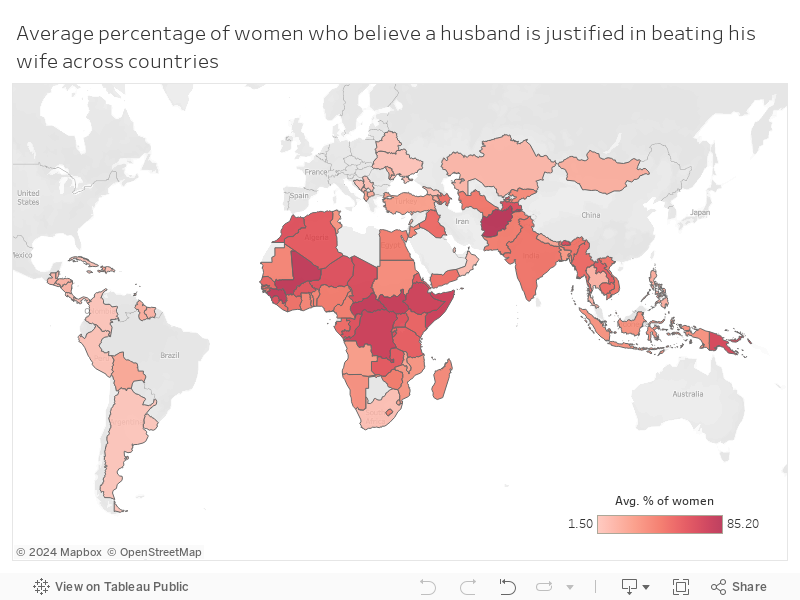
Shockingly, the proportion of women who believe that a husband is justified in beating his wife is high and increasing worldwide. For instance, an average of 53% of women and girls worldwide believe that men are justified to beat their wives. The highest concentration of this positive attitude towards domestic violence is in Africa, south Asia, and west south America.. Use the graph below to discover the percentages of each country. Tap anywhere to view the top countries (countries with highest percentages of women justifying the husbands’ violence).
Women believe it is justifiable for men to beat up his wife when she:
Argues with him
Refuses to have sex
Burns the food
Goes out without telling him
Neglects the children.
Among these reasons, neglecting the children constitutes the top reason of justifying domestic violence with 26.32%.
But why is this the case?
Early marriage highly impacts this mindset. Child marriage limits the young girls’ power, resources, knowledge, social support, freedom, and independence. Young married girls have little power in relation to their husbands and in-laws, which makes them believe that a man is sometimes justified to beat his wife. For instance, Girls who marry early are more likely to believe that a man is justified in beating his wife than women who marry later. As seen in the figure below, there is a very strong correlation between the number of women who were married early and number of women who believed that husbands are justified in beating their wives throughout the years.
Also, a negative correlation with the total governmental expenditure on education is shown, implying that government can play a huge role in limiting this mindset, through increasing their expenditure on education as it has shown a great influence on the proportions of early marriage, and women believing it is okay to beat up wives. For this reason, laws should be released to prohibit early marriage and motivate girls to get higher educational attainment.
Having equality in educational attainment among genders will empower women and stop them from accepting to get beaten up by their husbands. This is related to goal 4 of the UN, which considers eliminating the disparities among genders to ensure equal access for all to affordable and quality technical, vocational education among all levels: tertiary, primary secondary and higher education.
Finally, Education is essential, but allowing young people’s voices to be heard is also crucial to empowering the next generation. If women feel heard, they will feel more empowered and thus they are more likely to instigate change.
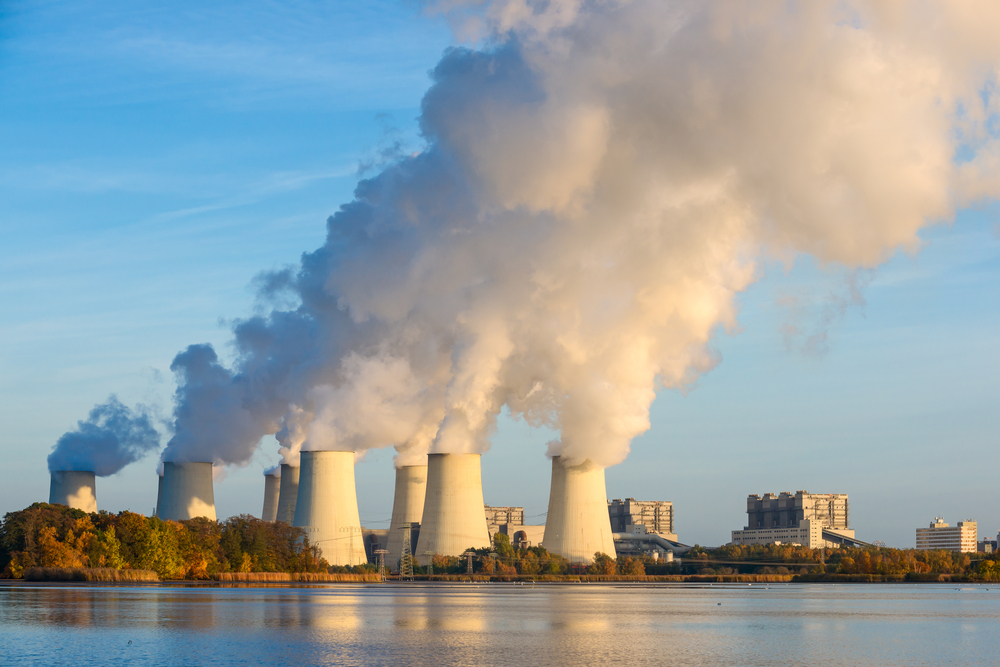
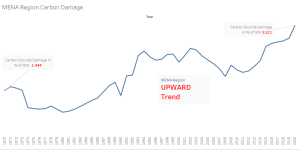
Carbon emissions has always been a main driver behind the increased air pollution in different countries. These emissions are dangerous on the human wellbeing and on the nature\earth and specifically, the MENA Region Carbon Dioxide Damages have increased dramatically from 1970 till 2020.
Did You Know? A real Problem!
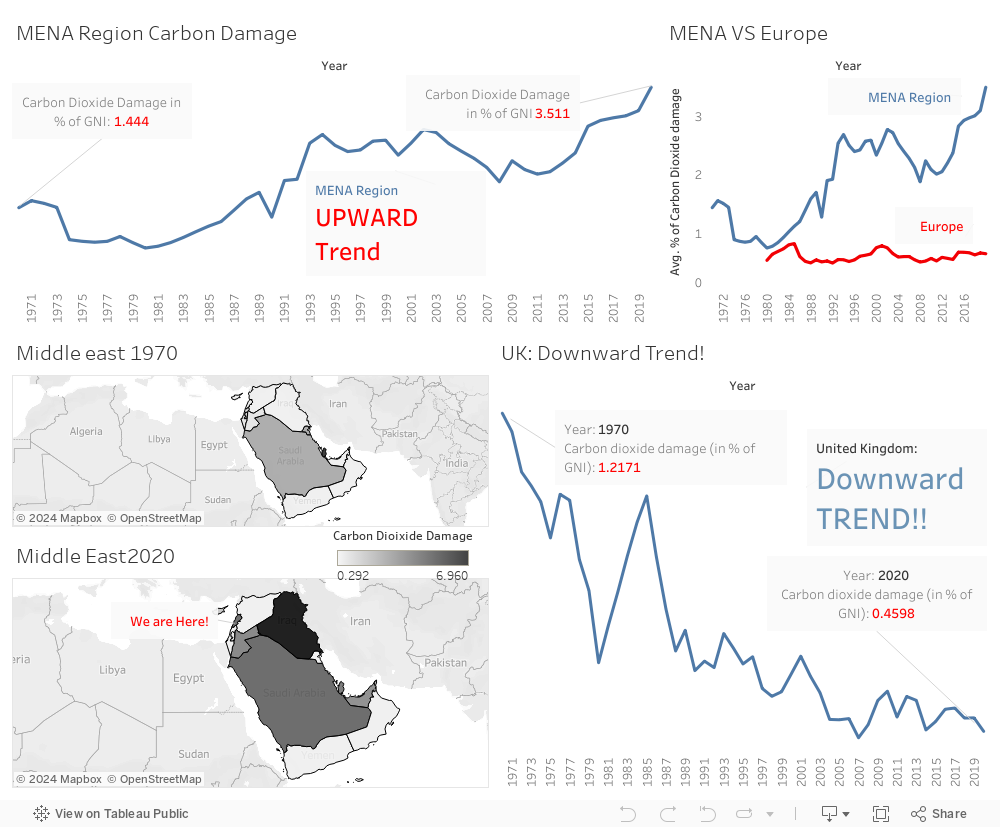
In the previous figure, Data and statistics proves the correctness of our statement as it is evident that there is a considerable increase in the carbon dioxide damages from 1.4% of GNI in 1970 to 3.5% in 2020 and this is a 500% increase, so, necessary precautionary measures like relying on eco-friendly power sources should be adopted by countries. # SDG # SDG7.
One might thing that this is expected because all industries are getting advanced, but wait second, let us look at Europe Carbon emissions compared to our region:
Europe is working to reduce its carbon emissions as we notice the downward trend (shy), and we can notice how the gap is getting wide throughout the years while comparing Europe carbon damage to MENA region carbon damage.
What About Lebanon and Neighbours?
We all know that we care more about the region we’re living in (Lebanon and its neighbours); so, let us zoom in to the middle east region only:
Unfortunately, looking at these two maps, we can see how the colours are getting more and more darker from 1970 to 2020 indicating that the carbon damage is increasing dramatically, and this is including Lebanon!
Potential solutions:
Government should introduce alternative energy sources for electricity like solar panels and wind turbines for lower carbon emissions.
Government Reduce number of flights and car travels by increasing the taxes. For example, countries should increase the tax on private flights and car drivers. Consequently, people would rely on public transportation!
Believe it or not
These two steps only are enough to reduce the carbon damage by more than 35%!
Want a real proof?
Following the solution details mentioned, United Kingdom was able to Decrease Carbon Damage by more than 37%, and the downward trend is extremely clear in this visualization:
What to do now?
Just imagine how big this problem is! This will ask for an action, and definitely the doable solution is already mentioned, and here is UK!
Growing old without social protection or a state pension scheme in Lebanon: the rule rather than the exception!
This story is about Mohamad, and every other working Lebanese citizen, who have worked for the vast majority of their adult life and are now approaching retirement age. However, they do not have a state pension simply because their governmentfailed to replace the current Lebanese “Temporary (1963)” End-of-Service compensation with a state pension scheme based on capitalization from employees’ contributions that would provide a safety net to retirees and elderly.
Globally, over the last 60 years life expectancy has increased noticeably, and Lebanon is no exception. A Lebanese born today has a life expectancy of 79 years. That is 16 years longer than someone born in 1960. The Crude Birth rate has dropped from 38.37‰ to 17.17‰ (between 1960-2020) and the Crude Mortality rate has dropped from 10.47‰ to 5.67‰ (between 1960-2020).
Improved healthcare and advances in medicine have increased life expectancy. At the core of this ordeal lies the fact that longevity imposes on retirees the fear of outliving their income: Running out of money during their retirement years, especially in a country like Lebanon where there is no state pension scheme that provides a safety net for the elderly.
In fact, our life expectancy increases with age. If a person attains 65 years, his life expectancy becomes 83.09 i.e., 6.87 more years. Today, the Lebanese National Social Security Fund, NSSF, provides an End-of-Service compensation which can be “used” before the retirement age and mainly for anything but retirement which defies the purpose of its presence.
A light at the end of the tunnel
The solution is to replace the current Lebanese “Temporary” End-of-Service compensation with a state pension scheme based on capitalization from employees’ contributions. In addition, the retirement age must be extended to 67 akin to Germany and France (you can opt to retire at 62 in France). Most importantly, the solution design must avoid the Pay-As-You-Go scheme which is doomed to bankruptcy due to inflation and population ageing.
In order to achieve a sustainable pension scheme the creation of a Three-Pillar Pension System should be adopted. This entails the following:
The design of a new National Social Security Pension that serves as a safety net for retirees that is funded through the employee’s earnings
An obligatory employer-and-employee pension scheme funded by at least 50% from the employer
A supplementary (optional) individual pension scheme that the employee can buy
The above pillars should enjoy income tax relief at the highest marginal rate. In addition, the self-employed should benefit from tax exemption on the supplementary pension scheme as well (up to a certain limit).
Let’s take a look at Germany, Switzerland, and France!
All of these European countries have successfully implemented the Three-Pillar pension system that entails: a mandatory state pension, company or occupational pensions, as well as private pensions. It is critical to highlight that the Three-Pillar System is robust to ageing populations. The population ages 65 and above of the afore mentioned countries (% of total population) is 21.98%, 21.09%, and 19.39% respectively. Whereas Lebanon’s rate is 7.89%. This proves that Lebanon has a good chance of a successful implementation of this solution.
The newly elected young parliament members should address the old-age security bill, which was referred to the House of Representatives in 2004 and shelved ever since. Implementing this bill is crucial as it acts as a part of the reform that Lebanon should implement to recover from its financial crisis.
Did you know?
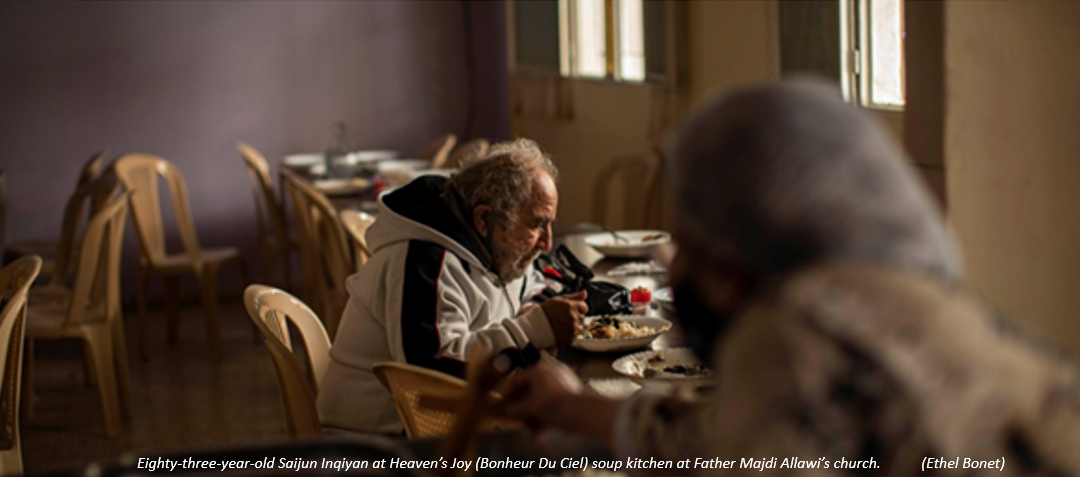
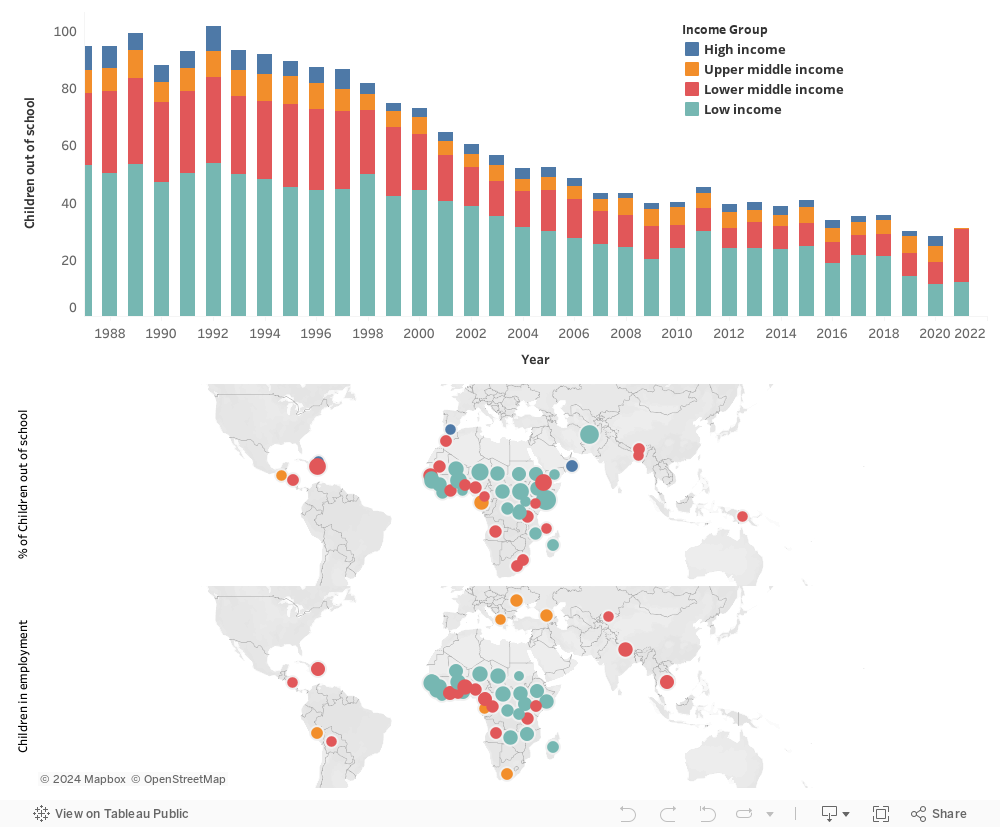
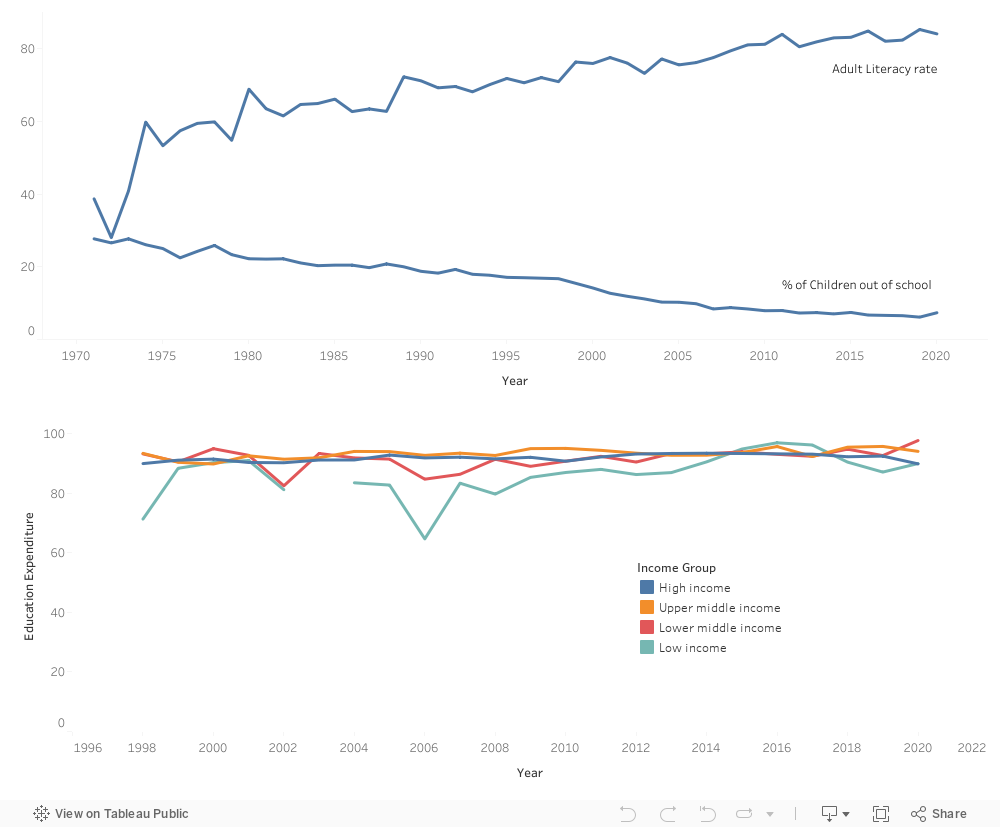
Even though the average percentage of Children out of school is declining over the years, studies showed that almost 20% of children in low-income countries and 10% in lower middle-income countries are still out of primary school in 2021.
What are these children doing?
The highest % of children in employment is found in the low-income countries, followed by the lower middle-income countries where the highest % of children out of school coexists.
This shows that these countries cannot afford the education of their children and thus shift them to work instead in order to support their families’ living expenses.
Who should we blame?
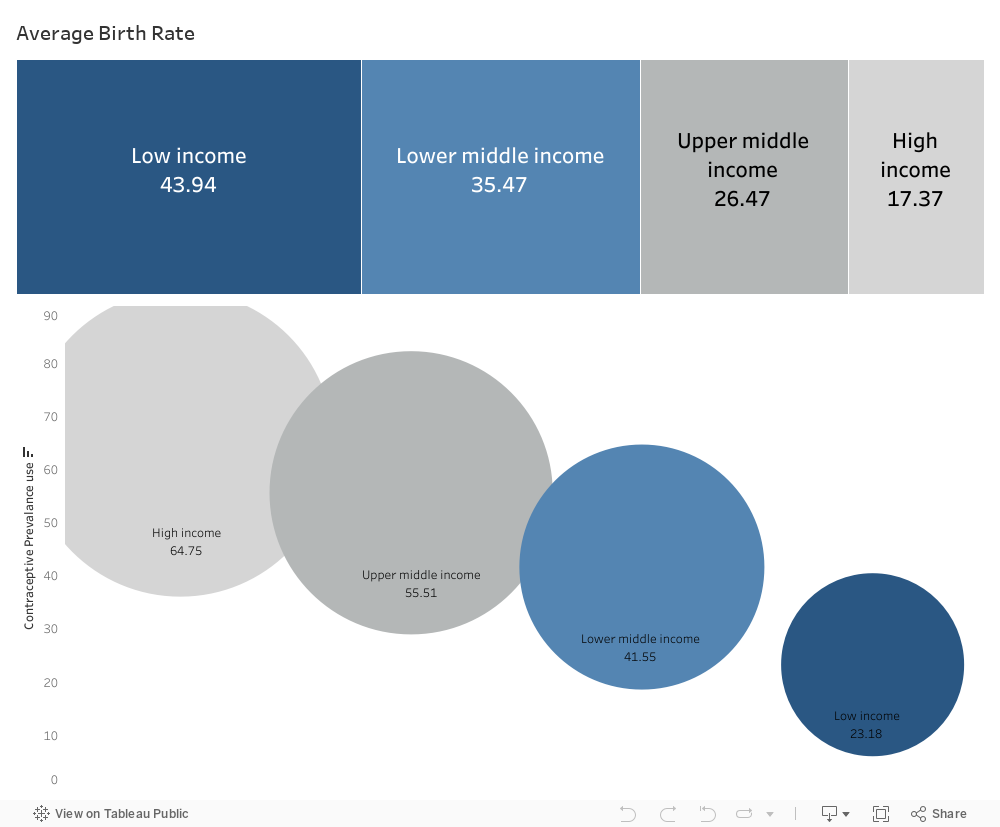
While these countries have the lowest income, they score the highest birth rates compared to other countries as shown below.
The low-income countries have a 44% birth rate reflected by their ignorance on the importance of birth control and contraceptive prevalence with only 23%.
Is 23% enough? No.
Children have the right to be educated, and a big responsibility falls on the parents who give birth to children and force them to work, knowing that they cannot afford their education.
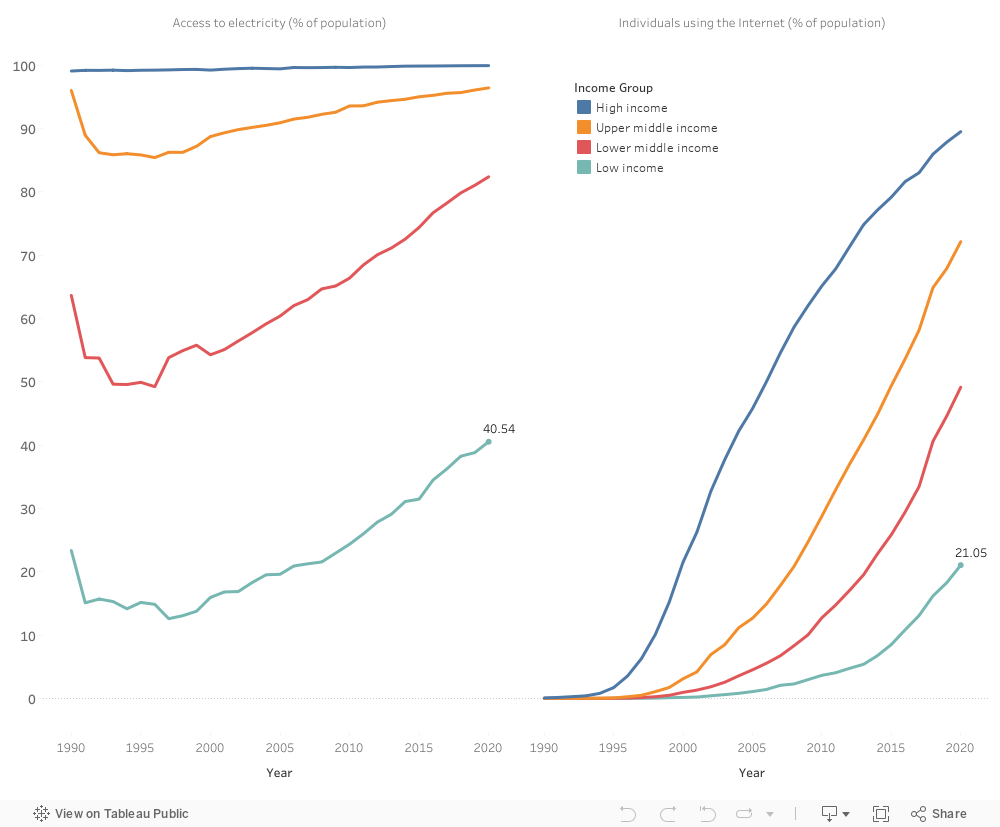
The access to electricity and internet usage across the years has been increasing in all the countries including the low-income ones.
However, it is important to highlight that with all this increase, only 40% of the population in low-income countries have access to electricity and only 21% of them use the internet in 2020.
This evolution has pushed the adult literacy rate across the years to increase.
The more the adults have literacy and can surf through internet facilities, the more they understand the importance of children education and therefore decreasing the % of children out of school.
The main reason behind the decrease in % of children out of school through years is the increase in education expenditures in primary public institutions, along with the increase in access to electricity and internet usage which facilitates the education feasibility for the children and the adults literacy in these countries.
Knowing that the low-income countries cannot afford the education of their children, while their birth rate is increasing, the Department of Economic and Social Affairs in the United Nations should ensure inclusive and equitable quality education and promote lifelong learning opportunities for all #SDG4 #SDG4.1 by supporting these countries through funding the tuition fees of their children along with educating the parents on the importance of contraceptive prevalence and maybe set regulations in collaboration with the governments to limit the birth rate allowed in the low income countries.
On the morning of August 29, 2022 , the Arab world woke up to the tragic death news of the Lebanese singer Georges El Rassi and his companion.
This news refocused attention on a perennial problem in Lebanon that is rarely prioritized — the high rate of death and injury on the country’s roads, accordingly YASA, a local traffic safety NGO, called on the Ministry of Public Works and Transport to install plastic barriers to cushion impacts against concrete medians. The absence of such safety devices played “a major role” in the two deaths, the NGO claimed.
Unfortunately YASA also pointed out that the same concrete barrier killed three people in a 2016 collision, and nothing was done to install warning signs or protective barriers.
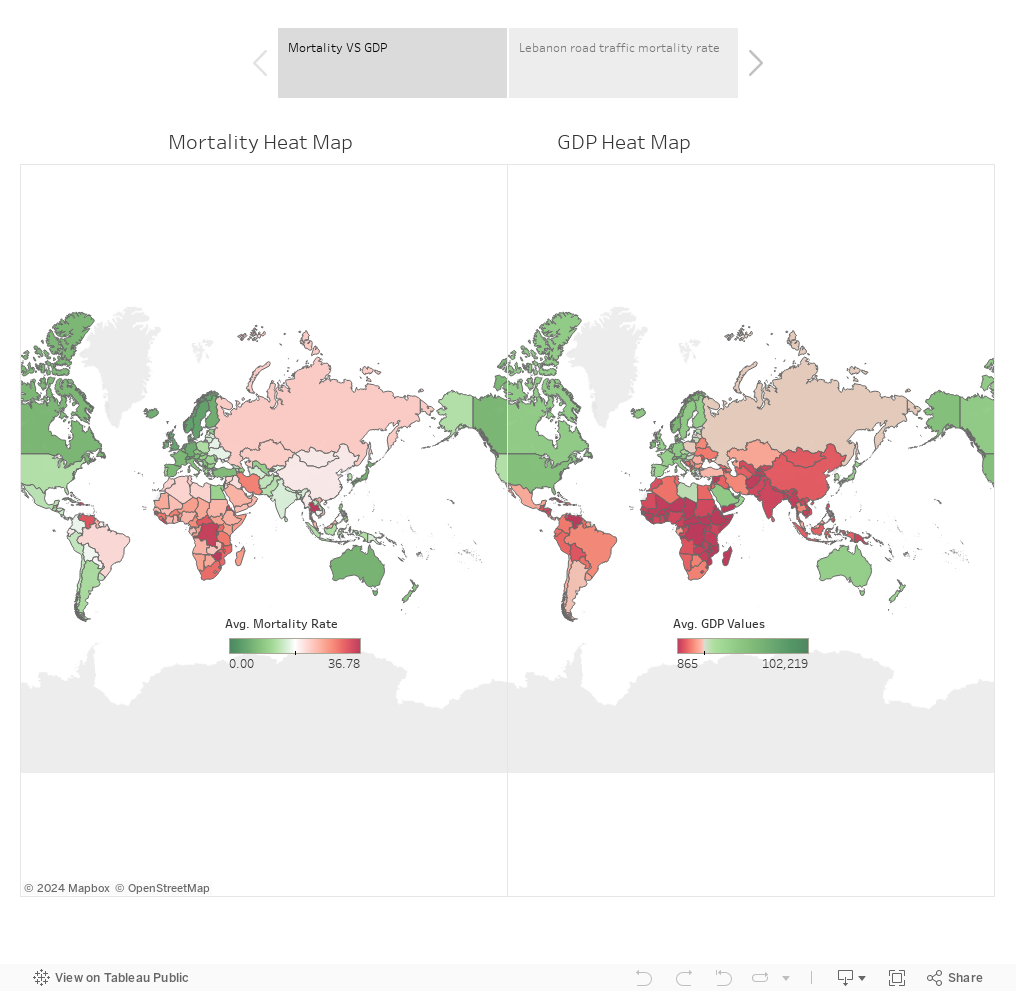
After analyzing the World Development Indicators, under the SDG goal #9, it turns out that the mortality rates due to traffic injuries are higher in developing countries than developed countries. Further analysis showed a negative correlation between GDP per capita and mortality rates due to traffic injuries.
On the bright side a developing country like Lebanon have experienced a major decrease in road traffic deaths after applying strict traffic low enforcement during the period between 2007 and 2011 where Dr. Ziad Baroud served as Minister of Interior and Municipalities. The first crackdown Baroud orchestrated was on traffic disobedience. Working closely with NGOs that promote road safety and injury prevention, notably the YASA and Kun Hadi organizations, one of Baroud’s first undertakings as minister was to impose traffic laws, including seatbelt enforcement and speed limits compliance. Resultantly, under his mandate, in the first year alone, the Ministry of Interior raised the number of traffic officers from 593 to 1,800 and 87% of motorists started complying with traffic lights.
Greta Thunberg is a well-known Swedish climate change activist. She held a sign saying “School Strike for Climate”, to pressure the government to meet carbon emissions targets.Her small campaign had a global effect, inspiring thousands of young people across the world to organise their own strikes. In 2019, Thunberg sailed across the Atlantic on a yacht to attend a UN climate conference in New York.
Delivering what is probably her most famous speech, she angrily told world leaders they were not doing enough. “You all come to us young people for hope. How dare you? You have stolen my dreams and my childhood with your empty words,” she said. Greta’s speech inspired me to harness the power of data to achieve the sustain development goal number 12 which is ensuring sustainable consumption and production patterns.
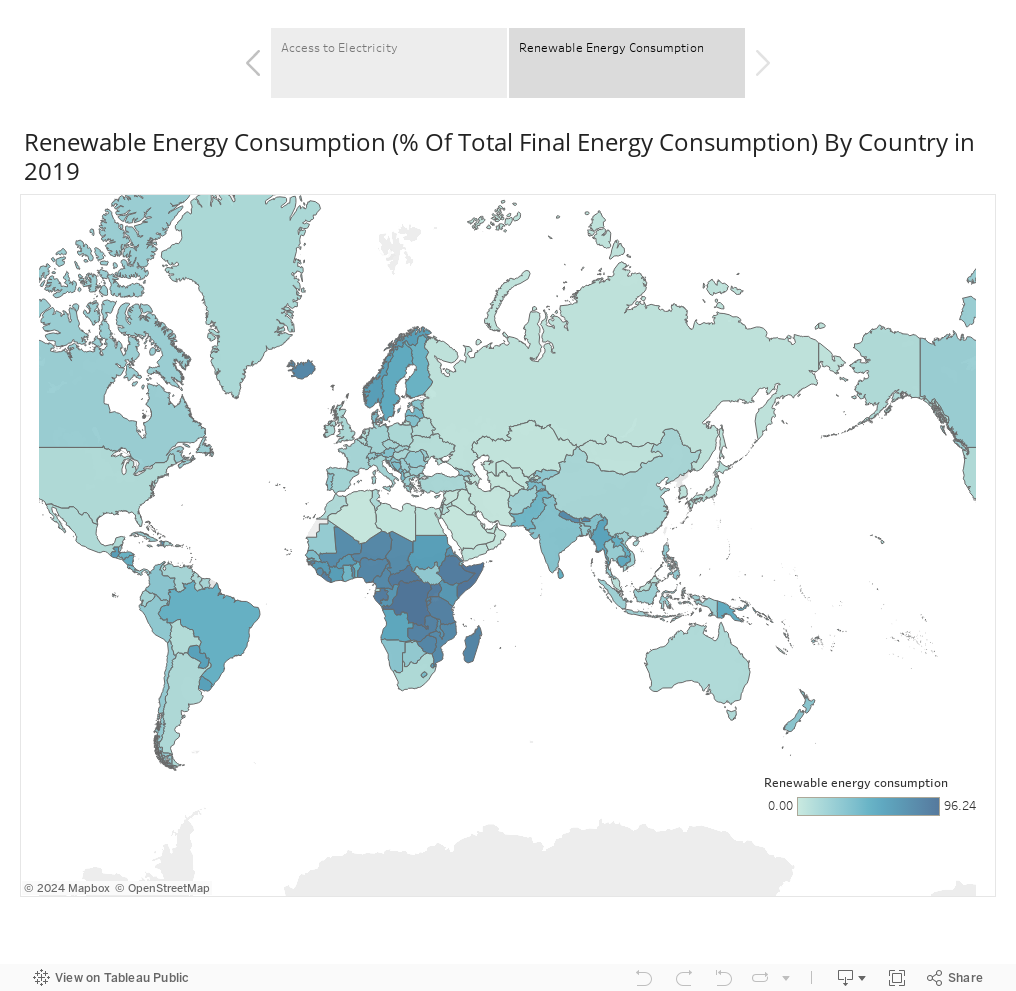
After analyzing the data from world development indicators, countries having high access to electricty depends more on non- renewable resources, that have a high footprint on global climate change. On the other hand, according to the map, countries that have high access to electricity showed that they don’t depend on renewable energy resources for electric consumption. That’s why United Nations Framework Convention on Climate Change should urge countries with high access to electricity to depend more on renewable energy resources for electric consumption.
Also, the United Nations Framework Convention on Climate Change should address the problem of high dependency on non- renewable energy resources in the next international climate change summit that is held in UN headquarters in New York. In a nutshel, countries should consider producing and consuming electricty from renwable energy resources to combat climate change.