Welcome Message
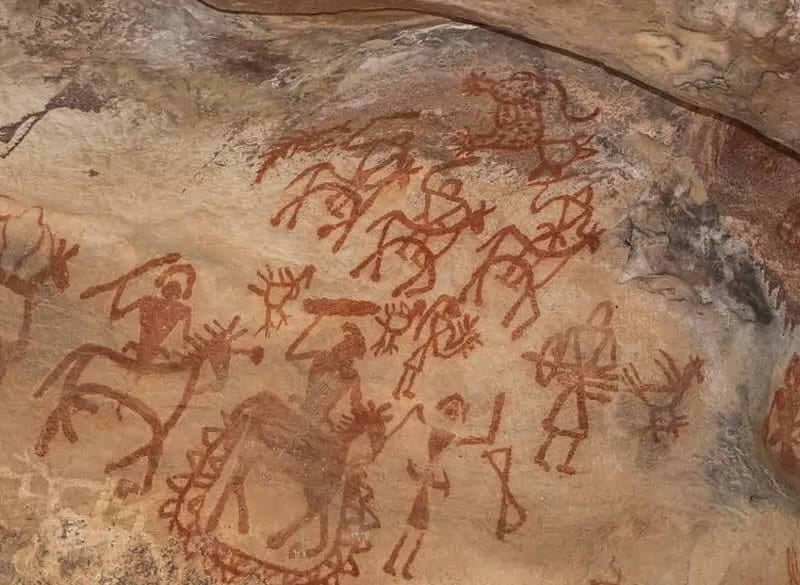
Visualization is one of the earliest forms of communication that appeared thousands of years ago. It enabled us to tell stories that were preserved from one generation to the next through for example cave painting (image credit).
Data visualization is core to the analytics process. As John Tukey highlighted: “this is my favorite part about analytics: Taking boring flat data and bringing it to life through visualization.”
MSBA students at OSB of AUB are continuously producing great visuals that change our perception of various matters in life.
This blog is meant to aggregate and share a selection of visualizations and dashboards that OSB students create in the MSBA 325 course on data visualization and communication.
Enjoy browsing the site!