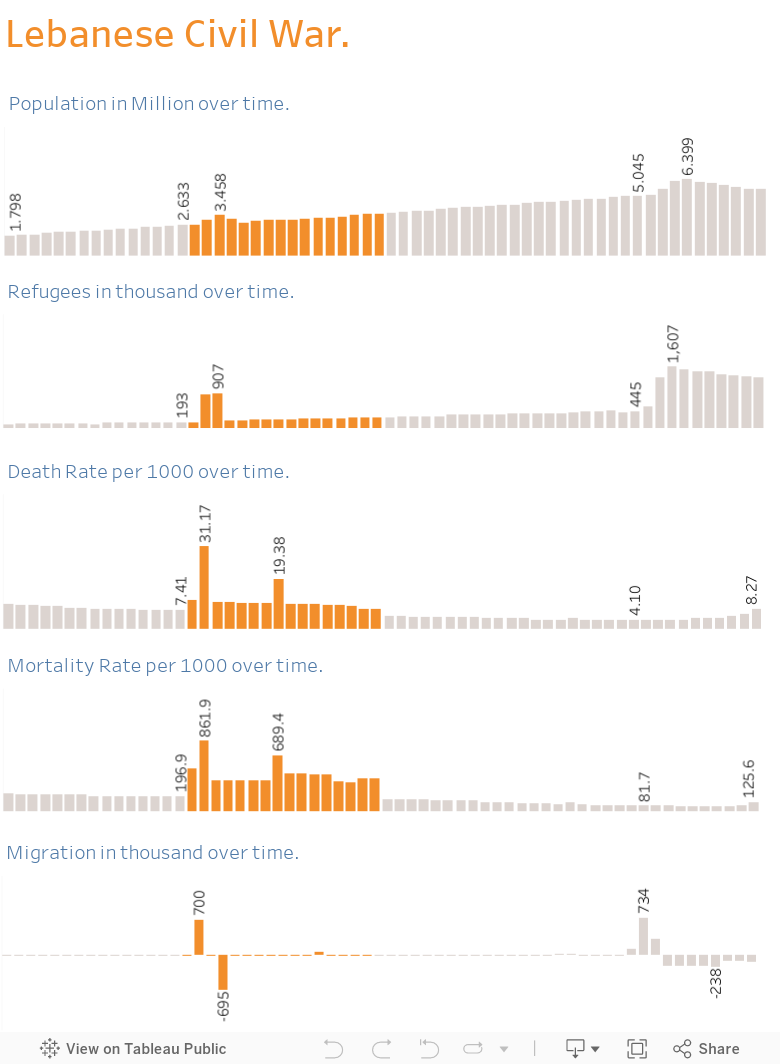
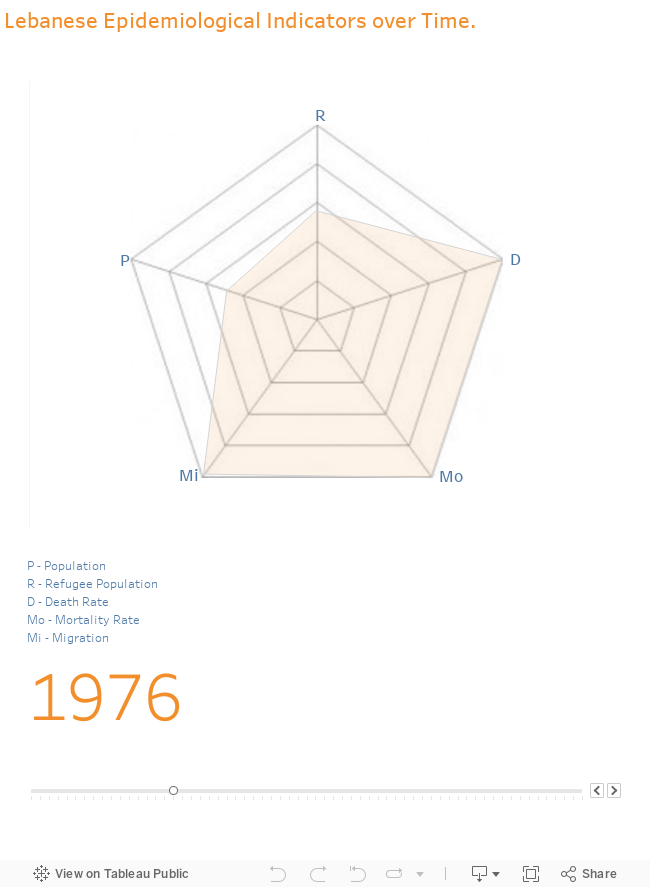
April 13, 1975, an unforgettable date for many, the Lebanese civil war commenced, enduring for a period of 15 years, and causing widespread dispersion and fragmentation in our cherished homeland of Lebanon. This war had led to increased mortality rates, displacement of populations, migration and weakened public health infrastructure, resulting in adverse health outcomes.
The Lebanese civil war in 1975 Clearly showed a huge increase in population (400,000 yearly), mortalityrate (800 per 1000 person), death rate (4 times more), immigration (700,000) and refugees (900,000). The evident impact of the war itself, combined with the strain on the healthcare system due to shortages in supplies, security concerns, and a loss of skilled personnel due to immigration, is thus apparent.
However, Lebanese people always tend to solve the problems and adapt to any situation in a positive way. The Lebanese accord of 1990 sought to create a structure for political transformation, effectively concluding the war by means of the Taif agreement. Following the cessation of hostilities, the mortality and death rates returned to their previous stable levels.
In the light of our recent past, Lebanon has been confronted with a significant economic crisis, the COVID-19 pandemic, alongside the notorious Beirut Blast and an influx of Syrian refugees in the recent years. As a result, these factors have had an impact on diverse aspects of the Lebanese population’s epidemiological indicators and crucial public health outcomes. The aforementioned factors have caused a disturbance to healthcare systems, infrastructure, and the availability of healthcare services, resulting in a significant strain on the Lebanese healthcare system.
The Syrian war in 2012 clearly showed a huge increase in population (1,200,000 in 3 years), immigration (733,000 in one year) and refugees (1,200,000 in three years) without any considerable effect on mortality rate and death rate (this may be explained by the nature of the Syrian community, being a young society).
Nowadays, Lebanese people mustbelieve in their potential to pass the crisis and get up again to build what was destroyed.
I tackled a very sensitive subject to my heart. As an aunt to 2 nieces and nephews, and someone who has worked as well as volunteered with children, their age group will always be very close to my heart.
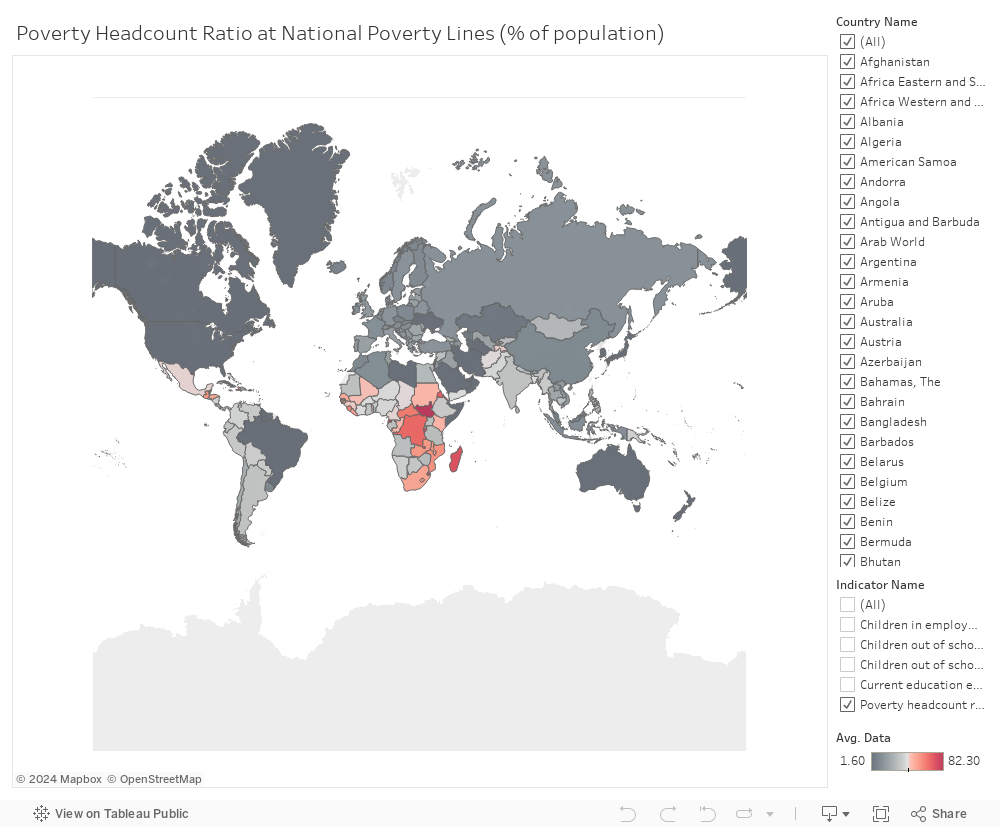
Thus, the indicator I will be focusing on today is children out of school percentage worldwide.
In a time where all children should have excess to education, Africa is the continent with the highest children out of school percentage.It can be shown clearly in the data visualization as it is the continent with highest red coloration.
When we think about correlated factors, we see that the % of poverty by headcount is highest in Africa.
Also, the % of Child employment (ages 7-14) seem to be the highest in the same continent.
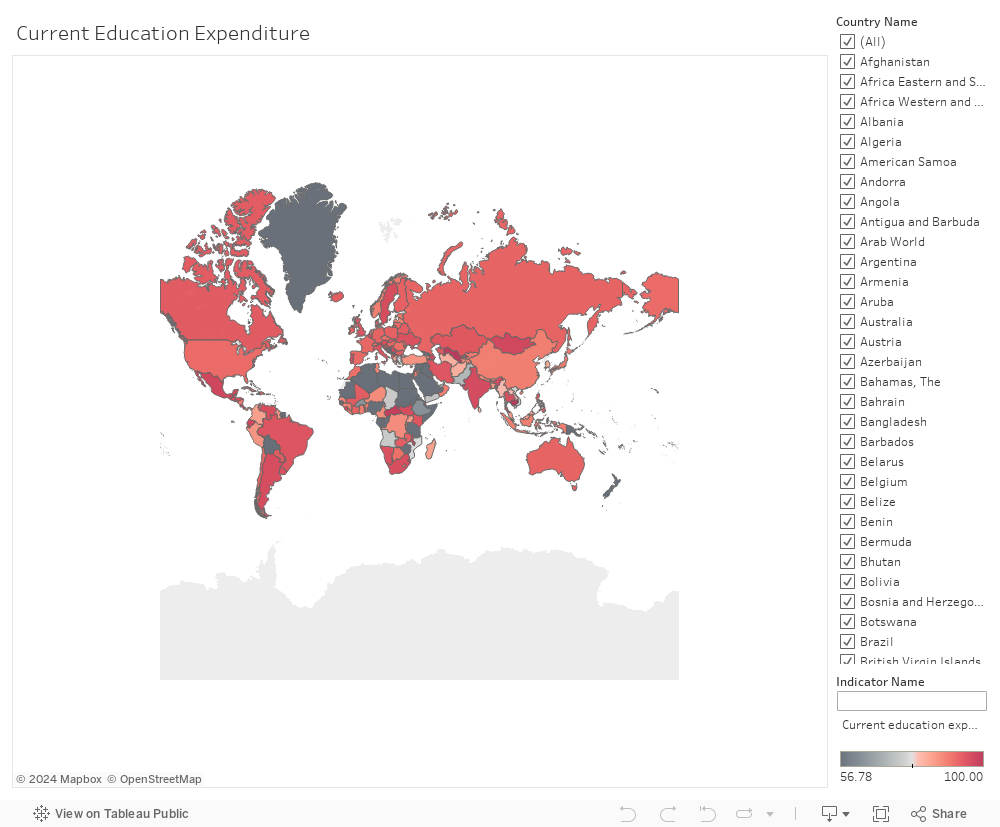
While regarding current expenditure on education, Africa falls the 2nd lowest in this category.
Governments should give priority to ensuring that education is freely available and easily accessible to every child, while managing child employment laws and expenditure on education.
Governments should work together with NGOs, international organizations, and sponsors to strengthen funds for education. This includes offering financial aid for school fees and teacher support. Policy changes should also be altered to prioritize education expenditure to improve infrastructure, resources, and mainly, student funding.
Additionally, governments should address child and adolescent labor by enforcing anti-child labor laws, implementing social protection measures for at-risk families, and ensuring secure school environments. Not only should they enforce laws, but they should focus on ensuring compliance with anti-child labor laws. This includes having multiple labor inspectors on child labor issues, conducting regular inspections in sectors identified as high-risk for child labor, and taking appropriate enforcement actions against those found in violation of the laws.
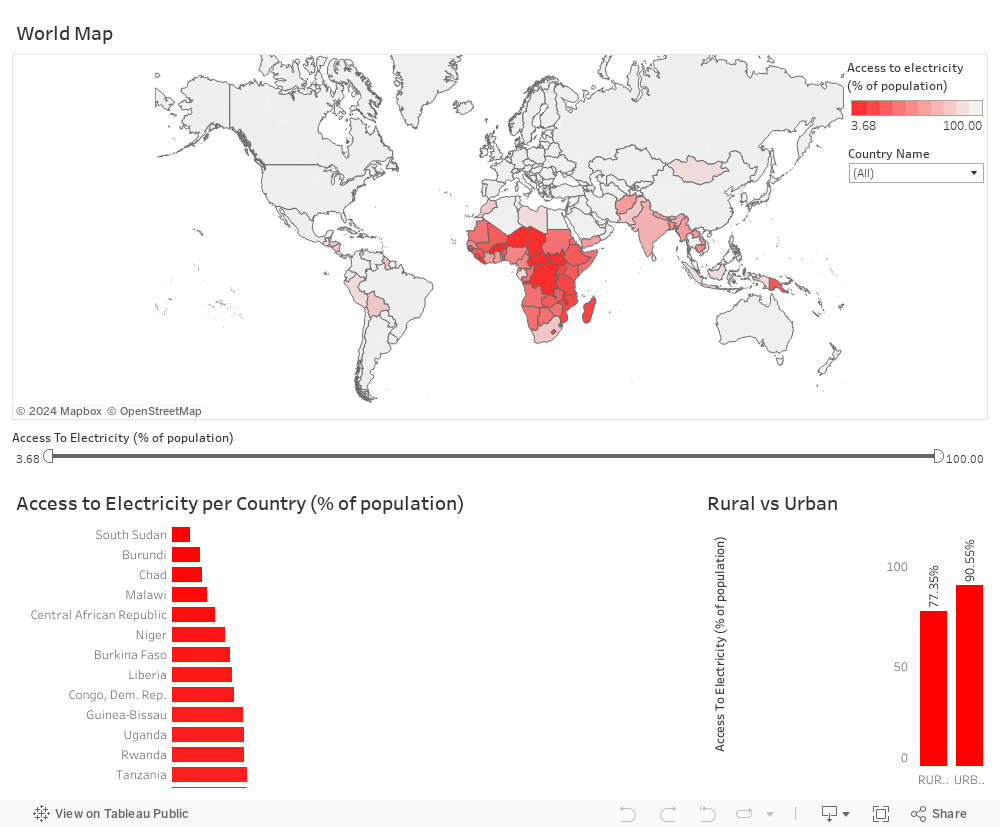
In a world map coded in vibrant colors, a stark truth emerges—Africa remains shrouded in darkness, with the least access to electricity. This tale unfolds, revealing a problem that denies millions the fundamental right to light and power. Let us begin on a journey to shed light on this topic, investigate its complexities, and present alternative solutions for achieving transformational change. 581 million African do not have access to electricity.
When it comes to energy availability, Africa, a continent rich in resources and diversity, has a significant gap. Widespread power shortages and inadequate infrastructure plague its nations, leaving a significant portion of the population in the dark. This situation not only hampers progress and stifles economic growth but also deprives individuals of basic necessities and opportunities for a better life.
A glance at the bar chart depicting electricity access reveals a somber reality. Country after country in Africa lingers at the bottom of the chart, showcasing alarmingly low percentages. It paints a distressing picture of the challenges faced by the African people, hindering their ability to thrive and prosper.
Furthermore, the chart highlighting rural versus urban electricity access further accentuates the disparity. Rural areas suffer disproportionately, often lacking the necessary infrastructure required to bring power to remote communities. This divide deepens the social and economic gaps, perpetuating the cycle of poverty and limiting opportunities for advancement.
Recognizing the urgency of the problem, governments, international organizations, and corporate companies have joined together to find a solution. The objective is to use Africa’s rich renewable energy resources, such as solar, wind, and hydroelectric power, to its advantage.
A comprehensive approach entails investing in renewable energy infrastructure, implementing decentralized energy systems, and fostering partnerships. By tapping into renewable sources, Africa can establish a sustainable and resilient power grid. Solar panels can light up homes, wind turbines can generate electricity, and hydroelectric installations can power regions.
These activities are complemented by the creation of microgrids and minigrids that are customized to the specific needs of rural areas empowering local populations through training and education enables them to manage and maintain these systems independently. This bottom-up approach ensures the sustainability and longevity of the solution.
To overcome financial barriers, innovative financing mechanisms, such as public-private partnerships and green bonds, can be employed. Additionally, policy reforms and streamlined regulations can incentivize investments and facilitate the integration of renewable energy technologies into the existing grid infrastructure.
Pioneering projects across Africa have already demonstrated the immense potential of renewable energy. From the vast solar farms of Morocco to the innovative mini-grids in rural Kenya, success stories abound. Communities once enveloped in darkness now bask in the glow of reliable electricity, empowering residents and propelling local economies forward.
The positive impacts of electrification are far-reaching. Access to electricity enhances healthcare services, enabling the operation of medical equipment, refrigeration for vaccines and medicines, and improved lighting in hospitals and clinics. It also catalyzes educational opportunities by providing adequate lighting for schools, facilitating e-learning programs, and enabling students to study beyond daylight hours.
The path to deliver light and power to Africa is difficult, but not impossible. Governments, international organizations, and the corporate sector must maintain their commitment and partnership. Policy reforms, financial investments, and technology transfer should be prioritized to drive progress.
To accelerate change, global partnerships must be forged to support Africa’s electrification endeavors. Technical expertise, financial help, and capacity-building programs can be provided by developed countries and international organizations. We can collectively pave the way to a brighter future for Africa by sharing knowledge, resources, and expertise—a future in which every individual, regardless of geography, has access to the electricity.
As we conclude our journey, let us remember that by addressing Africa’s electricity access challenge, we unlock a world of possibilities. From improved healthcare and education to expanded economic opportunities, electricity empowers communities and illuminates the path toward progress. Together, let us work towards an Africa that shines brightly, embracing the promise of an electrified future. With concerted efforts, we can ensure that no one is left in the dark and that every corner of Africa thrives under the power of light.
The Power of GDP per Capita Growth in Driving Sustainable Development
In the pursuit of sustainable development goals, economic growth and development play a pivotal role. However, the progress is not uniform across regions, with many facing economic challenges and limited strides. In this blog post, we delve into the significance of GDP per capita growth as a catalyst for sustainable development, as revealed through insightful visualizations.
The world grapples with economic disparities, where some countries experience robust GDP per capita growth while others face stagnation and limited development. The evidence is clear, as symbolized in a global map showcasing GDP per capita growth rates. The varying shades signify the economic challenges that different regions encounter.
In the face of these challenges, a potential solution emerges—learning from countries with remarkable GDP per capita growth rates. By understanding their strategies and policies, we can pave the way for sustainable development. These success stories hold valuable insights for fostering economic growth in other regions.
One visualization that captures our attention is a bar chart displaying the top 5 countries with the highest GDP per capita growth. These nations have achieved remarkable progress, outshining others in economic advancements. Through vibrant bars, we witness their success stories, offering inspiration and valuable lessons.
Success stories of high-growth economies validate the impact of their strategies. These countries have effectively implemented policies that fostered economic growth while advancing sustainable development goals. Data and evidence underline the positive outcomes of their approaches, further affirming their validity.
The visualizations yield key findings with actionable recommendations. It becomes evident that sustainable economic development is crucial for achieving sustainable development goals. Policymakers, organizations, and individuals are encouraged to embrace strategies aligned with the success stories uncovered, fostering sustainable economic growth.
In conclusion, economic growth serves as a cornerstone for building a sustainable future. Leveraging the power of GDP per capita growth, when complemented by strategic policies, can drive sustainable development. Together, we can create a more equitable and prosperous world for all.
Transforming Insights into Action,Armed with newfound understanding, let us embark on a collective journey to transform insights into transformative actions. By championing sustainable economic development, we have the potential to effect lasting change, empowering regions to embrace growth and development in harmony with sustainable principles.
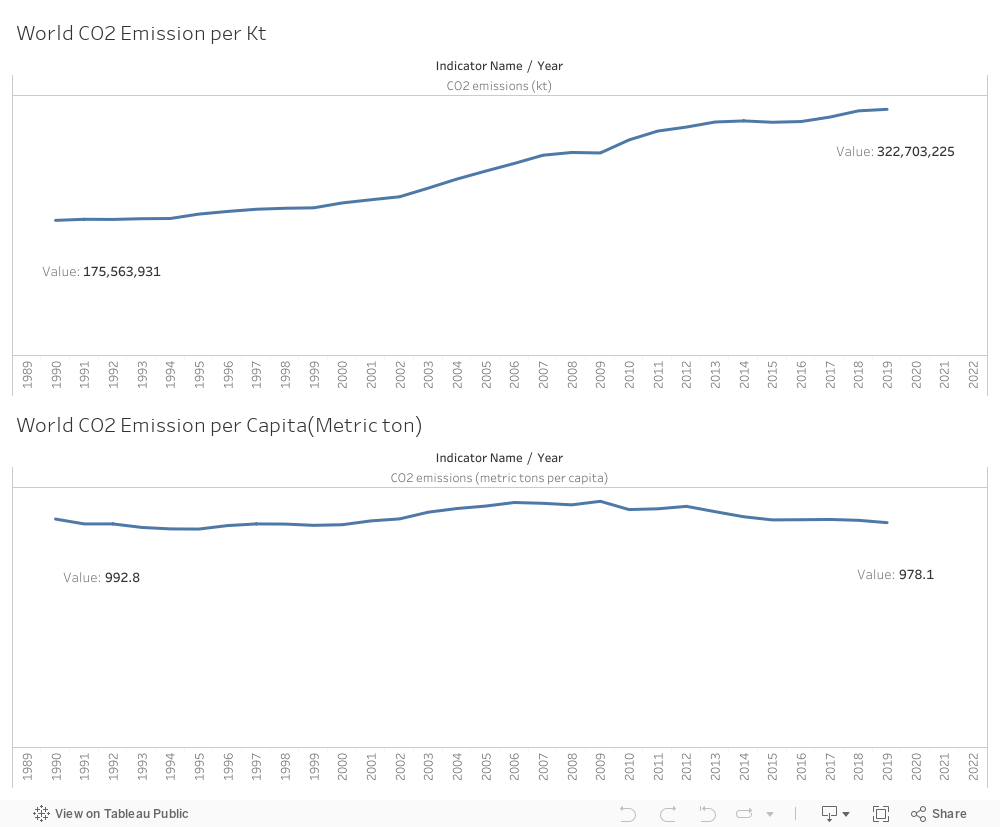
Carbon dioxide (CO2) emission status is a critical issue that has been around for many years. It is crucial for humans to reduce CO2 emissions as it is one of the most contributing factors for global warming.
As seen in the graph below, the CO2 total emissions has increased significantly throughout the years, which is entirely alarming and calls for us to take immediate actions now to stop this increase.
Indeed, there is a huge increase in CO2 emissions; however, the human population has also increased a lot from 1990 until 2022, which means we should also check the CO2 emission per capita.
The below graph shows that the total CO2 emission per capita has decreased slightly from 1990 till 2019 in metric ton. This is due to the usage of more green energy overall.
Now, it is interesting for us to check what countries are contributing the most to this, in order for these issues to be tackled at country level.
The below bar chart shows the highest 10 countries in terms of CO2 emission per capita: the leading country for CO2 emission is Qatar, and the top 3 countries are Arab gulf countries. It is quit interesting to see why Qatar is leading this metric and why. It could be that Qatar has a bad energy management system and does not rely on clean energy.
It is well known that Qatar is one of the leading countries when it comes to producing oil and gas. Thus, it might be directly affected by that.
The Pie chart below shows that 40.96% of Qatar CO2 emission comes from gaseous activities, and 26.36% comes from electricity usage. This shows the 2 major contributors for this high CO2 emission per capita.
That presents an important question: what types of energy does Qatar use in order to provide electricity and services for its population?
Qatar depends 100% on gas, oil and coal to provide energy and electricity. This is a major finding because it means that providing alternative energy sources can tackle this problem and reduce the CO2 emission. The figures below show how much Qatar depends on oil and that Qatar uses 0% of clean energy sources.
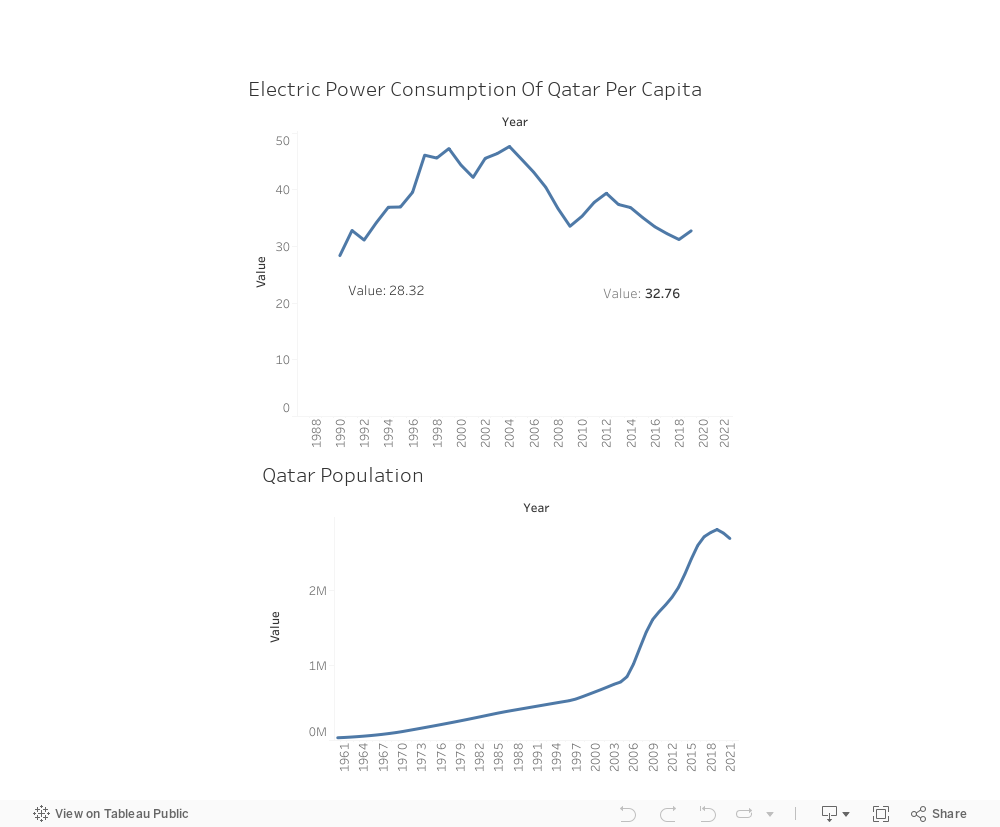
What makes it more interesting is that we can see that the total energy consumption had increased in Qatar since the late 90s on a steady trend; below line shows the electric power consumption in Qatar through the years.
Now, it is also clear that even though the electric power consumption has increased a lot, it has dropped from its peak while still maintaining a higher value than the first record of 28.32 in 1990 with a value of 32.76 in 2019. This is mainly impacted by the growing population in Qatar as many people have traveled to Qatar in order to find better opportunities since the 90s. This is also clearly demonstrated in the population line visualization below.
In short, the problem of Qatar’s high CO2 emission is mainly attributed to the zero usage of clean energy for its different activities. For that, a couple of actions are recommended.
Using green energy for generating electricity
Introducing the solar system as an alternative
Implementing environmental regulations and policies to enforce emission standards and promote sustainable practices across industries
Investing in research and development in order to find suitable ways to reduce the emission for gaseous activities
Using of filters while producing gas and oil
Raising the population’s awareness of the importance of adapting sustainable lifestyles to reduce CO2 emissions
Abiding with carbon target zero ambitions in order to fight global warming