For years, Lebanon appeared to be defying gravity. As we rebuilt from the civil war, our external debt climbed steadily, reaching over $70 billion. But look closely at the blue line in the chart below.
Our reserves (the blue line) seemed to keep pace with our debt (the red line). This created a sense of security; for every dollar we owed, we seemed to have a dollar in the vault. But this correlation was an illusion. The reserves weren’t built on productivity; they were built on the very debt we were accumulating. We were borrowing to pay the interest on what we had already borrowed.
The Turning Point (2018–2019)
The story takes a dark turn in 2018. Notice the divergence in the first chart: Debt continued its upward march, hitting nearly $80 billion, while reserves began a steep decline. The “leakage” had begun. Money was flowing out faster than it could come in.
But where was the money coming from, and why did it stop?
The Tap Runs Dry
The bar chart below reveals the culprits behind the crash. For nearly a decade, commercial banks (the green bars) were the engines of this debt machine, pouring billions into the system.
Then came the shock. In 2019, the green bars didn’t just shrink—they flipped. Commercial bank lending turned negative, representing a massive contraction and capital flight. At the same time, the bond market (orange bars), which had been a steady source of cash, flatlined.
Conclusion
The data tells a tragic 3-minute story: A decade of debt-fueled growth created a fragile bubble. When the banks pulled the plug in 2019, the illusion shattered, leaving a nation with $70 billion in debt and a reserve tank running on empty. As we look to the future, any recovery plan must start by acknowledging these red and green bars—the undeniable accounting of a system that consumed itself.
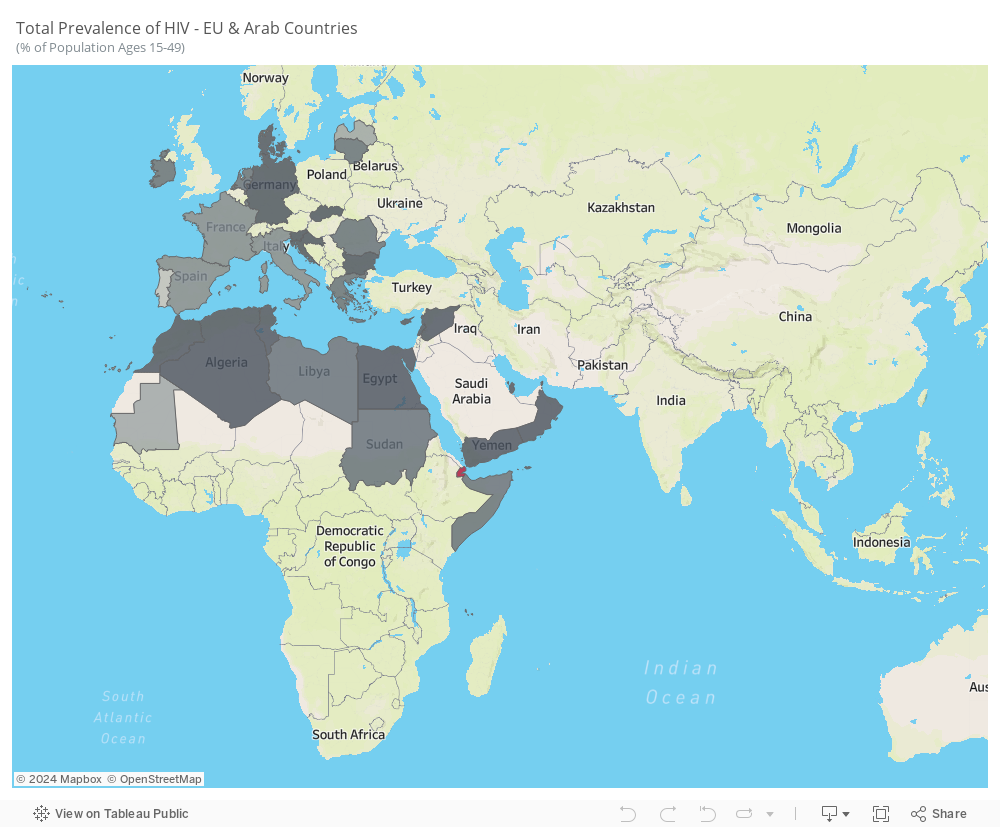
HIV persists as a noteworthy communicable disease in Europe and a substantial risk in the Arab world, posing a significant health challenge. This infection is associated with considerable healthcare costs for treatment and care, a noteworthy mortality rate, and a reduction in life expectancy. The virus specifically attacks the immune system, resulting in a persistent and severe illness with an extended incubation period before symptoms manifest.
The average prevalence from 2005 to 2021 reveals notable trends. While some Arab countries, like Saudi Arabia, UAE, and Iraq, do not consistently report HIV statistics, the available data highlights the prevalence of the disease in Arab countries situated in Africa. In contrast, European countries, particularly Portugal, Latvia, France, and Italy, exhibit higher prevalence rates.
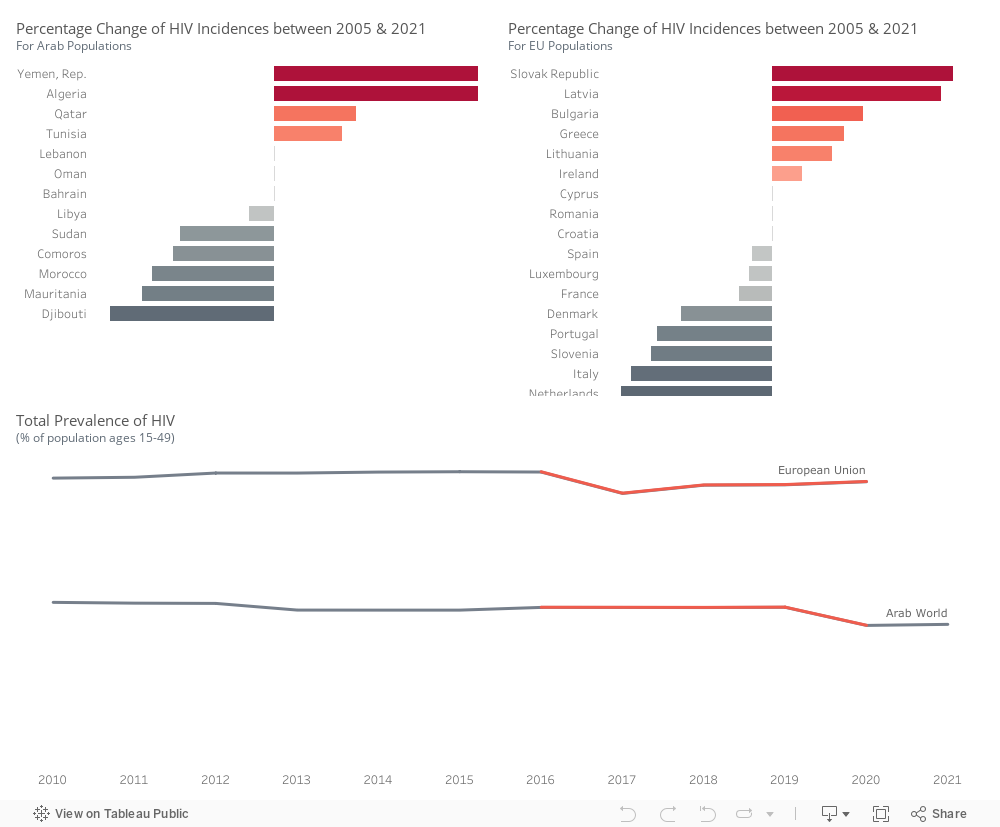
Within the Arab world, there is an upward trend in the percentage of HIV incidences in Yemen, Algeria, Qatar, and Tunisia. Conversely, Djibouti, Mauritania, Morocco, Comoros, Sudan, and Libya exhibit a decline in HIV incidence rates.
Within the Euro area, there is an increase in HIV incidences observed in Slovakia, Latvia, Bulgaria, Greece, Lithuania, and Ireland. However, a decrease is noted in the Netherlands, Italy, Slovenia, Portugal, Denmark, France, Luxembourg, Spain, and Croatia.
HIV prevalence is higher in European Union countries compared to Arab countries. There was an incline in Arab countries around 2020, while in the European Union, the trend experienced a decrease in 2017, followed by a slight upward movement.
We will be focusing on these countries in the following visuals.
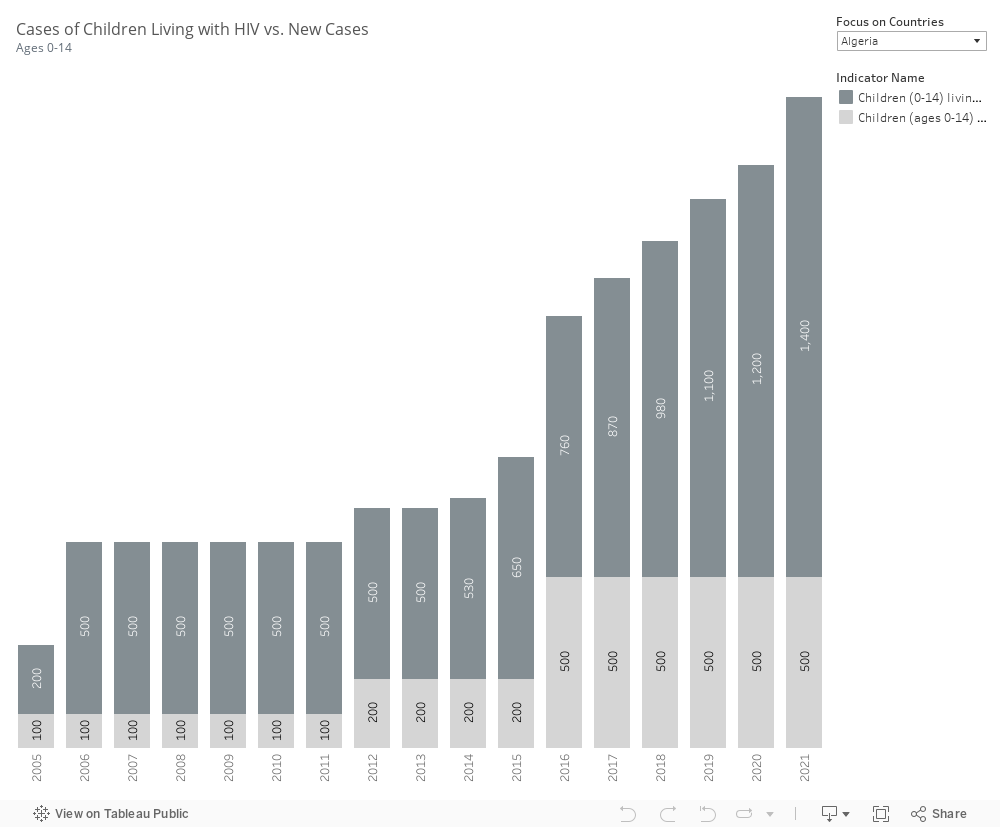
Most countries do not report parameters related to children living with HIV and newly infected children. However, the available data indicates that in Algeria and Morocco, both the number of children infected and the number of new cases are on the rise. In contrast, Djibouti has successfully decreased these numbers, as has Mauritania.
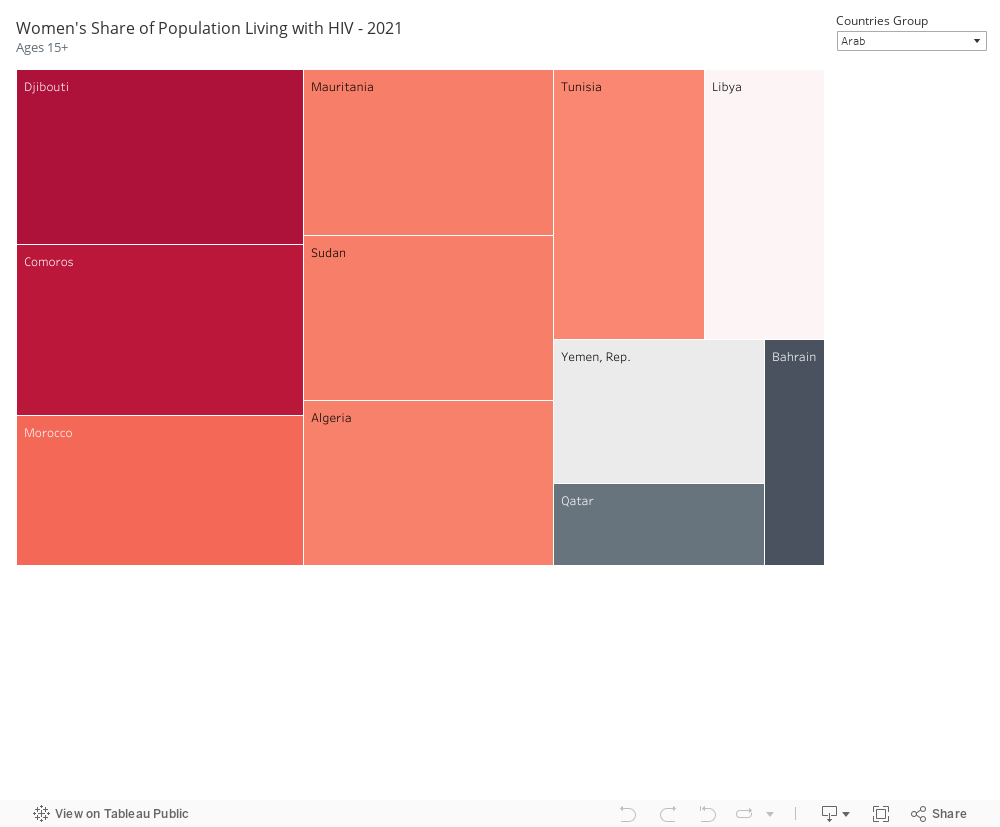
In our selected focus countries, notable instances of HIV infection among the female population are observed. Within Arab countries, Djibouti, Comoros, Mauritania, Sudan, Morocco, Algeria, and Tunisia exhibit a high prevalence. Similarly, in EU countries, France, Portugal, Latvia, Ireland, Luxembourg, and Italy show a high number of females infected with HIV.
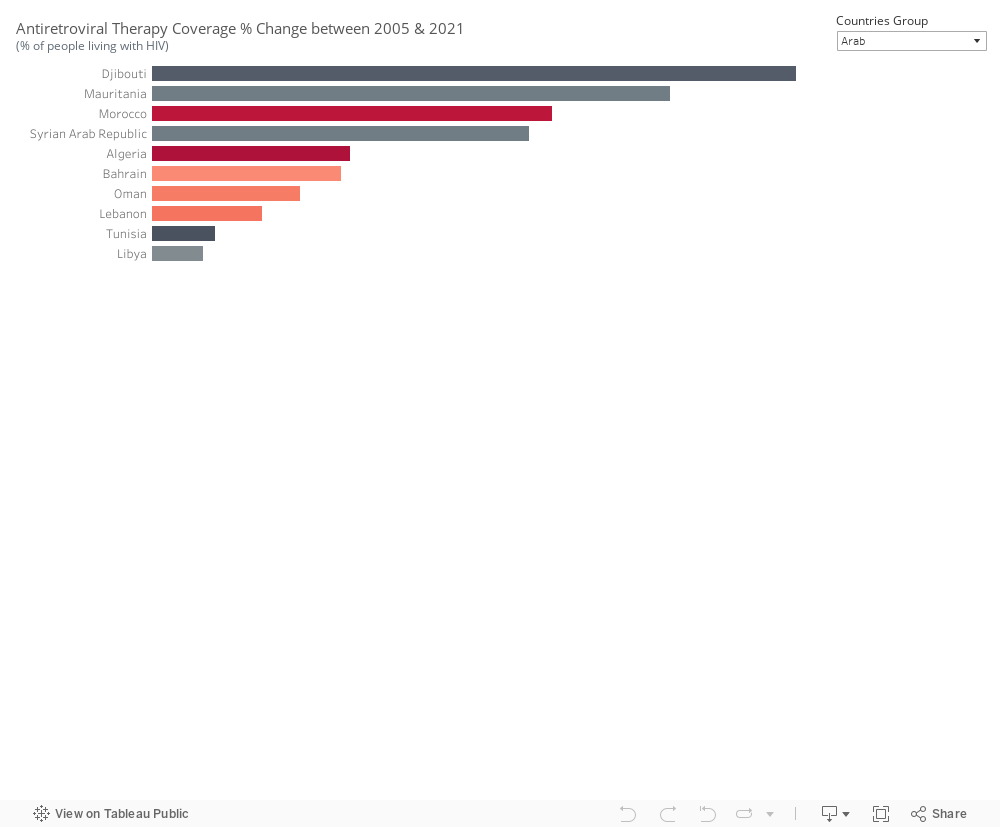
Antiretroviral therapy coverage has seen an increase since 2005 in Djibouti, Mauritania, and Morocco within the Arab world, as well as in Latvia and Bulgaria. The effectiveness of the treatment is reflected in the declining incidence cases observed. However, in Algeria, despite an increase in treatment coverage, the number of incidents continues to rise. A similar situation is noted in Slovenia, suggesting that the treatment alone may not be sufficient to curb the spread of HIV.
Information pertaining to condom use and protected sex is currently unavailable, emphasizing the need to gather this specific dataset.
In conclusion, Europe & the Arab World are far from meeting global HIV targets. Annual new HIV infections from AIDS-related illness are on the rise. While treatment can contribute to reducing the prevalence of HIV in a country, it is just one aspect of a comprehensive approach. Relying solely on treatment is inadequate. Nations should prioritize addressing other impactful factors, including:
Implementing prevention programs that effectively reach key populations in substantial numbers.
Making special efforts to enhance and extend HIV testing and treatment initiatives.
Increasing engagement with the younger demographic.
Enforcing effective policies such as mandatory testing for work or residence permits, mandatory testing for marriage, and criminalizing activities such as sex work and drug use or possession for personal use.
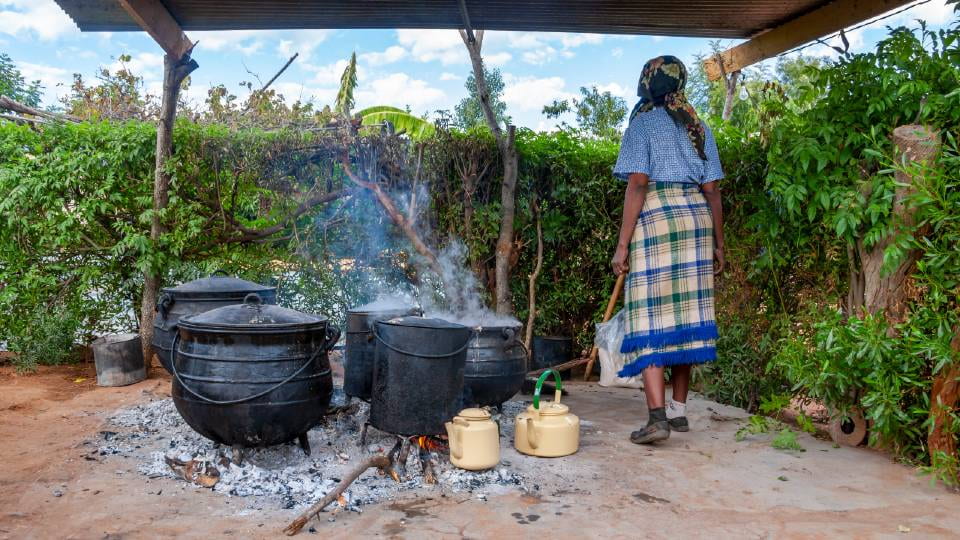
Nigeria, a vibrant and populous nation in West Africa, grapples with the critical issue of access to clean fuels and technologies for cooking. As an integral component of daily life, cooking methods profoundly impact the health, environment, and overall well-being of the Nigerian population. The dynamics of clean cooking solutions in Nigeria are closely intertwined with the threads of economic growth, underscoring the necessity for innovative approaches that not only tackle environmental challenges but also foster the nation’s economic robustness and promote inclusive development.
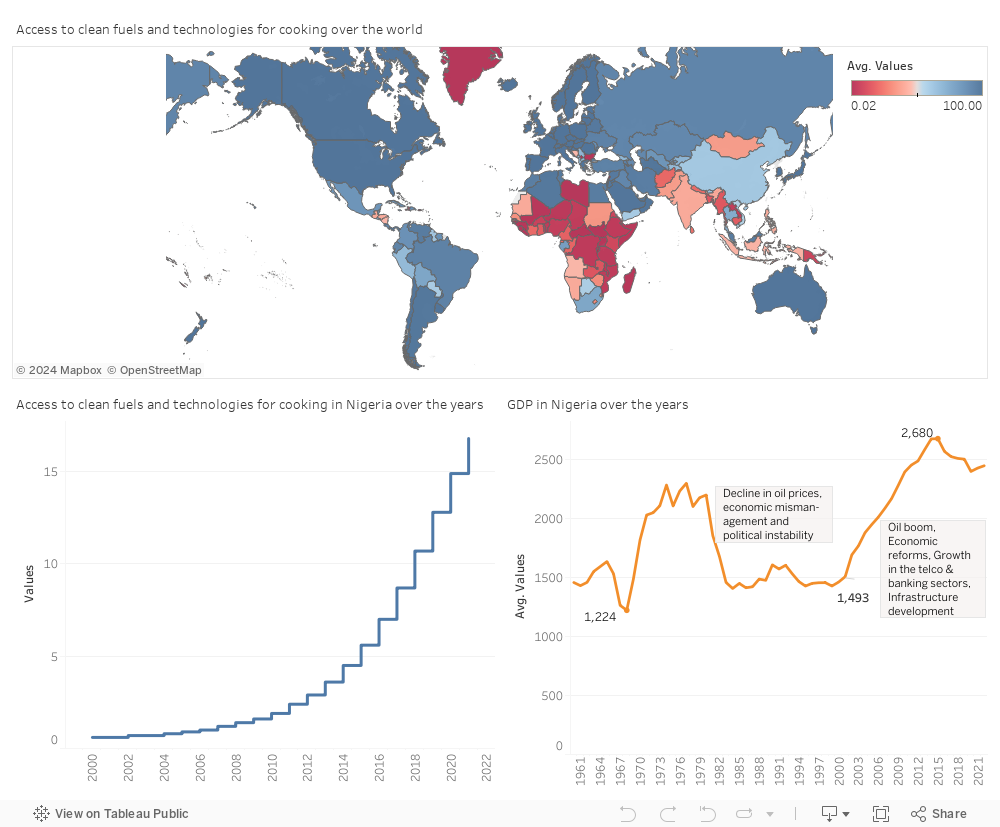
Based on the previously displayed map, it’s evident that the majority of African countries face limited or no access to clean fuels and technologies for cooking. To investigate this trend further, Nigeria has been selected as a focal point to assess whether there have been improvements in this indicator over the years.
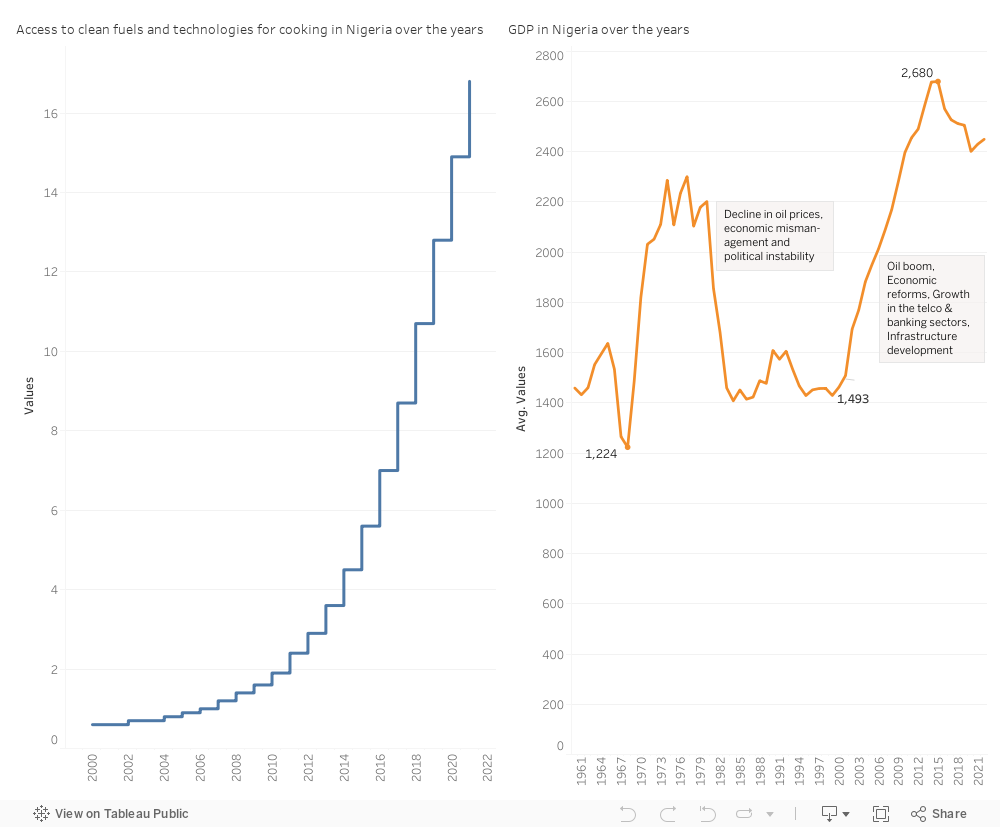
It is noteworthy that access to clean fuels and technologies for cooking in Nigeria has shown a positive trajectory, with discernible advancements noted since 2001. This gradual increase can be attributed to a combination of government initiatives, infrastructure development, international support, economic growth, awareness campaigns, technological advancements, and community engagement. Policies and subsidies, investments in energy infrastructure, collaborations with international organizations, and economic development have collectively contributed to making clean cooking fuels more affordable and accessible. Moreover, efforts to raise awareness about the health and environmental benefits of clean cooking, along with advancements in technology, have played crucial roles in promoting the adoption of clean cooking practices across the country.
The rise in Nigeria’s GDP alongside increased access to clean fuels and technologies for cooking is a symbiotic relationship with multiple interconnections. Economic growth, as reflected in the increasing GDP, contributes to improved affordability of clean cooking technologies, fostering a positive impact on household incomes. This economic development empowers the government to allocate resources to initiatives and subsidies that enhance accessibility to cleaner fuels. Moreover, higher GDP facilitates investments in energy infrastructure and research, fostering technological advancements that make clean cooking options more efficient. The overall improvement in public health, heightened environmental awareness, and strengthened international collaborations are additional outcomes of this dual progress. However, recognizing and addressing potential disparities in the inclusive distribution of these benefits remains crucial for a comprehensive understanding of the dynamic relationship between Nigeria’s economic growth and the adoption of clean cooking practices.
The efforts to increase access to clean fuels and technologies for cooking, along with economic growth, align with several United Nations Sustainable Development Goals (SDGs):
SDG 1 – No Poverty: Economic growth, when inclusive, can contribute to poverty reduction, and improved access to clean cooking technologies supports this goal by enhancing the living standards of vulnerable populations.
SDG 3 – Good Health and Well-being: Access to clean fuels and technologies for cooking directly impacts health outcomes by reducing indoor air pollution and related health issues.
SDG 7 – Affordable and Clean Energy: The goal of ensuring access to affordable, reliable, sustainable, and modern energy for all directly relates to efforts to improve access to clean cooking technologies.
SDG 10 – Reduced Inequality: Efforts to ensure inclusive economic growth and equitable access to clean cooking technologies contribute to reducing inequalities within society.
SDG 11 – Sustainable Cities and Communities: Urban planning and infrastructure development related to clean cooking technologies contribute to building sustainable cities and communities.
SDG 13 – Climate Action: The adoption of clean cooking technologies aligns with climate action goals by reducing reliance on traditional biomass fuels, contributing to mitigating climate change.
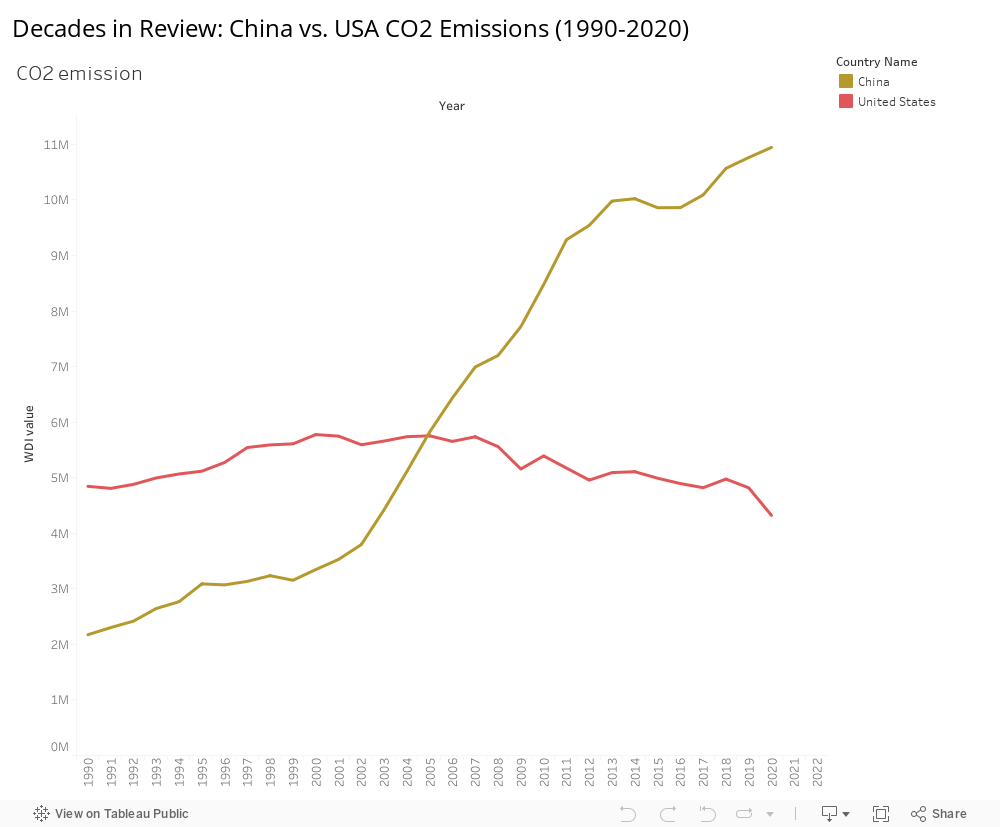
In the unfolding narrative of global environmental challenges, the tale of the United States and China emerges as a compelling story of shifting roles and responsibilities in the battle against climate change.
The visual representation of CO2 emissions between the United States and China from 1990 to 2020 on a line chart underscores a critical environmental challenge. The problem lies in the discernible shift of emission supremacy between the two nations, with the USA leading until 2005, at which point China surpassed it. This transition is indicative of a broader issue: the need for a collective, global response to address escalating carbon emissions. The evidence is clear—the historical dominance of the United States in emissions, followed by China’s ascent—underscores the urgency of finding a sustainable solution. The potential remedy to this issue requires a multifaceted approach. Firstly, international collaboration is paramount, necessitating joint efforts in clean energy initiatives, sharing technological advancements, and leveraging collective resources. Secondly, a focus on renewable energy sources, coupled with substantial investments in carbon capture technologies, is crucial. Additionally, stringent emissions regulations and their effective enforcement should be implemented, with governments playing a pivotal role in setting and monitoring emission reduction targets. A comprehensive solution also involves public and private sectors prioritizing sustainability, embracing energy-efficient practices, and fostering innovation. In conclusion, the story depicted by the line chart serves as a clarion call for immediate and concerted action. Recommendations include fostering global collaboration, prioritizing renewable energy, implementing robust regulations, and cultivating a collective commitment to a sustainable future—a future where the line chart reflects a downward trend in CO2 emissions for both the United States and China.
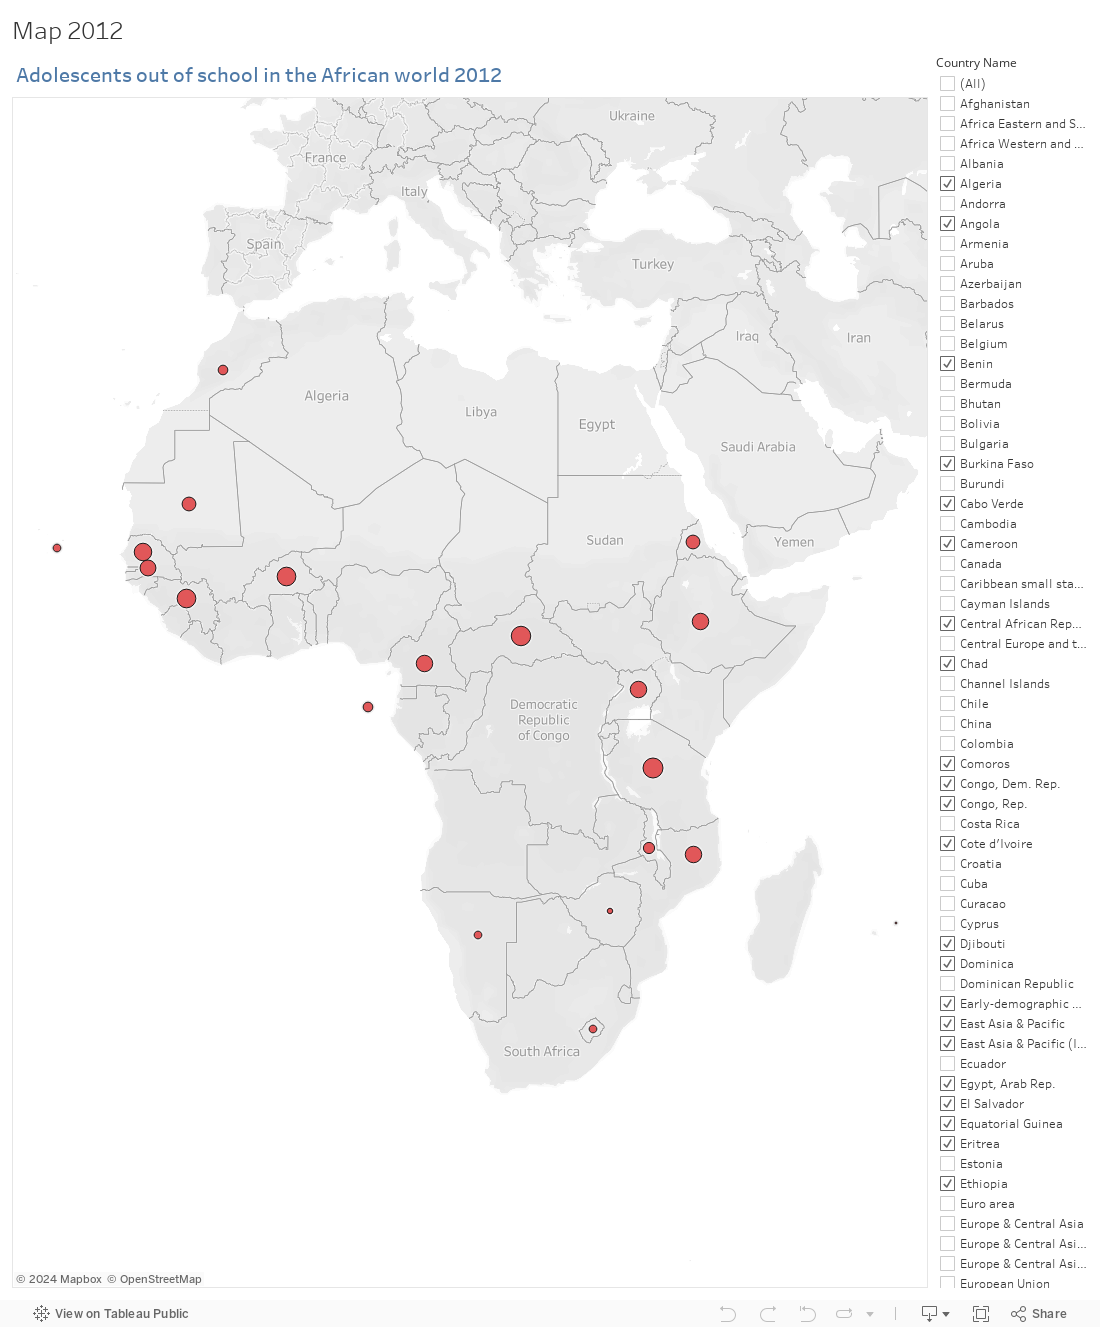
Education is the cornerstone of development, unlocking doors to a brighter future. Education plays an essential role in achieving the Sustainable Development Goals (SDGs). The persistent challenge of education in African countries, particularly for adolescents, has always been an obstacle, contributing to the developmental lag experienced of these nations.
Adolescents out of school in 2012:
In 2012, a large percentage of adolescents were out of schools. Reasons vary but they can be summarized in
Inadequate educational infrastructure
Social disparities especially marriage
Barriers to access in rural areas
Shortage of qualified teachers
Limited access to modern teaching materials
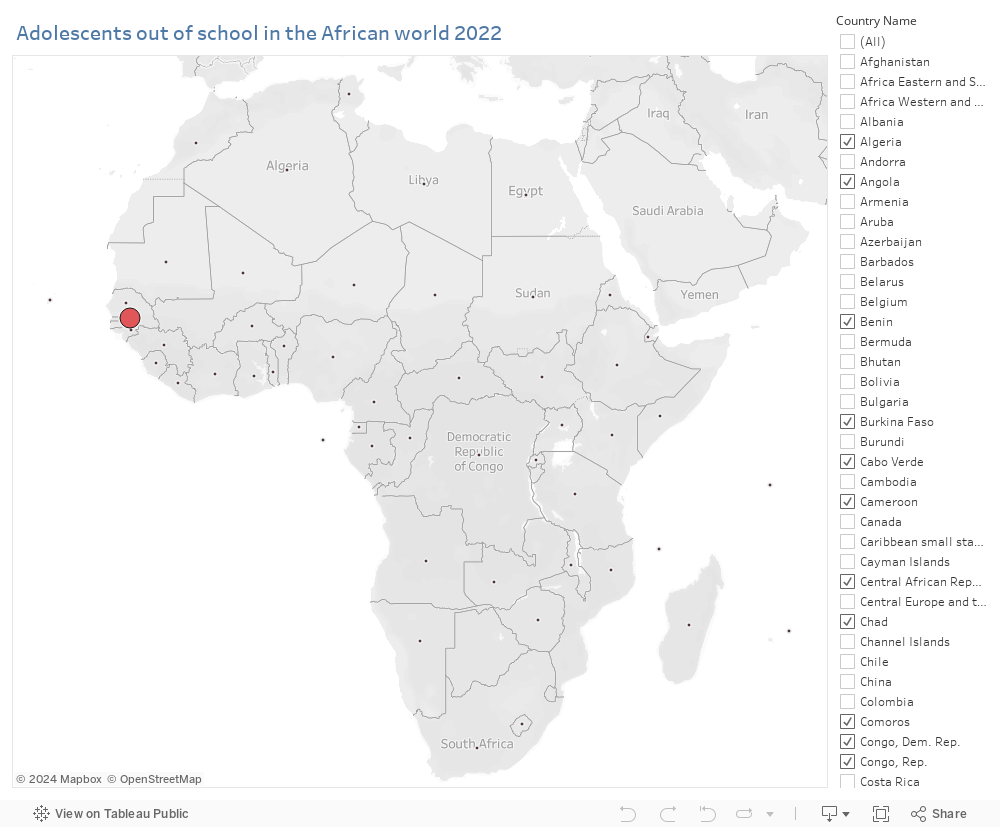
Adolescents-out-of-school rate in African Countries:
The map assures visually and represents educational challenge with larger red circles denote higher percentages where the adolescents-out-of-school rate is really high in comparison to other countries.
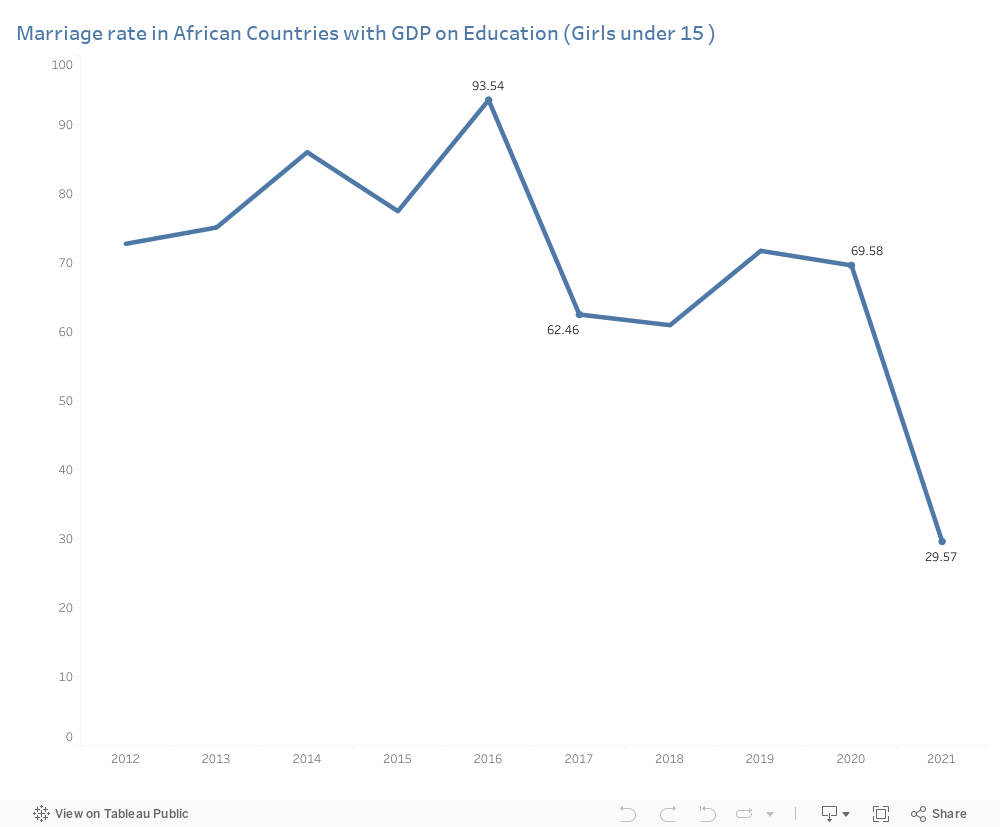
Early Marriage
The high marriage rates in often limit access to formal learning opportunities. The social expectations surrounding marriage can act as a barrier, particularly for young girls, impeding their ability to complete their education. However, fast forward to 2022, a shift in the educational landscape had occurred. In 2016, marriage rates for girls under 15 stood at a shocking 93%. However, a line chart traced a journey of change from 2016 to 2017, witnessing a substantial drop to 62%. The trend continued into the years 2020 and 2021, where the marriage rate further decreased to a promising 29%.
Now, this shows the rate of out-of-school adolescents that had fallen. Hope began to blossom becoming an inspiration of progress in the (SDGs).
Correlation between Marriage and School enrollment:
The story unfolded with a realization – the decline in early marriages played a key role in fostering educational empowerment with a correlation between decrease in marriage rates and increase in school enrollment. Yet, a small number is still beyond the ideas of education.
Urgent Call for action:
Community Engagement and Awareness
Investment in Infrastructure
Government Policy Reforms
Teacher Training and Support
Partnerships with NGOs and Corporations
Monitoring and Evaluation
The tale of progress in African education reminds the world that transformation is possible when communities unite, prioritize education, and nurture the dreams of their youth…