In Japan, it is common for businesses to rely on the belief that well-crafted, reliable products can sell themselves without heavy marketing. One small online furniture shop followed this philosophy closely, focusing on quality materials, clean design, and dependable service rather than advertising campaigns.
The approach worked.
Orders were steady, reviews were positive, and most furniture categories- including chairs, shelves, bookcases, and storage units- consistently generated profit. By all traditional indicators, the business was healthy.
Yet something remained unusual: despite growing revenue, overall profit growth was slower than expected. The business was performing well, but its profitability did not scale proportionally with sales. This discrepancy prompted a closer look into where exactly profit was coming from, and where it might be slipping away.
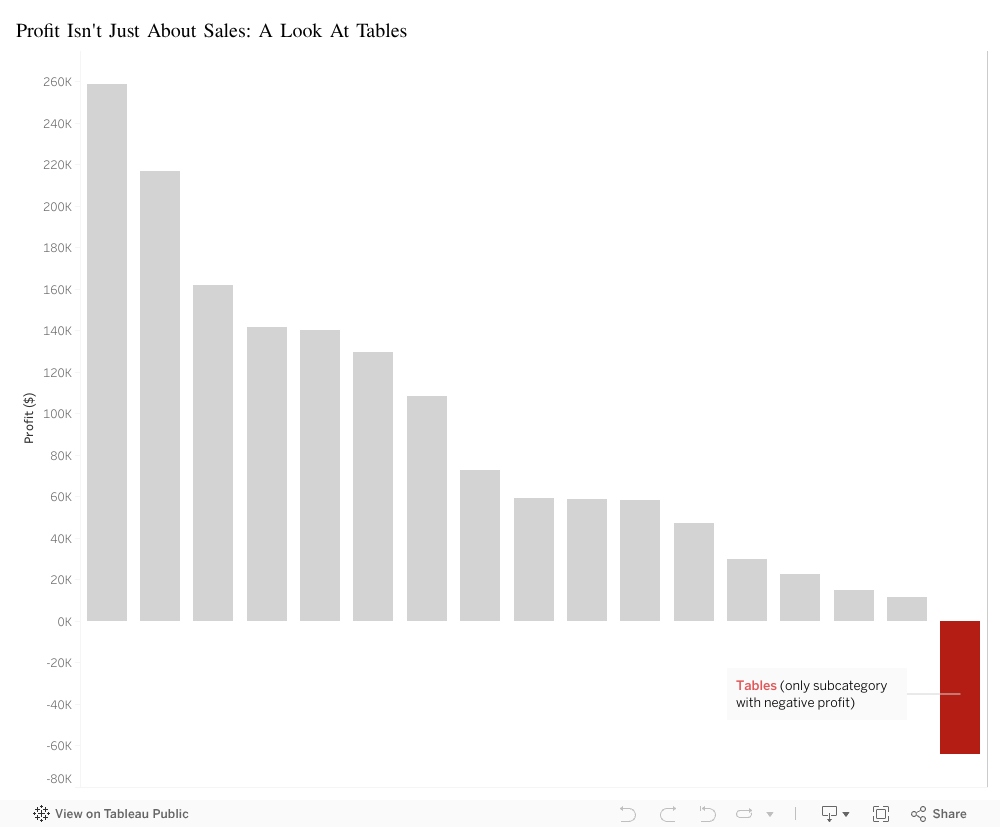
To investigate the issue, a visualization was created to compare profit across all product subcategories. The results were striking. Almost every bar on the chart showed positive profit. Except one.
Tables: -$64,083.
The only unprofitable subcategory in the entire catalog.
This finding was particularly surprising because tables were not low-demand items; in fact they were bestsellers. From a revenue standpoint, tables performed extremely well.
However, when analyzed beyond the point of sale, the underlying issue became clear. Tables carried significantly higher operational costs than any other category:
They required two delivery workers due to their size and weight
They were difficult to deliver in most Japanese apartments with narrow hallways and small elevators
They consumed significant warehouse space because of their bulky shape
They were more prone to scratches or delivery damage, leading to replacements and refunds
In short, tables were profitable at the moment of sale but unprofitable everywhere after the sale.
The business was not struggling because demand was weak- it was struggling because one high-demand product quietly erased a portion of the gains made by every other category.
Recognizing this pattern allowed the company to take targeted action to correct the issue. Several operational improvements were introduced:
Table packaging was redesigned to better withstand delivery
A modest oversized-item surcharge was added to reflect true handling costs
Warehouse organization was adjusted to reduce movement and handling time
These adjustments helped the business align its operational costs with its revenue, restoring profit balance across the catalog.
The visualization ultimately highlighted a broader lesson:
A product can be popular, well-reviewed, and frequently purchased- yet still unprofitable if its hidden costs exceed what it brings in.
Revenue alone does not determine success. Understanding the full journey of a product, from warehouse to delivery, is essential for sustaining a healthy business.
Lebanon’s tourism story is usually told through familiar names — Byblos, Batroun, Tyre, and the busy towns of Mount Lebanon. These places dominate postcards, travel websites, and our mental image of tourism in Lebanon. But when we examine the 2023 tourism data at the governorate level using the interactive dashboard below, a different picture emerges — one that challenges assumptions and highlights hidden opportunities.
Tourism Across Lebanon: What the Dashboard Reveals
Geography Shapes Tourism More Than Reputation
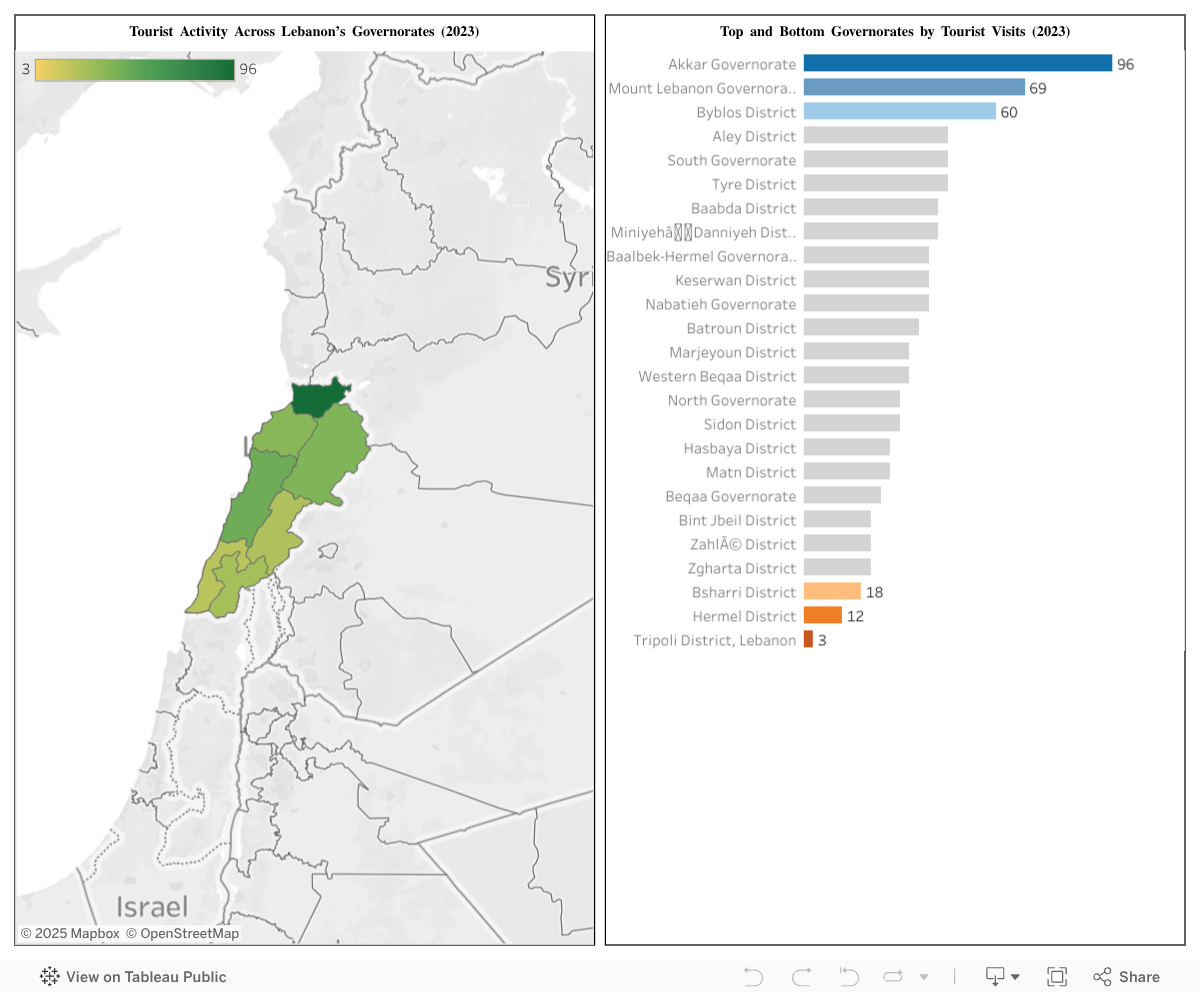
The map visualization makes one fact immediately clear: tourism is unevenly distributed across Lebanon. Some governorates attract far more visitors than their visibility would suggest, while others — even areas with cultural significance — fall unexpectedly low.
Akkar, Lebanon’s northernmost governorate, stands out with the highest number of tourist visits (96) in 2023. This finding is surprising, since Akkar rarely appears on national tourism campaigns or travel platforms. Yet the map shows it as Lebanon’s most visited region.
On the opposite end, Tripoli District records only 3 visits, placing it last among all governorates despite its rich urban culture and history.
This geographic contrast reveals patterns that simple lists or tables cannot show.
Top and Bottom Governorates by Tourist Visits (2023)
A New Ranking of Tourism Leaders and Underperformers
The bar chart sorts the governorates by visitor count, bringing the story into focus. Three distinct tiers emerge:
Top Performers: • Akkar (96) • Mount Lebanon (69) • Byblos District (60)
These three regions anchor Lebanon’s tourism landscape — though Akkar’s leadership defies conventional narrative.
Middle Cluster: Most governorates fall between 20 and 45 visits. This broad middle zone represents consistent but moderate tourism activity: neither high-profile nor neglected.
Lowest Performers: • Bsharri District • Hermel District • Tripoli District (3)
Tripoli’s extremely low number highlights a significant gap between cultural value and actual tourist engagement.
Putting the Story Together
The dashboard reveals a powerful insight: Tourism follows geography, not assumptions.
The combination of map and ranking chart shows that:
Some undervalued regions attract far more visitors than expected.
High-visibility cities don’t automatically translate into higher tourism numbers.
Northern Lebanon may hold untapped potential.
Underperforming districts may need targeted promotion, accessibility improvements, or better tourism strategies.
Tourism in Lebanon is not strictly tied to popularity — it is shaped by mobility, access, and the surrounding travel ecosystem
Lebanon’s attractions are world-class, but the 2023 data reveals that tourist behavior doesn’t always follow the traditional narrative. Akkar’s rise as Lebanon’s leading tourism governorate suggests new opportunities for rural, coastal, and nature-based tourism. Meanwhile, Tripoli’s low ranking shows room for strategic investment to strengthen its visibility and appeal.
Understanding these geographic patterns gives policymakers, planners, and tourism stakeholders a more accurate foundation to build on. Lebanon’s tourism map is shifting — and this dashboard offers a clear view of where new opportunities are emerging.
In the period from 2019 to 2022, Lebanon faced an unprecedented confluence of crises that tested the resilience of its people and the stability of its economy. This tumultuous period unfolded against the backdrop of the global pandemic, the devastating explosion at the Beirut port, and an already fragile political and economic landscape.
In 2019, Lebanon was already grappling with economic challenges, a weakening currency, and public discontent. Little did the nation know that a series of events would unfold, further exacerbating its struggles.
The Economic Downturn:The year 2019 witnessed a decline in Lebanon’s GDP growth, driven by a combination of economic mismanagement, political instability, and a growing public debt. The situation worsened in 2020 as the global COVID-19 pandemic took hold. The pandemic not only strained healthcare systems but also disrupted global supply chains, affecting trade and exacerbating Lebanon’s economic woes.
The Impact of COVID-19:As COVID-19 spread globally, Lebanon, like many nations, implemented strict lockdowns to curb the virus’s spread. However, these measures had a significant economic toll, particularly on sectors such as tourism, hospitality, and services. Unemployment rates surged as businesses struggled to stay afloat in the face of lockdowns and reduced consumer spending.
The Beirut Port Explosion:August 4, 2020, marked a tragic turning point for Lebanon. The explosion at the Beirut port sent shockwaves through the country, causing widespread devastation and loss of life. Beyond the immediate human toll, the explosion dealt a severe blow to the economy. The port, a vital economic hub, was decimated, disrupting trade and further straining an already fragile economy.
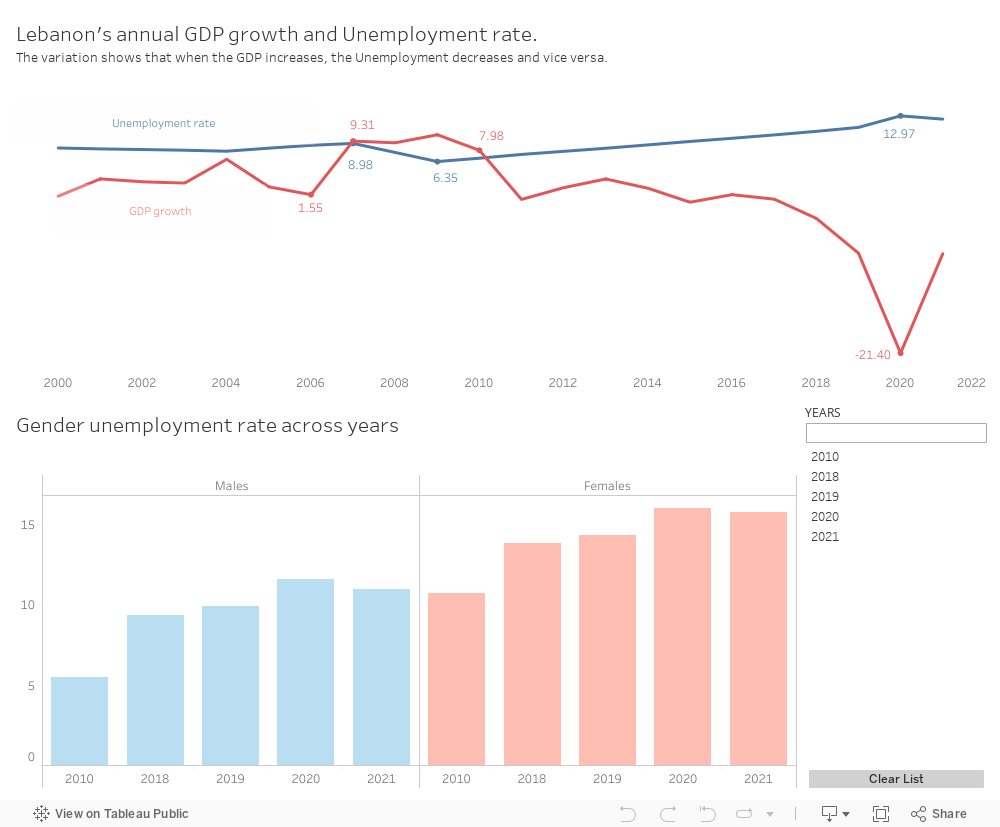
The Unemployment Crisis:As the GDP contracted, the unemployment rates, meticulously depicted in our Tableau visualizations, soared. The economic downturn, compounded by the pandemic and the port explosion, left countless Lebanese citizens without jobs. The barchart vividly illustrates the gender-specific impact, showcasing the challenges faced by both males and females in this turbulent period.
Solutions
Yet, in adversity lies the opportunity for resilience and recovery. As we examine the line chart depicting GDP growth, a glimmer of hope emerges. The chart illustrates a gradual increase in GDP in 2021, signaling a potential comeback.
To foster this recovery and bolster Lebanon’s economy, a multi-faceted approach is essential. Some potential solutions include:
Economic Reforms: Implement comprehensive economic reforms to address fiscal challenges, improve governance, and attract foreign investment.
Infrastructure Investment: Focus on rebuilding and modernizing infrastructure, including the reconstruction of the Beirut port, to stimulate economic activity and enhance trade capabilities.
Support for Small Businesses: Provide targeted support for small and medium-sized enterprises (SMEs) to encourage entrepreneurship, create jobs, and revitalize local economies.
International Aid and Collaboration: Seek international aid and collaborate with the global community to access financial assistance, technical expertise, and humanitarian support.
Healthcare Investment: Invest in the healthcare sector to strengthen the country’s resilience to health crises, fostering a healthier workforce and more robust economic conditions.
As Lebanon charts its course towards recovery, these solutions offer a roadmap for rebuilding and fostering sustainable development. The line chart becomes a symbol of resilience, capturing not only the challenges faced but also the potential for renewal and progress.
Resilience and Hope:Despite these challenges, the people of Lebanon exhibited remarkable resilience. Communities came together to support one another, and NGOs and international aid played a crucial role in providing relief. The visual representation of GDP decline and rising unemployment underscores the urgency of addressing the socioeconomic impacts of crises.
Lebanon’s journey through these challenging years serves as a testament to the strength of its people. While the road to recovery is long and arduous, the collective spirit and determination of the Lebanese offer a glimmer of hope for a brighter future.
A world where economic diversification is often seen as the path to financial stability, Lebanon stands out as a nation that has primarily relied on non-agricultural sectors for its economic sustenance. Despite its rich agricultural potential, the country has chosen to prioritize other industries. As Lebanon grapples with a severe economic crisis, it’s crucial to examine the consequences of this strategy and consider whether a renewed focus on agriculture could offer a more resilient path forward.
The main problem Lebanon is currently facing!
Lebanon is currently not placing sufficient emphasis on the agriculture and aquaculture sectors as potential revenue sources.
This neglect comes at a time of economic hardship, marked by a consistent decline in GDP over the years.
Problem Evidence:
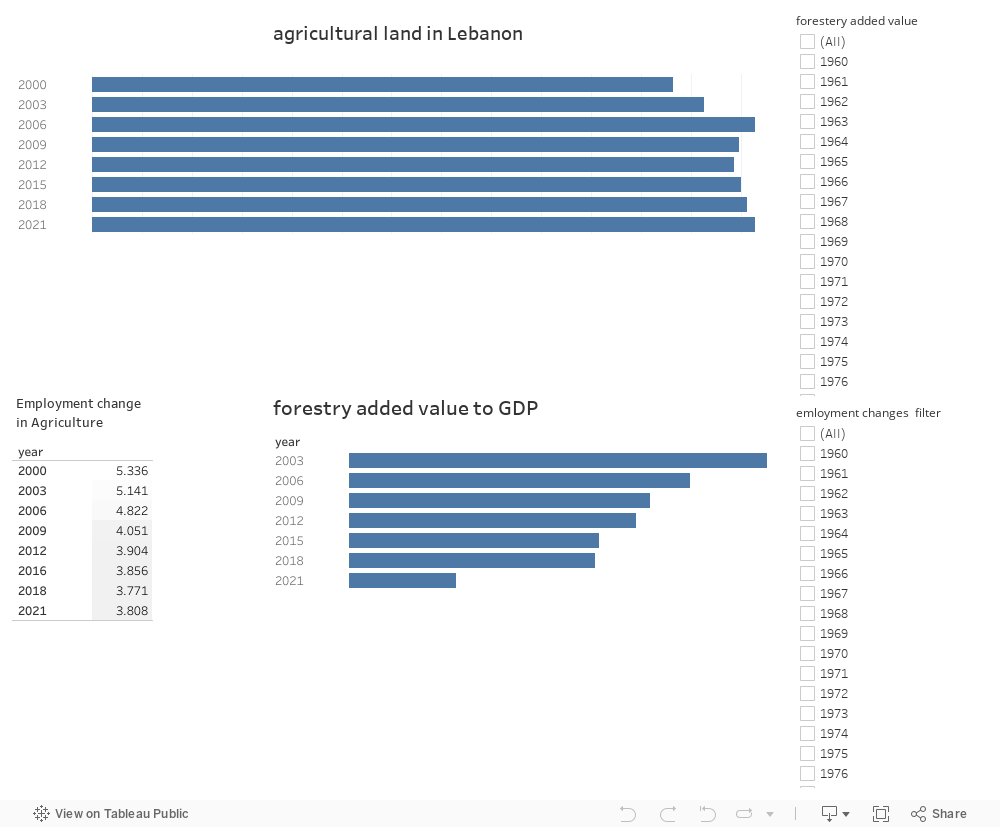
Despite the presence of fertile land for agriculture and planting, there is a notable absence of qualified and active employees in this sector, as evidenced by the consistent decline in the percentage of the workforce engaged in agriculture over the years. (the percentage decreases from 5.3%in 2000 to 3.8% in 2021 low percentage of the total employment)
the contributions of forestry and aquaculture to the GDP have been on a continuous decline. (The percentage decreased from 6.3% in 2000 to 1.4% in 2021, indicating a relatively low contribution)
Lebanon’s GDP growth has been consistently decreasing over the years, reaching a troubling -7% in 2021.
Potential solutions
Placing greater emphasis on the agriculture and aquaculture sectors by providing support to local farmers and expanding cultivation areas to meet domestic demands while also generating surplus for export.
Additionally, increasing the number of professionals in this field can be achieved by encouraging universities to prioritize agriculture-related majors and motivating students to pursue studies in this area.
This will result in:
Increased revenue generation and improvements in Lebanon’s GDP after expanding cultivation areas and supporting the agriculture and aquaculture sectors.
Real life success story:
In the summer of 2023, two Lebanese citizens seized the opportunity to cultivate a green, organic farm in the fertile lands of southern Lebanon. Taking advantage of the region’s fertile soil, expansive agricultural land, and favorable weather conditions, they cultivated a variety of fruits and vegetables.
With an initial investment of $1,500, they managed to yield a net profit of $5,000 in just four months. This success story highlights the untapped potential of agriculture and organic farming in Lebanon.
The successful cultivation they were able to get!!!
This solution is validated by the real case example presented at the beginning:
Based on the real-life example, if Lebanon gave more importance to the agriculture sector, this would lead to an increase in domestic production. This, in turn, could serve as a partial solution to the economic and financial crisis the country is facing. Moreover, it would also create more employment opportunities for Lebanese citizens, thereby contributing to a more sustainable and diversified economy. Emphasizing the agriculture sector can play a vital role in bolstering the nation’s economic stability and reducing its reliance on other sectors.
finally, emphasizing agriculture in Lebanon as a means of economic revitalization directly supports SDG 8’s objectives by creating decent work, fostering sustainable economic growth, promoting economic diversification, and facilitating skills development in the agricultural sector.
In the intricate tapestry of a nation’s prosperity, nothing weaves a more profound impact than the state of its healthcare system. The vitality of its citizens, the resilience of its communities, and the promise of a prosperous future all hinge on the health and wellness of the population. A healthy population is a productive one, as it reduces absenteeism, increases workforce efficiency, and stimulates economic growth.
Yet, as we embark on this journey through the labyrinth of healthcare, one question looms above all: How can we chart the course to assess and improve a country’s medical system, ensuring a brighter, healthier tomorrow for all? Evaluating the medical system of a nation is a complex endeavor that requires a comprehensive approach to several factors we will delve deeper into later.
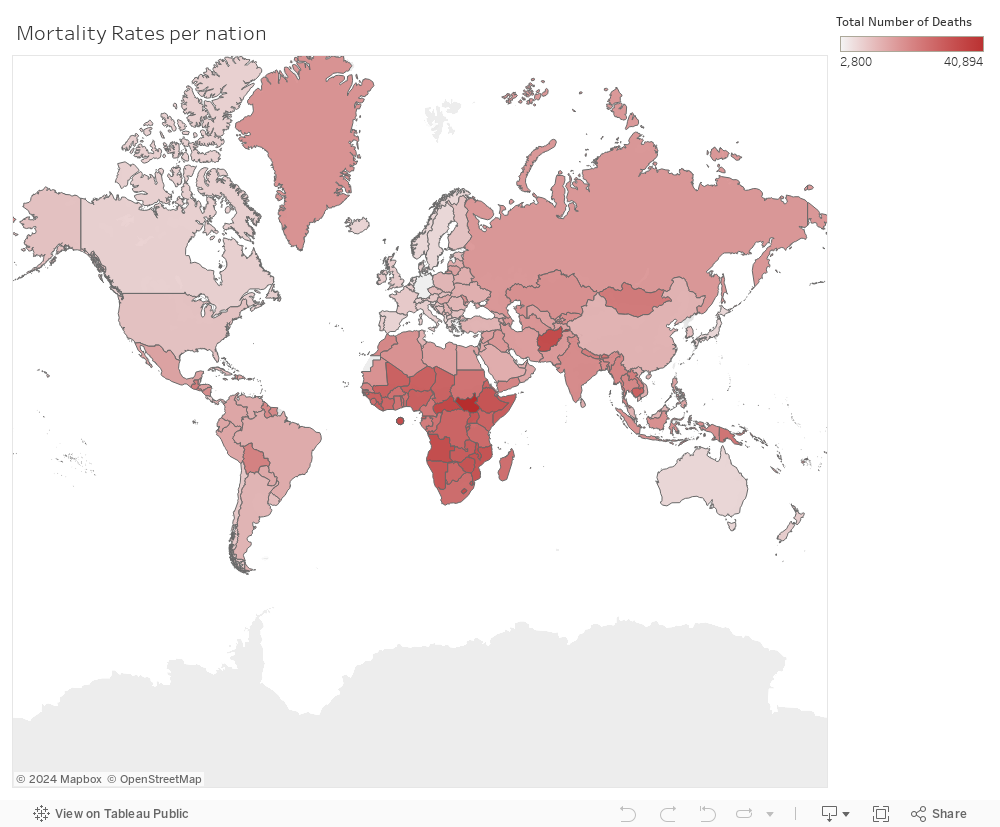
One indicator that may be used to assess the effectiveness of the medical industry is the mortality rate. From the data provided by World Development Index, countries with high death rates, such as the Central African Republic, Niger, South Sudan, and many others, have poor healthcare systems, as seen in the visual below:
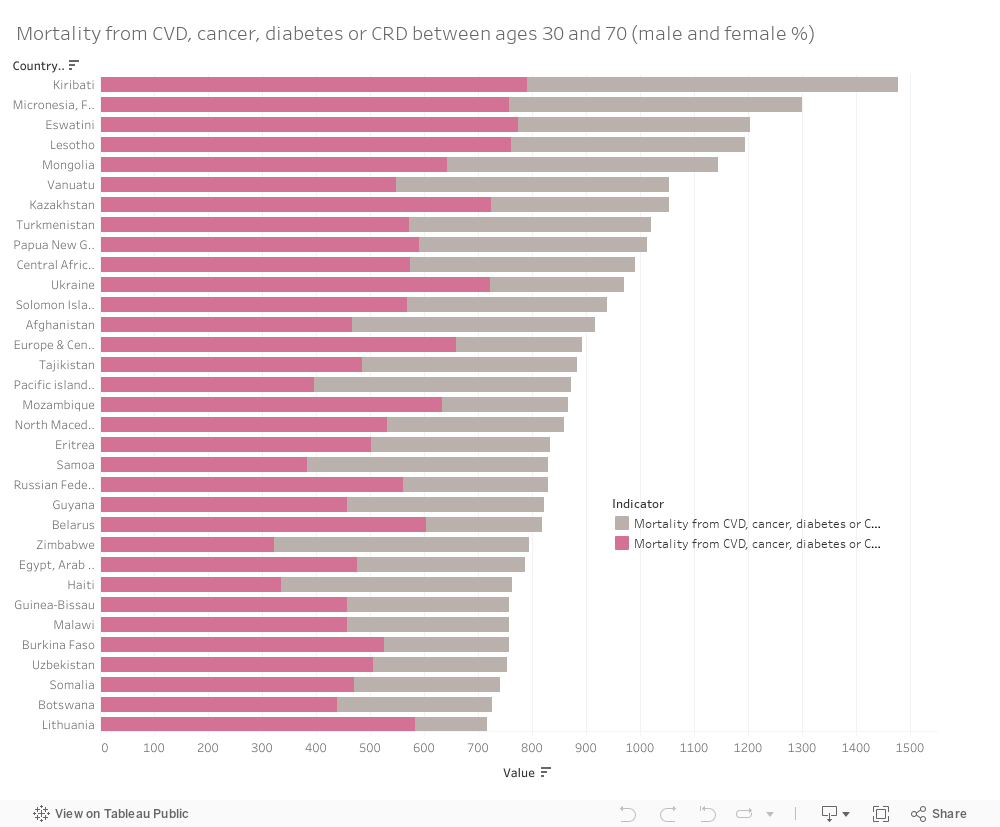
Furthermore, there exists a strong correlation between CVDs, cancer, diabetes and other illnesses that significantly impacted the mortality rate indication for both males and females. This implies that countries experience high mortality rates due to the increasing rates of the above-mentioned illnesses and diseases. Also, an implication of the absence of some healthcare services such as a lack of efficient medical professionals may be valid as well in such a case.
As a matter of fact, the presence of medical professionals that can assist society and offer health care is one of the most important measures of how well the medical sector is doing. Therefore, one potential solution is enhancing the availability of medical professionals that are prone to doing their job effectively.
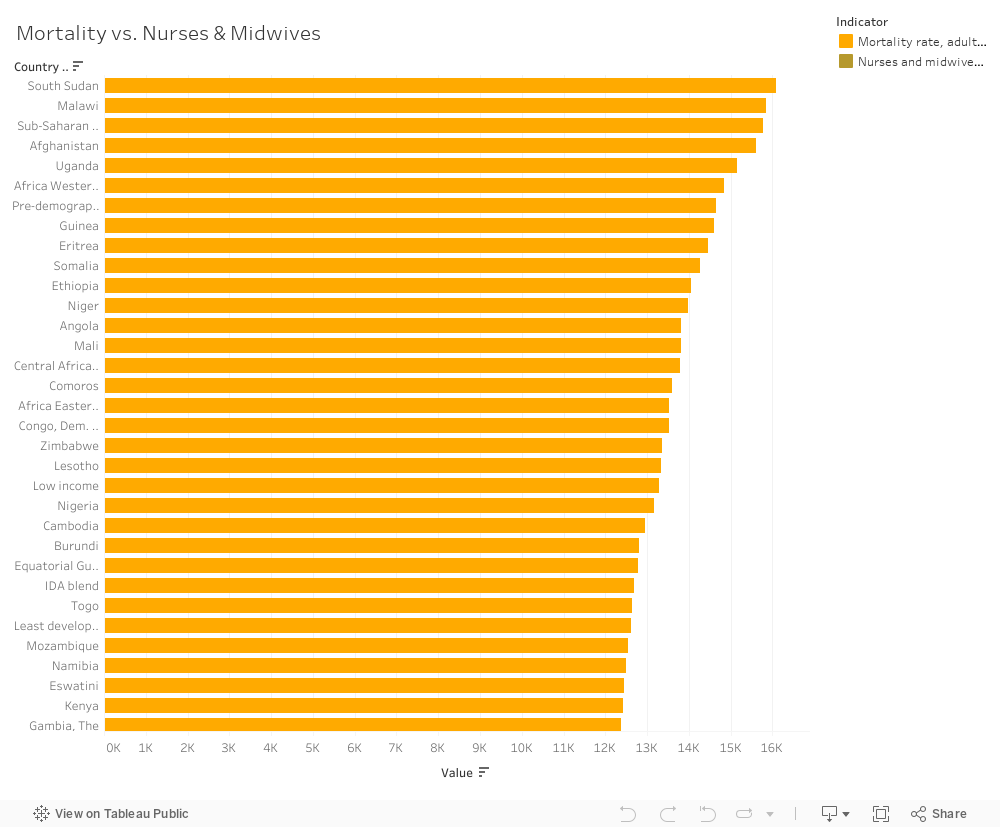
There exists a weak correlation between the availability of nurses and midwives and the increasing rates of mortality. This is because an effective team of well-experienced nurses and midwives can strongly lead to a decrease in the number of deaths per hospital. The top 5 nations with the highest mortality rates also have the lowest number of nurses and midwives.
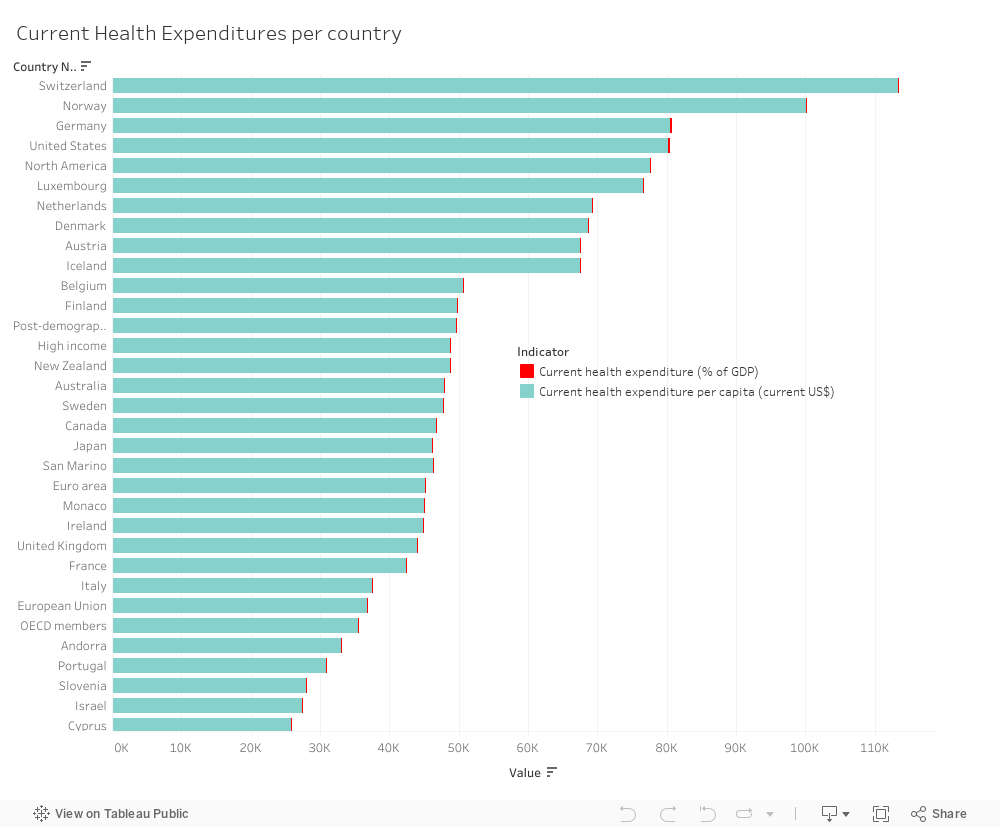
Another potential solution involves increasing expenditures in the healthcare field to gain access to more promising and efficient results. In order to improve the health of their medical industry, the nations with greater rates of mortality have to gain insight from the experience of those with developed healthcare systems, where a significant percentage of the more developed countries’ expenses goes to health expenditures (ex: United States, Denmark, Luxembourg, Norway etc.) Higher expenditure on healthcare implies higher expenditure on more enhanced medical professionals whose primary role is to save the day by decreasing mortality rates. Moreover, we can see that while less developed nations such as South Sudan and many others have far greater mortality rates (as discussed earlier), they almost all have a lower number of health expenditures too.
Countries with high mortality rates should prioritize expanding their nurse and midwife workforce. This can be achieved through targeted recruitment, better training opportunities, and incentives to retain experienced healthcare professionals. In nations with a scarcity of healthcare workers, it is crucial to consider redistributing them from regions with surplus staff to areas with greater need. This can help ensure more equitable access to healthcare services and reduce mortality disparities.
Also, the observation that less developed nations with higher mortality rates also have lower health expenditures highlights the need for increased investment in healthcare infrastructure, training, and resources. Adequate funding can have a significant impact on healthcare accessibility and quality.
In conclusion, the state of a nation’s healthcare system is a complex web created by several kinds of variables. According to the results of our investigation, nurses and midwives are vital in determining healthcare outcomes, and there seems to be a link between their availability and death rates. Key suggestions to improve patient care and results included strengthening the healthcare workforce through recruiting, skill development, and equitable distribution.
Furthermore, the evidence indicated a clear link between less health expenditures and higher mortality rates in several less developed nations. This emphasizes the urgent need for increased funding and resources to bridge healthcare disparities and improve the well-being of vulnerable populations.
As we journey towards a brighter future, let us remember that the path to a thriving medical system lies in unity, innovation, and data-informed decision-making.