In the unfolding narrative of global environmental challenges, the tale of the United States and China emerges as a compelling story of shifting roles and responsibilities in the battle against climate change.
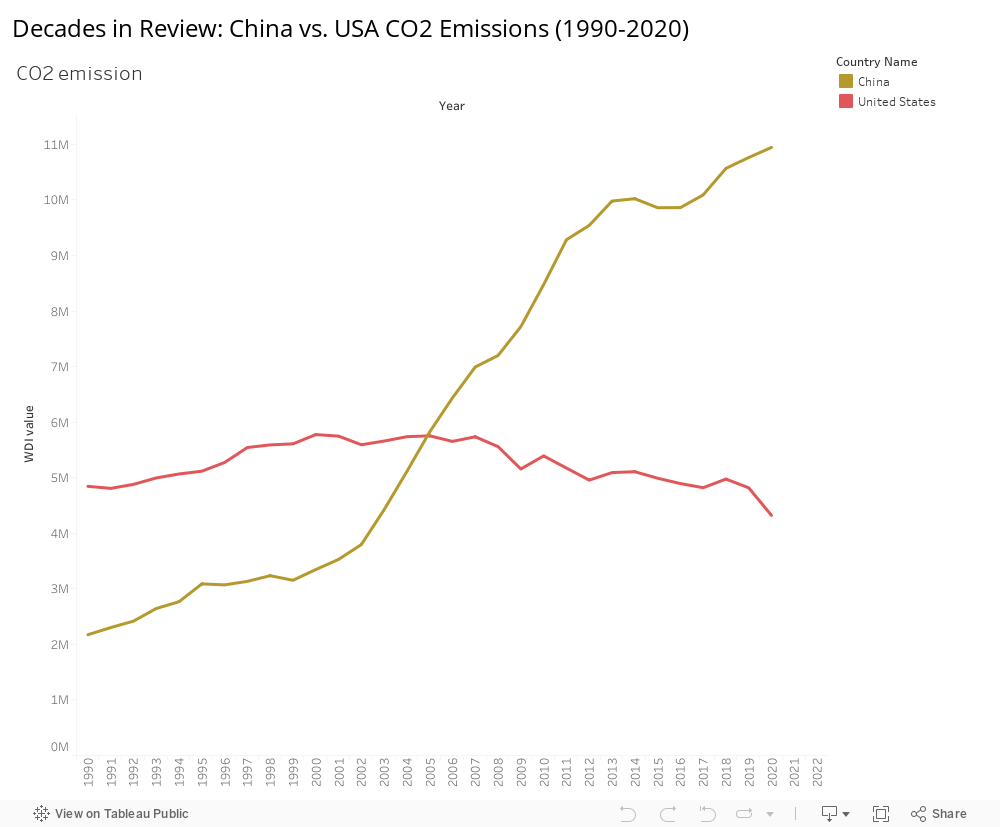
The visual representation of CO2 emissions between the United States and China from 1990 to 2020 on a line chart underscores a critical environmental challenge. The problem lies in the discernible shift of emission supremacy between the two nations, with the USA leading until 2005, at which point China surpassed it. This transition is indicative of a broader issue: the need for a collective, global response to address escalating carbon emissions. The evidence is clear—the historical dominance of the United States in emissions, followed by China’s ascent—underscores the urgency of finding a sustainable solution. The potential remedy to this issue requires a multifaceted approach. Firstly, international collaboration is paramount, necessitating joint efforts in clean energy initiatives, sharing technological advancements, and leveraging collective resources. Secondly, a focus on renewable energy sources, coupled with substantial investments in carbon capture technologies, is crucial. Additionally, stringent emissions regulations and their effective enforcement should be implemented, with governments playing a pivotal role in setting and monitoring emission reduction targets. A comprehensive solution also involves public and private sectors prioritizing sustainability, embracing energy-efficient practices, and fostering innovation. In conclusion, the story depicted by the line chart serves as a clarion call for immediate and concerted action. Recommendations include fostering global collaboration, prioritizing renewable energy, implementing robust regulations, and cultivating a collective commitment to a sustainable future—a future where the line chart reflects a downward trend in CO2 emissions for both the United States and China.
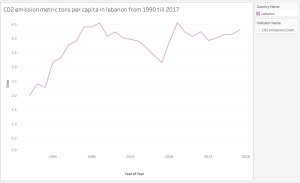
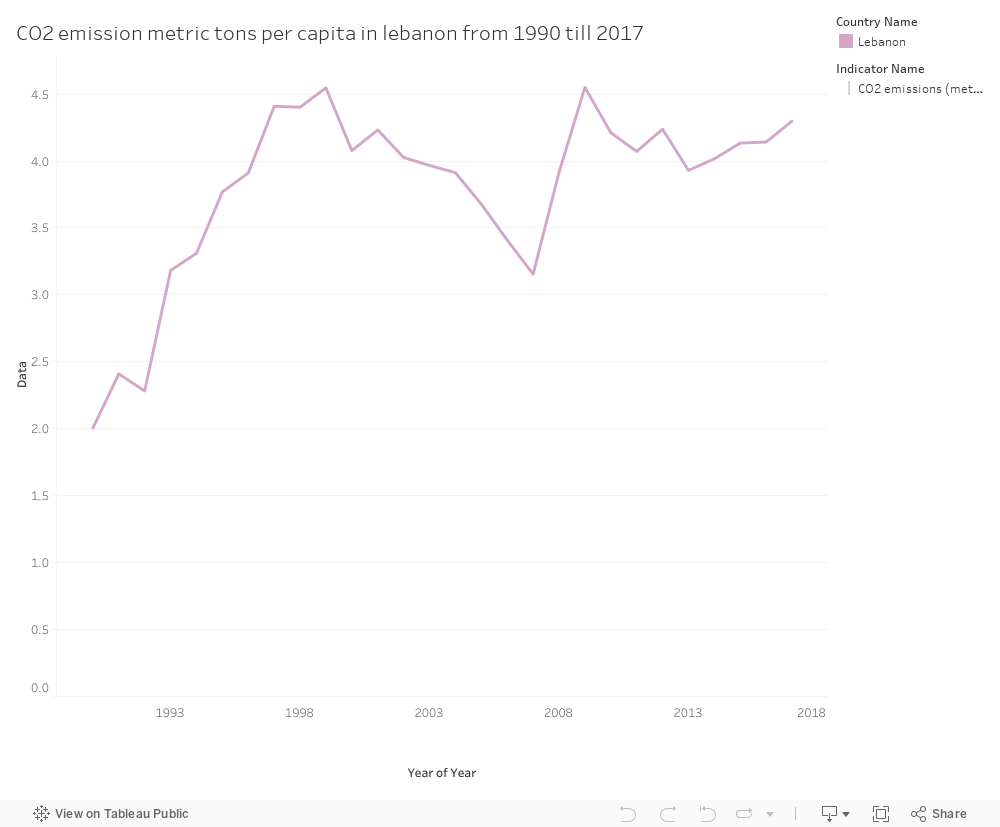
Carbon dioxide (CO2) is incorporated into organic matter during photosynthesis. It is a result of burning fossil fuels and burning biomass, and it is also released with changes in land use and other industrial activities. It is the main greenhouse gas produced by humans that has an impact on the planet’s radiative balance. Since it serves as the benchmark for measuring other greenhouse gases, it has a global warming potential of 1. Since the industrial revolution, using carbon-based fuels has quickly increased atmospheric carbon dioxide concentrations, accelerating global warming and contributing to anthropogenic climate change. Fossil fuel burning and cement production are the main sources of anthropogenic carbon dioxide emissions. Co2 emissions in Lebanon is considered a crucial and serious problem. The tons are increasing throughout the years, and the government should find solutions to decrease this rate.
The graph, shows the CO2 emissions metric tons in Lebanon from 1990 to 2017, as shown the level of CO2 emissions in 1990 was 2.005 metric tons, however, the level increased in 2017 and became 4.300 metric tons.
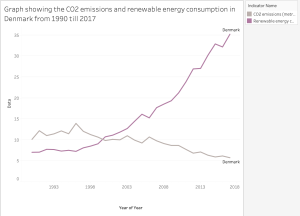
Denmark is from the countries that had a high level of CO2 emissions, however, this rate start decreasing throughout the years.
According to the graph, the CO2 emissions were 10.13 metric tons in 1990, this rate decreased to 5.75 in 2017.This proofs that Denmark took the necessary measures to decrease this rate. Denmark achieved this reduction through producing energy from renewable energy sources such as (wind, solar..). This graph also shows the renewable energy consumption in Denmark from 1990 to 2017. Renewable energy consumption is the ratio of the overall (primary) gross inland energy consumption to the gross inland consumption of energy derived from renewable sources. It is determined by adding up the gross domestic renewable energy consumption. In 1990 the consumption rate was 7.04, this rate increased to 35.20 in 2017.There is a negative relation between CO2 emissions and renewable energy consumption.AS renewable energy consumption increase, the co2 emissions decrease.
Since CO2 emissions are the reason behind climate change and global warming, Lebanon must rely on Sustainable Development Goal 13 which aims to “take urgent action to combat climate change and its impact” and SDG 7.2 which aims to increase substantially the share of renewable energy in the global energy mix.
Lebanon must:
Increase the amount of energy produced from renewable sources (wind, solar)
Industrial enterprise modernization using the finest technologies available
Replacement of fossil fuels by renewable sources of energy
Rail and water transportation are two low-carbon public transportation developments.