Believe it or not, climate change may prevent us from enjoying many of our favorite meals in the next years. Some crops may go extinct, while others may become scarce and expensive. Who does not enjoy chocolate? The cocoa plant may be completely wiped out by 2050. Who doesn’t drink coffee in the morning? By 2100, 50% of the land will be unsuitable to grow coffee. Human activities have been the primary cause of climate change due to burning fossil fuels.
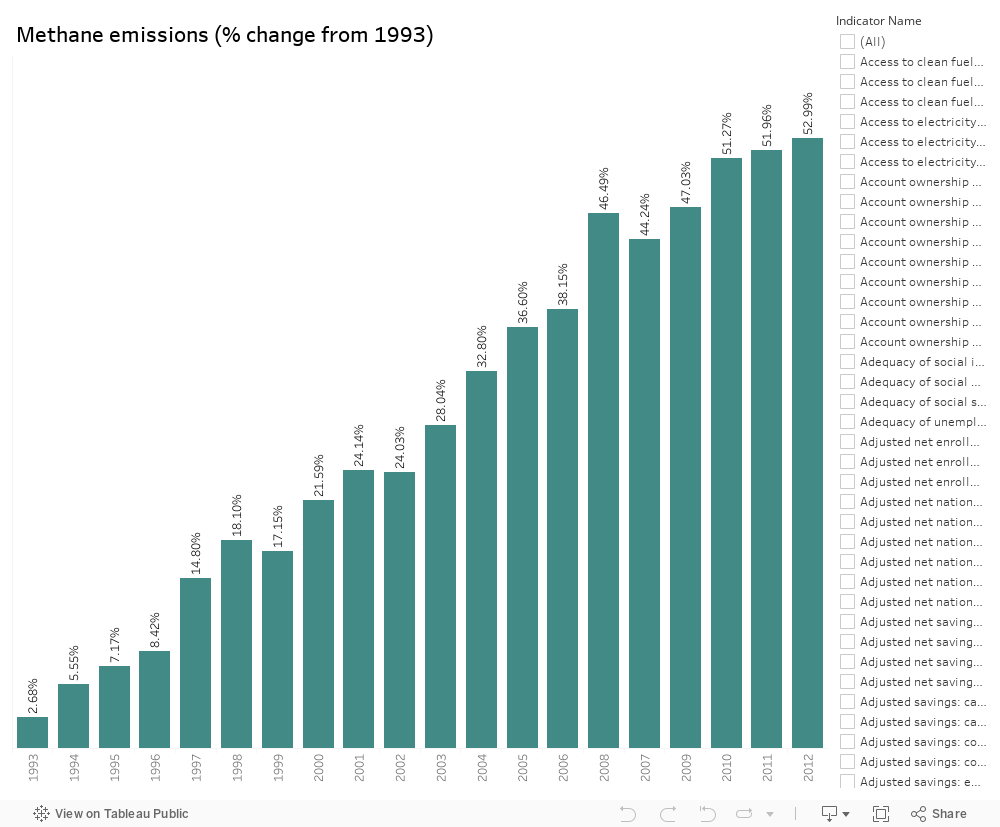
When fossil fuels are burnt, significant amount of greenhouse gases are released into the atmosphere and these gases trap heat in our atmosphere and contribute to global warming. Methane is greenhouse gas that is responsible for around 30% of the rise in global temperatures and as you can see, methane emission has increased rapidly over the years all around the globe.
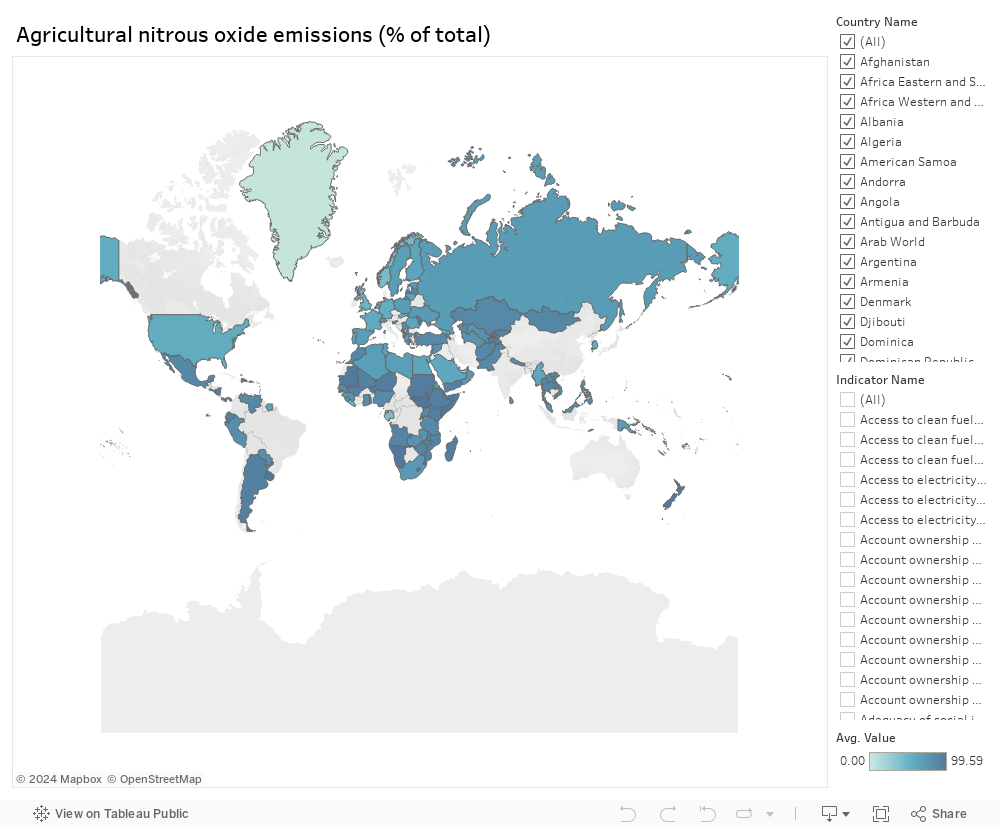
Nitrous oxide is the third most major greenhouse gas, accounting for around 7% of global warming. Coffee production has declined mostly as a result of rising yearly temperatures in coffee-producing countries such as Brazil, Vietnam, Indonesia, and Colombia. This map visualizes the precent of Nitrous Oxide, the darker the color, the higher the percentage.
There is no planet B, so we shouldn’t need another reason to act and try to prevent climate change from getting worse or risk the extinction of our favorite food. The question is, what can we do? We start from ourselves. There are a lot of things that we can do as individuals to help in reducing climate change effect. We should work on generating electricity from wind, solar and other renewable sources, as opposed to fossil fuels, which emits little to no greenhouse gases or pollutants into the air. We can also help by following the rule of reduce, reuse, repair, and recycle in our everyday activities. We can also pay attention to throwaway less food, save more energy, and speak up about the issue to raise awareness.
What else can be done? Some coffee beans generally grown in hotter climates, and we should investigate more about and encourage farmers it to plant more of it in the future. We can also develop technologies to enable the adaptation of coffee production to future climatic change conditions. One of the initiatives being pursued by scientists at the University of California is to utilize new technology to help the plant survive. The team at Berkeley is working with the Mars company on gene-editing technology, to help the plant to survive in the uncertain years to come.
In 2020, emissions fell by 5.8 percent due to COVID-19 and the resulting economic crisis. Therefore, our individual efforts count, and we can make a difference!
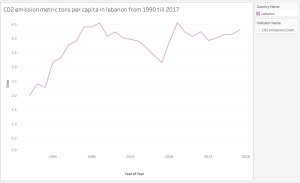
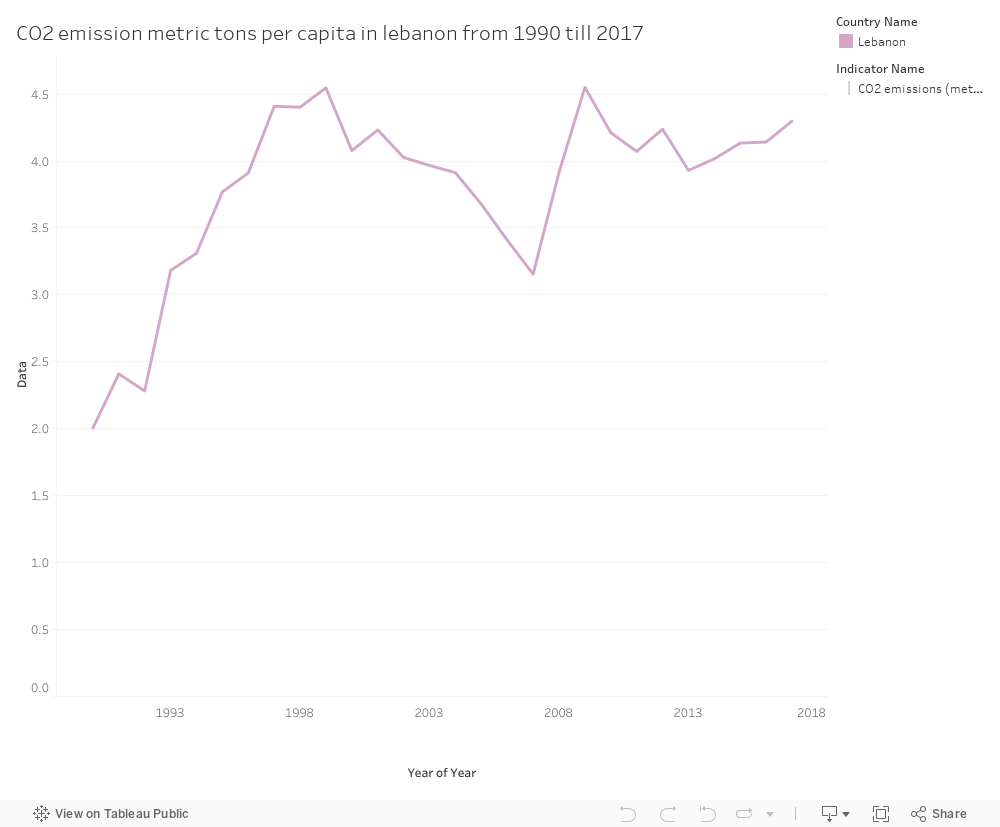
Carbon dioxide (CO2) is incorporated into organic matter during photosynthesis. It is a result of burning fossil fuels and burning biomass, and it is also released with changes in land use and other industrial activities. It is the main greenhouse gas produced by humans that has an impact on the planet’s radiative balance. Since it serves as the benchmark for measuring other greenhouse gases, it has a global warming potential of 1. Since the industrial revolution, using carbon-based fuels has quickly increased atmospheric carbon dioxide concentrations, accelerating global warming and contributing to anthropogenic climate change. Fossil fuel burning and cement production are the main sources of anthropogenic carbon dioxide emissions. Co2 emissions in Lebanon is considered a crucial and serious problem. The tons are increasing throughout the years, and the government should find solutions to decrease this rate.
The graph, shows the CO2 emissions metric tons in Lebanon from 1990 to 2017, as shown the level of CO2 emissions in 1990 was 2.005 metric tons, however, the level increased in 2017 and became 4.300 metric tons.
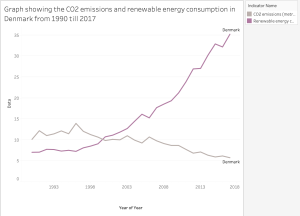
Denmark is from the countries that had a high level of CO2 emissions, however, this rate start decreasing throughout the years.
According to the graph, the CO2 emissions were 10.13 metric tons in 1990, this rate decreased to 5.75 in 2017.This proofs that Denmark took the necessary measures to decrease this rate. Denmark achieved this reduction through producing energy from renewable energy sources such as (wind, solar..). This graph also shows the renewable energy consumption in Denmark from 1990 to 2017. Renewable energy consumption is the ratio of the overall (primary) gross inland energy consumption to the gross inland consumption of energy derived from renewable sources. It is determined by adding up the gross domestic renewable energy consumption. In 1990 the consumption rate was 7.04, this rate increased to 35.20 in 2017.There is a negative relation between CO2 emissions and renewable energy consumption.AS renewable energy consumption increase, the co2 emissions decrease.
Since CO2 emissions are the reason behind climate change and global warming, Lebanon must rely on Sustainable Development Goal 13 which aims to “take urgent action to combat climate change and its impact” and SDG 7.2 which aims to increase substantially the share of renewable energy in the global energy mix.
Lebanon must:
Increase the amount of energy produced from renewable sources (wind, solar)
Industrial enterprise modernization using the finest technologies available
Replacement of fossil fuels by renewable sources of energy
Rail and water transportation are two low-carbon public transportation developments.