As our planet grapples with the consequences of climate change, this blog post delves into the complex relationship between human activities and our environment. Specifically, we’ll explore the dynamics of carbon dioxide (CO2) emissions, shedding light on the countries responsible for the highest emissions and examining their consequences on both land and water ecosystems.
The Global Landscape: Top 5 CO2 Emitters
When fossil fuels such as coal, oil, and natural gas are burned for energy, they release large quantities of CO2 into the atmosphere. The excessive release of CO2 and other greenhouse gases enhances the heat-trapping effect, causing a gradual warming of the planet known as global warming. This warming, in turn, leads to a wide array of climate change impacts, including disruptions to ecosystems.
Our journey begins with a visual exploration of the top five countries contributing significantly to global CO2 emissions. China, the United States, India, Russia and Japan respectively account for the highest amounts of CO2 emissions.
The bar graph on the right displays the total amount of CO2 emissions released by those five countries in 2020, along with their percentage contribution to greenhouse gas emissions. Clearly, CO2 emissions constitute a significant share of overall greenhouse gas outputs, with notable contributions observed particularly in China and Japan.
Subsequently, the line graph traces the trajectory of CO2 emissions in those five countries, where the data reveals a significant upward trend in CO2 emissions in China. Meanwhile, the remaining countries exhibit a relatively consistent pattern in the evolution of their CO2 emissions.
Power Generation: Coal vs. Renewables
The two line graphs contrast the production of electricity from coal sources against the consumption of renewable energy. While electricity production from coal sources is following a constant trend, the nations are not doing much when it comes to renewable energy, where India is the country that uses the most renewable energy.
The Toll on Wildlife: Threatened Species
The first bar graph examines the status of threatened mammal and fish species in the top five CO2-emitting countries in 2018. The second bar graph unveils a different narrative; the bottom five countries contribute less to global emissions. While this correlation warrants further exploration, it prompts us to consider whether lower emissions may indeed be associated with a lower number of threatened species.
In response, the following recommendations are proposed to guide collaborative efforts towards a sustainable and resilient future:
Global Collaboration: Nations, particularly the top emitters, must commit to CO2 emissions reduction and participate in international initiatives to address climate change.
Renewable Energy Acceleration: All countries, especially those heavily reliant on coal, should prioritize and accelerate efforts to increase the share of renewable energy in their energy portfolios. Investment in research, development, and implementation of sustainable energy technologies is paramount.
Conservation Initiatives: Nations with high emissions must implement robust conservation programs to mitigate the impacts on threatened species. Conversely, lower emitters should continue efforts to maintain a positive outlook for their wildlife.
Aforestation and Reforestation: Invest in afforestation (planting trees in areas that were not forested) and reforestation (replanting trees in deforested areas) projects to absorb CO2 from the atmosphere.
Carbon Capture and Storage (CCS): Develop and implement technologies that capture and store CO2 emissions from industrial processes and power plants, preventing them from entering the atmosphere.
Public Awareness and Education: Increase public awareness about the impact of individual and collective behaviors on CO2 emissions. Education campaigns can encourage more sustainable choices in daily life.
By combining these recommendations and tailoring them to specific regional contexts,the governments, industries, and individuals can contribute to a significant reduction in CO2 emissions, fostering a more sustainable and resilient planet.
Antarctica has been suffering for years due to the high CO2 emission levels around the globe.
I have brought an expert that would be able to shed light on the matter based on personal experience and what he and his family have been witnessing for the past decades.
Please help me in welcoming Frosty the Penguin!
Frosty was born and raised in Antarctica by a family of scientists.
His grandfather was among the first penguins to witness the melting of glaciers and the family kept records of changes that have occurred throughout the years in Antarctica.
While growing up, his surroundings were changing rapidly due to higher temperatures.
The sled that he used to play at with his penguin friends has turned into water; friends from other species have already left, or even died at sea.
Today Carbon Dioxide levels are rising rapidly from 400mg/L in 2019, to 409mg/L in 2020 to reach 420mg/L in 2021 due to the burning of fossil fuels, industrial processes, and tropical forest destruction.
As a result, Glaciers are rapidly melting and Frosty is facing the danger of migration or even death.
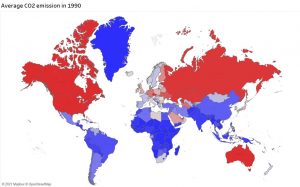
CO2 emission in 1980 started increasing drastically in countries like China going from 1.5 gigatons of CO2 to a record high of 11 gigatons in 2017!
Also, countries like Indonesia have witnessed a consistent increase in emissions while we see that Germany in gypsy blue has seen a drop in their emissions despite being the number 1 producer in Europe; they must be doing something right.
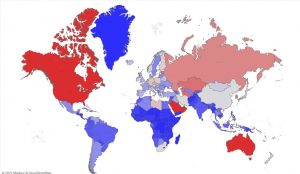
Based on his recent study in 2018, countries like USA, Canada, Russia, Australia and China are among the highest emitting countries of CO2 compared to the European Continent (excluding Russia), the African continent and South America.
For Frosty, this means that the sea ice extent which represents the area of ocean where at least 15 percent of the surface is frozen has been shrinking especially in recent years due to our negligence.
However, it is still not too late to help Frosty have his home back!!
To decrease the level of CO2 emissions, many solutions are available such as:
Substituting car trips with bike rides or any form of public transportation.
Apply Emission Regulations on automobiles
Plant trees
Switch to Clean Energy
All of these solutions are easily implemented through deploying bicycles for rent off the streets, Carpooling or using Hybrid/Electric Cars as well as renewable energy.
The cheapest and considered to be one of the most efficient ways of reducing CO2 emission is planting trees to absorb and store the carbon dioxide in the atmosphere.
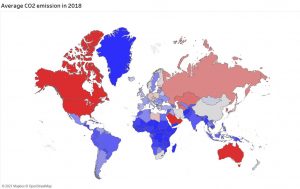
We can see these reforms being applied mostly in the European continent, Eastern and Western, which lead to the decrease in the level of CO2 from 1990 till 2018 as per the World Map visualization.
We urge countries to follow the steps of Europe and ameliorate their CO2 emissions by planting trees, adopting renewable energy and encouraging people to use lower emitting means of transportation