How often do you crash into potholes and hope that your car is still fine ?
We encounter them daily—the potholes, the fissures, the decliningcondition of Lebanon’s streets. It’s a commongrievance. However, is the weight of this crisis distributedfairlythroughout the nation? The anecdotal evidence indicates it’s poor everywhere, but the data uncovers a more concerning and systemic narrative of inequality
Problem Highlight
We hear about bad roads and potholes everywhere in Lebanon
One big problem is the condition of the roads that is immensely different in districts compared to others .
Is the crisis the same everywhere? The data was showing the truth
The Evidence
To transcend anecdotes, we illustrated the informationregarding road conditions throughout Lebanon. The outcomepresents a distinct and disquietingimage.
This visualrepresentationserves as a diagnostic instrument. Every point indicates the road status in a particularregion, and its locationnarrates a tale:
The moreto the right a point is, the poorer the road conditions.
The figurelinked to the point preciselymeasures “how severe” the circumstancesare
Revelation: The Story is in the Distance
The most startling realization is not only that some points are on the right, but also how far apart they are.
The chart’s arrows draw attention to the stark contrast between the areas with the best and worst maintenance. The disparity in infrastructure upkeep and care that exists in the real world is directly reflected in this physical distance on the chart. We may infer a history of unequal budget allocation and focus from the data, which shows an uneven distribution of the problem.
Clearly , Akkar is the center of this issue
Its data points are pushed as far to the right as possible, indicating that this area is most affected by the collapse of the infrastructure.
Why This Matters: The Human Impact
How does it affect citizens’ daily life ?
More traffic jams
More accidents
Increased danger in general
More floods
Inaccessible areas
Car damage
This goesbeyond uncomfortable car journeys. The deterioration of road infrastructure leadstosignificant human and economic impacts:
Economic Expense:Increased traffic congestion and notablevehicle damage raise the expenses of living and business.
Public Safety: Bad roads resultinahighernumberof accidents and greaterrisk for everyindividual.
Social Isolation: Remoteregionsmay become disconnected from necessary services, jobopportunities, and social networks
The WayAhead: A Solution InformedbyData
So, whatstepsshould we takenext? This informationoffers a straightforward,practicalframework for resolvingtheissue.
The approach is simple:
Focuson Action: Begin maintenance and budget distribution in the sectors where the dots are furthest to the right—the areas in the most urgent condition.
StagedRecovery:Slowlyallocate resources to the moreintactregions,developing a systematic,stagedstrategyaccording to levelofdamage
The goal is to transform data into a tool for decision-making. We now have the evidence to move from nearly no clue on what was happening to a strategic, plan for Lebanon’s road network.
Lebanon’s landscape is full of cultural, historical, and natural assets, yet tourism development across the country remains uneven. Using the UNDP Tourism Readiness dataset (1,136 towns across 25 districts), this analysis uncovers where Lebanon’s hidden tourism opportunities are and which regions lack the infrastructure to support them.
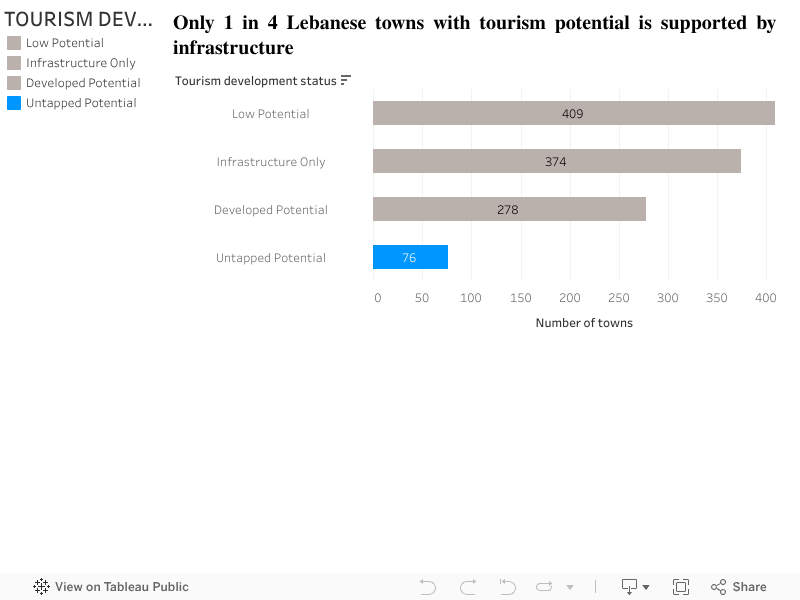
Tourism Potential Exists, But Not All Towns Are Developed
To understand tourism readiness, every town can be classified into one of four groups:
Developed Potential: Towns with both potential and infrastructure
Untapped Potential: Towns with potential but no infrastructure
Infrastructure Only: Towns with infrastructure but no identified potential
Low Potential: Towns with neither
Right away, a key insight emerges:
A considerable number of Lebanese towns have meaningful tourism potential but lack the infrastructure required to activate it.
This simple breakdown highlights that tourism potential is widespread across the country, but not always supported by visitor services such as guest houses, cafés, or restaurants.
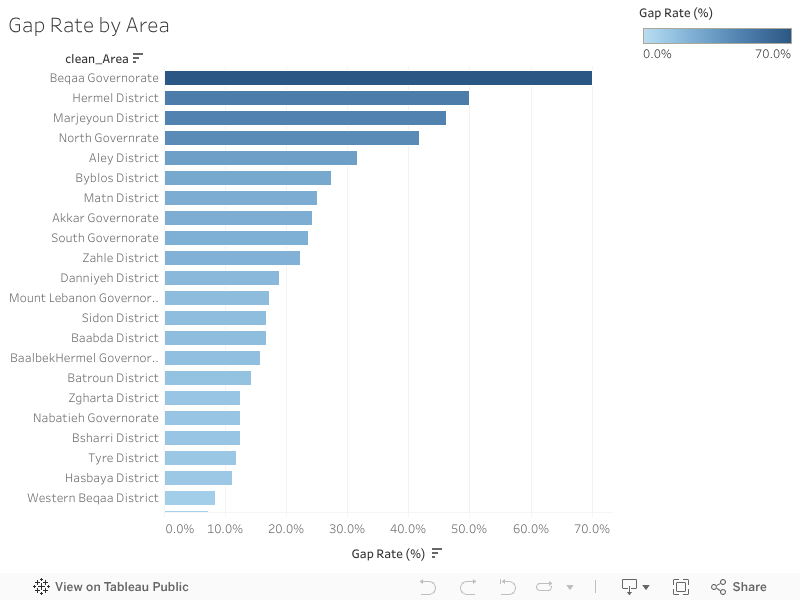
Some areas have much larger gaps than others
When looking at infrastructure gaps by area, the differences become clearer. Some districts have potential but very little tourism infrastructure to go with it.
In particular,
Beqaa
Hermel
Marjeyoun
show some of the highest gap rates. These places have attractions and natural assets, but not enough facilities to support tourism activity. Meanwhile, districts like Mount Lebanon and Byblos are more developed and have infrastructure that aligns better with their tourism activity.
This chart makes it easier to see which areas are lagging behind and where new investment could make a real difference.
What this means for tourism planning
Putting the insights together, a simple pattern appears:
Many towns across Lebanon do have tourism potential
But a noticeable share of them don’t have the infrastructure to support visitors
The largest gaps show up in specific districts, not everywhere
Improving basic services in these places could unlock new opportunities
Instead of focusing only on areas that are already popular, these findings suggest that Lebanon has several underdeveloped regions that could become strong tourism spots if they receive proper attention.
Conclusion
Lebanon already has the natural and cultural foundations for tourism. The challenge isn’t a lack of potential, it’s the uneven distribution of infrastructure.
By identifying where the gaps are, the data gives a clear starting point for planners, municipalities, and anyone interested in local development. Investing in infrastructure in high-potential but underserved towns could help bring more balance to Lebanon’s tourism map and open opportunities in regions that are currently overlooked.
Thousands of students in Lebanon are underserved by the concentration of educational opportunities in a small number of governorates. Policymakers must make investments in areas that lack public branches, colleges, and educational resources in order to create a more inclusive future.
1. A Landscape of Uneven Learning Opportunities
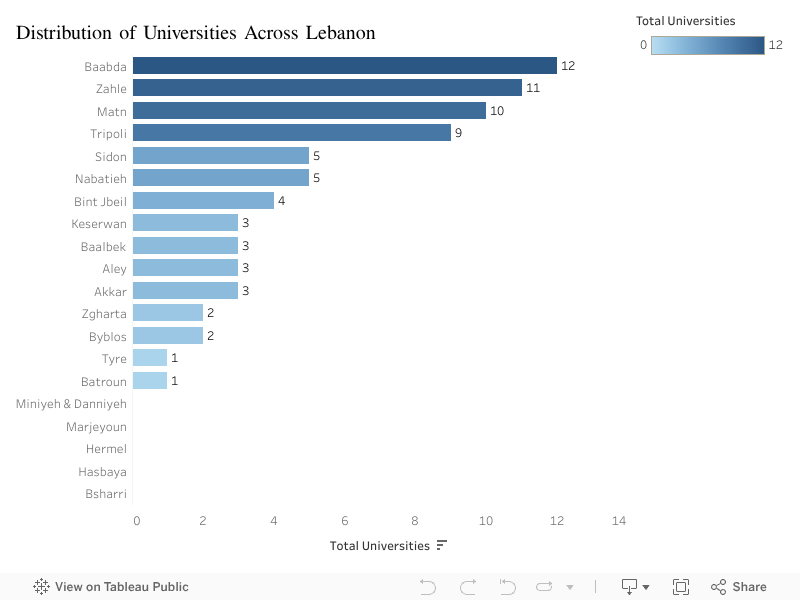
Lebanon’s education system has long been viewed as a regional strength but this strength is not evenly distributed. By mapping universities, Lebanese University (LU) branches, and the availability of educational resources across governorates, a clear pattern emerges: a select few governorates enjoy strong coverage, while others have limited or almost no access.
The visualization shows that:
Baabda, Zahle, and Matn dominate in the number of universities.
Meanwhile, areas like Bsharri, Batroun, Hermel, and Hasbaya have only 1 or zero universities.
This imbalance shapes future opportunities. Where a student is born should not determine how far they can go but right now, it often does.
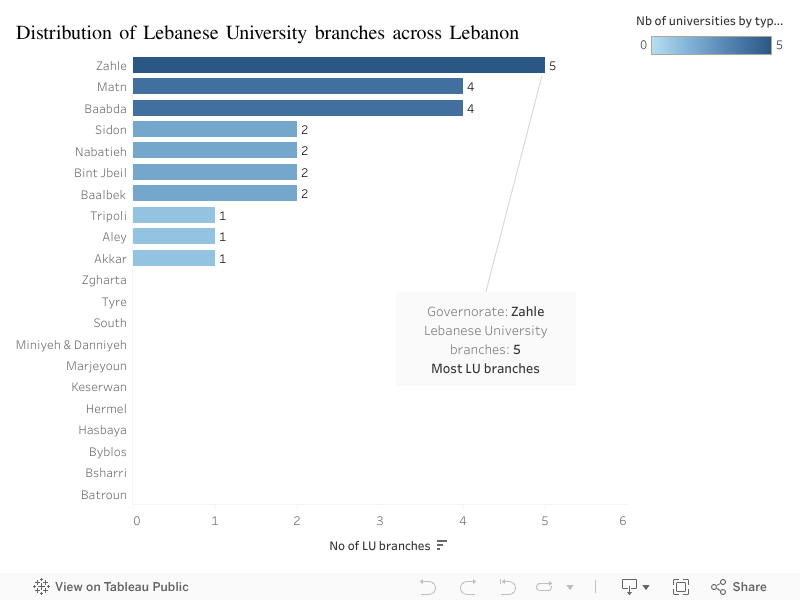
2. Public Higher Education Is Even More Concentrated
Access to affordable education is even more unequal.
Zahle and Matn lead with 5 and 4 LU branches.
Many areas including Tyre, Akkar, Zgharta, Hasbaya, Hermel have one or no branches.
Several governorates have none at all, forcing students to relocate or drop out.
This reinforces a cycle: private universities cluster in the center, while public universities remain scarce outside major cities.
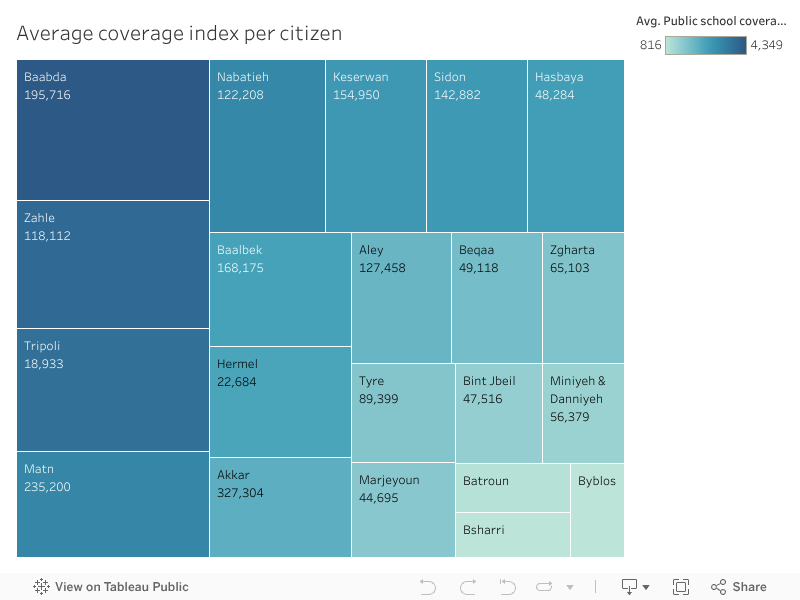
3. The Coverage Index: How Many Citizens Each University Serves?
To measure real accessibility, the coverage index compares each region’s population to the number of universities available.
Here the gap becomes dramatic:
In Baabda and Matn, one university serves fewer than 200,000 people.
In Hermel, Bsharri, and Tripoli, a single university covers more than 300,000 residents.
The message is clear: some regions are overserved, while others are severely underserved.
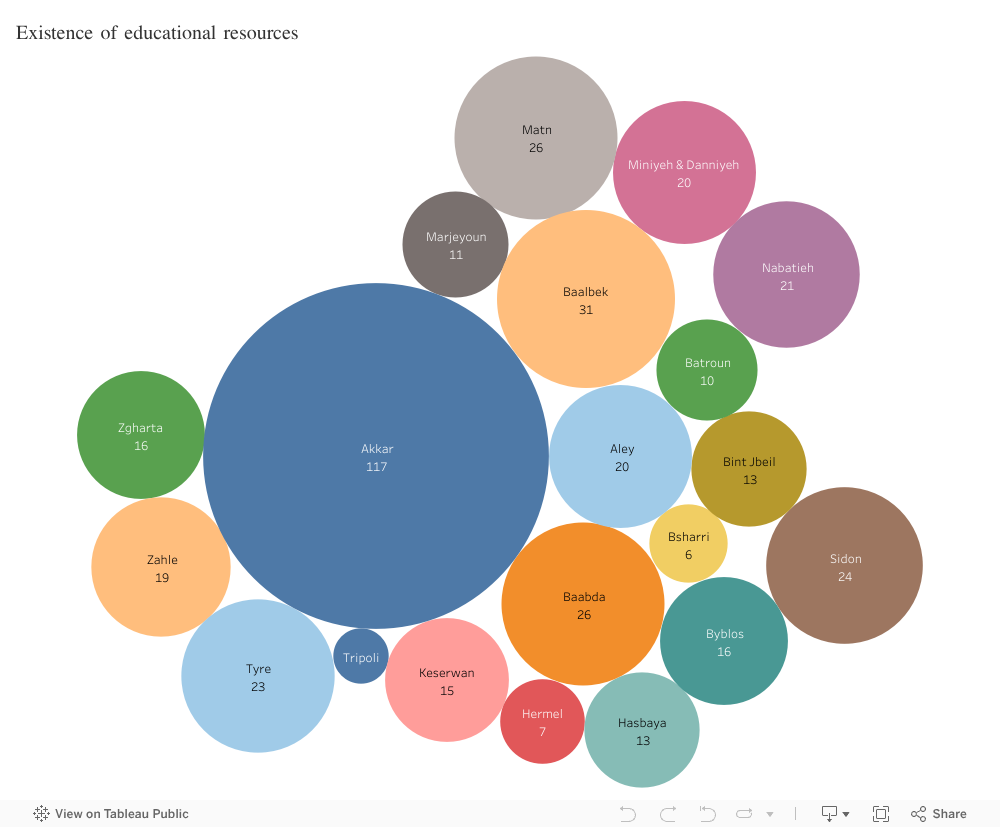
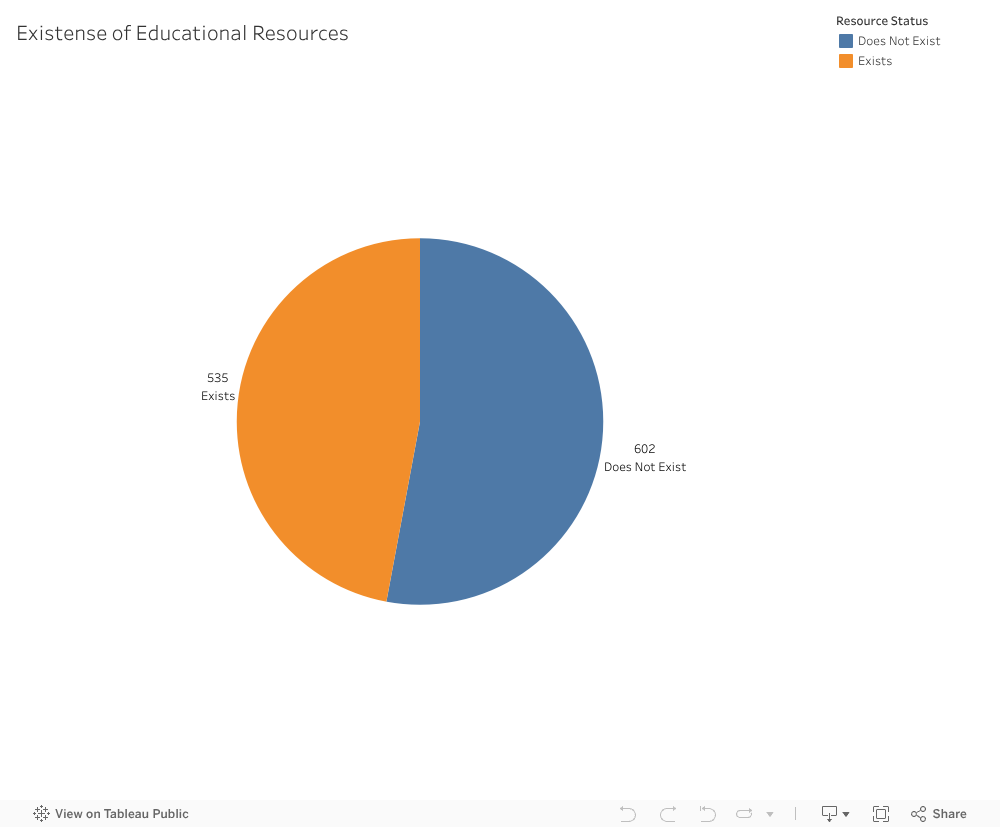
4. Do Educational Resources Exist Where They’re Needed Most?
When we look at the distribution of educational resources—libraries, cultural centers, labs, and learning facilities another pattern emerges:
Akkar, Baalbek, and Baabda have the highest counts.
Remote districts like Bsharri, Hermel, Batroun, and Marjeyoun have almost none.
This highlights a critical insight: some areas have the right infrastructure but lack universities, while others have universities but no supporting learning ecosystem.
5. What This Means for Lebanon
Lebanon’s most significant educational challenge is not quality but fairness. The maps reveal a structural inequality that affects:
university enrollment
student mobility
long-term employment opportunities
economic development in rural areas
By investing in the regions with the lowest coverage and resource availability, Lebanon can create a more inclusive and productive society.
Call to Action
We recommend a targeted educational investment plan for underserved governorates, focusing on:
Opening new LU branches in areas with zero public presence
Strengthening educational resources where population density is high
Supporting private institutions willing to expand beyond major districts
Digital learning infrastructure for remote areas
Education shouldn’t depend on geography. With intentional planning, it doesn’t have to.


 Lebanon’s landscape is full of cultural, historical, and natural assets, yet tourism development across the country remains uneven. Using the UNDP Tourism Readiness dataset (1,136 towns across 25 districts), this analysis uncovers where Lebanon’s hidden tourism opportunities are and which regions lack the infrastructure to support them.